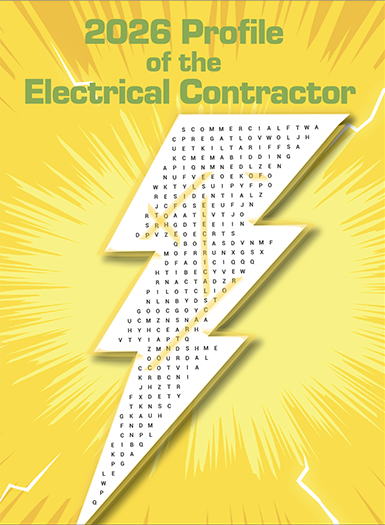
Editor's Note: Our word search graphic contains the words "Profile," "of," "the," "Electrical" and "Contractor," but there are many more. Find a list of all the hidden words in this month's Editor's Eye or click here to try out a digital version of the word search.
Every two years, you can expect the results from another survey of electrical contractors showcasing the work you do. Our 2026 Profile of the Electrical Contractor is a look back at your 2025 business experience. It shows a bit of a reversal from the growth you noted in 2024. Two years ago, firm size and revenues were on the rise following the pandemic. This year, we’re seeing the opposite.
We received responses from 926 of you and learned that, over 2025, firm size fell along with revenue. Across the total sample, significantly more firms reported having 1-9 employees than in our 2024 survey, at 58%, versus 51% two years ago. This drop in employee numbers reverses a growth curve first noted in our 2022 post-pandemic report.
On the positive side, the reduction in overall firm size hasn’t come with an increase in layoffs. Employee rosters held steady at most firms—68%—with only 13% seeing a reduction. Growth was much more common at firms with 10 or more employees, with 44% adding workers in 2025, compared to 11% for those with 1–9 employees. Respondents from smaller firms were most likely to report size stability, at 78%. The growing presence of these companies across our sample, with employee head counts remaining stable, could be the result of an uptick in new startups, rather than a larger labor force reduction.
Reported revenue has fallen in line with average firm size. Overall, firm revenue declined from 2024 to 2026, with a significant shift toward lower sales. The share of firms with less than $1 million in revenue has increased, while the percentage earning above that mark decreased. The only bright spot in this picture is with firms having 5–9 employees. Here, 2025 revenue above $1 million was reported by 53% of respondents, versus 39% two years ago.
In another shift from 2024’s survey, you reported lower revenue from commercial/industrial/institutional (CII) projects in 2025. This reduction was driven by a specific decline in commercial work, rather than in the industrial or institutional sectors.
Read on for a fuller discussion of this year’s survey findings, which will continue next month. You can also visit ECmag.com/profile for an archive of past results for comparison.
Aging holds steady
Two years ago, we noted that, after years of climbing, the average age of our respondents had held steady. This holds true this time around, with the average age at 59 years old, which is statistically unchanged from 2024’s 58.6 years. The youngest age group, 18–34, remained statistically unchanged from 2024 at 4%, after growing in our last survey. The numbers of those between 35 and 54 held steady at 27%. However, the number of older electrical contractors is ticking upward; there are now fewer aged 55–64, while the ranks of those over 65 have grown (see Figure 1). That increase is driven by significantly more contractors aged 75 and up (not shown in the figure).
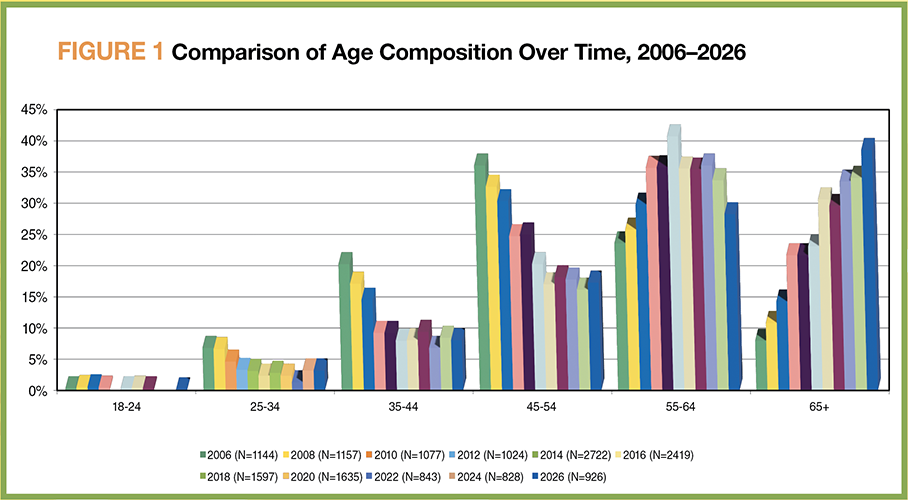
Figure 1
Ages remained steady across firm size compared to 2024. As seen two years ago, electrical contractors working for larger companies continue to be younger, averaging 56.5 years, while those in companies with fewer than 10 employees average 60.8 years.
The age of the companies where respondents work also stayed steady, averaging 33.7 years. And smaller firms tend to be younger, at 27.3 years, while larger firms average 42.5 years in business.
The proportion of female respondents, 5%, was also consistent with 2024’s figure. As was the case two years ago, these participants were less likely to work in very small firms. Additionally, in a shift from 2024, women are less likely to work in firms with 10–19 employees and more likely to work in shops with more than 50 employees.
As in previous Profile surveys, most respondents—70%—are owners and top managers, and 12% hold a master electrician or similar title.
Size matters
Company size and revenues contracted in 2025, compared to 2023, reversing a growth trend we noted over the previous few surveys. Among the total sample, significantly more firms have 1–9 employees (58%) and fewer have 10 or more employees (42%). Two years ago, that split was about 50/50 (see Figure 2).
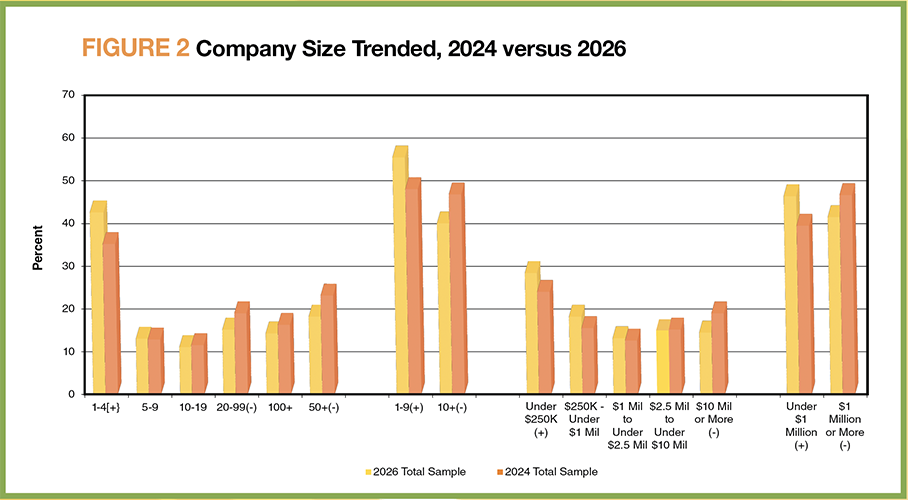
Figure 2
As noted above, it could be that these numbers are the result of more small firms, rather than an overall reduction in workforce. Supporting this idea, 63% of respondents said their employee rolls remained steady in the previous 12–18 months (Figure 3).
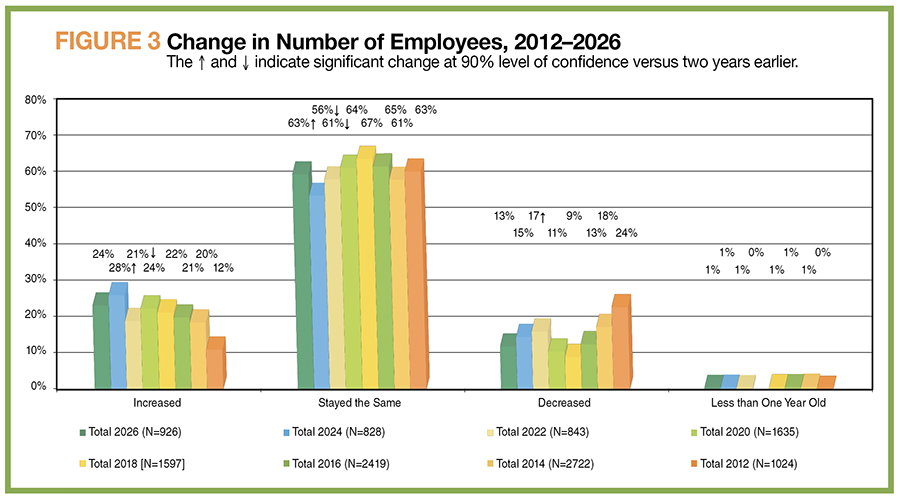
Figure 3
Employee growth was more likely to occur in larger firms, as shown in Figure 4. Only 11% of companies with 1–9 employees added workers during the previous 12–18 months, while 44% of those with 10 or more employees added staff. Smaller firms also were less likely to have cut their roster (11%), compared to their larger counterparts (15%).
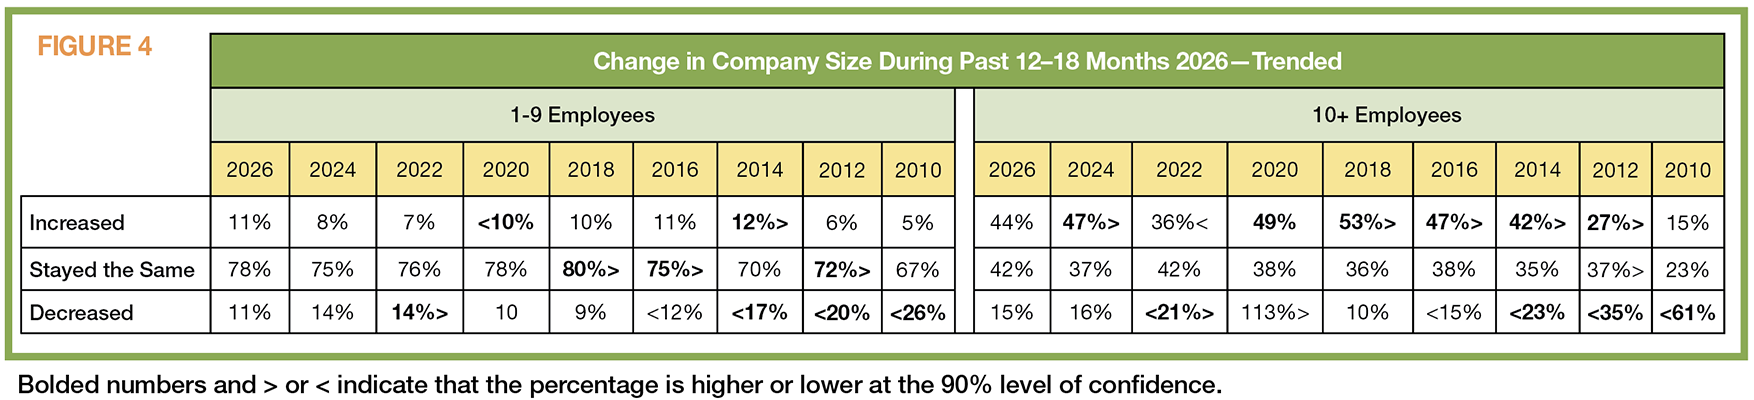
Figure 4
Finding new, qualified employees continues to be a challenge, regardless of company size. This is a trend dating back to at least our 2020 survey. Respondents were asked to comment on the job market at the time they were completing the survey, between January and March 2026.
Responses were similar to those from 2024, with 56% saying they had difficulty finding trained workers and 27% having difficulty retaining trained workers. These challenges are more significant for firms with more than 10 employees. Among these companies, 73% reported difficulty finding skilled workers and 35% noted challenges retaining them. See Figure 5.
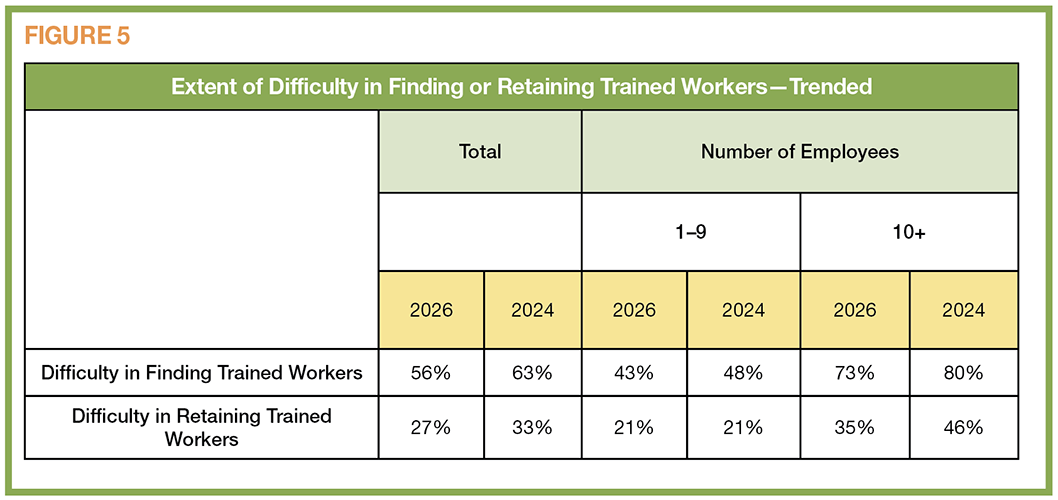
Figure 5
In another shift across the total market, respondents reported a significant move toward lower sales. The share of firms with less than $1 million in sales increased to 49% from 42%, while those over $1 million decreased to 43% from 49%. This trend was noted across all company-size categories.
Revenues also fell across all categories, except for companies with 5–9 employees, where the reverse occurred, as noted above (see Figure 2).
Earnings by category
In our 2024 coverage, we noted a shift in the categories earning electrical contractors their highest revenues over the previous year, with new construction gaining ground over maintenance/service or repair (MSR). That balance shifted itself again with this year’s survey, as respondents reported on their 2025 results. As Figure 6 illustrates, new construction fell to 31.7% of sales/revenue in 2025, from 36.6% in 2023, while MSR climbed to 39.7% from 35.7%. These sectors were essentially tied two years ago.
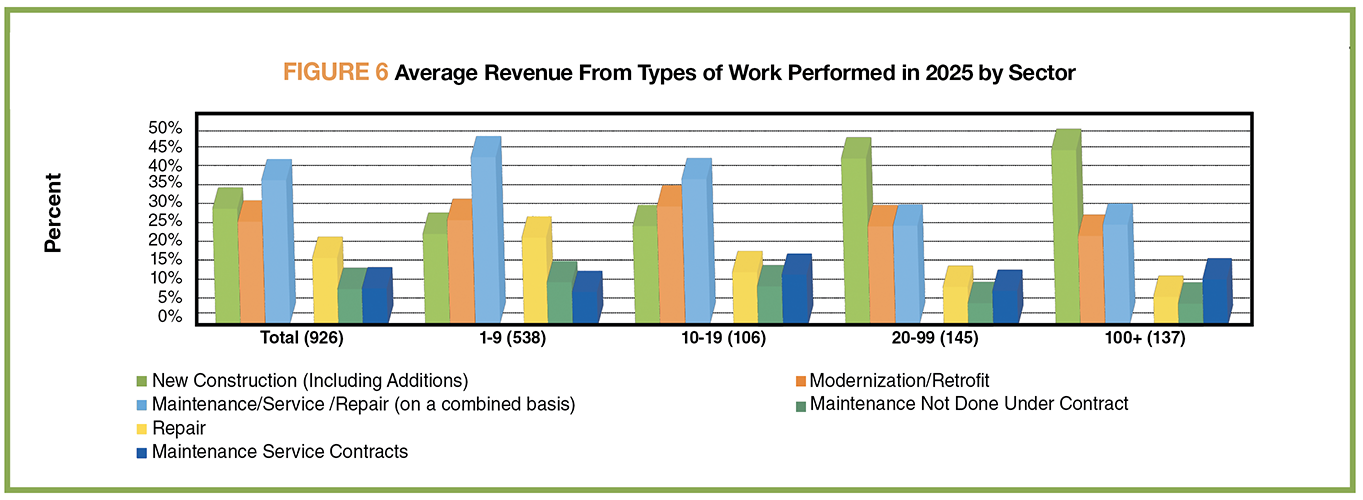
Figure 6
Within MSR, repair work predominated, with 18.7% of total sales/revenue (up from 15.4% two years earlier). Maintenance/service contracts went from 10.6% to 9.1%. The drop in new construction work was especially pronounced in smaller firms, while repair posted a small, but significant, gain in larger companies. (10+ not shown.)
Taking a different cut, we also asked respondents to rank the revenue importance of 14 project types in their 2025 results, as shown in Figure 7. Lighting and electric power transmission and distribution continue to account for the largest share of revenue, followed distantly by industrial systems. An interesting historic note is the shift in the relative shares of revenue from electric power and distribution and lighting flip-flopped between 2016 and 2018, when lighting edged into the top position. We posited then that this indicated electrical contractors were moving into valued-added offerings found in the lighting category.
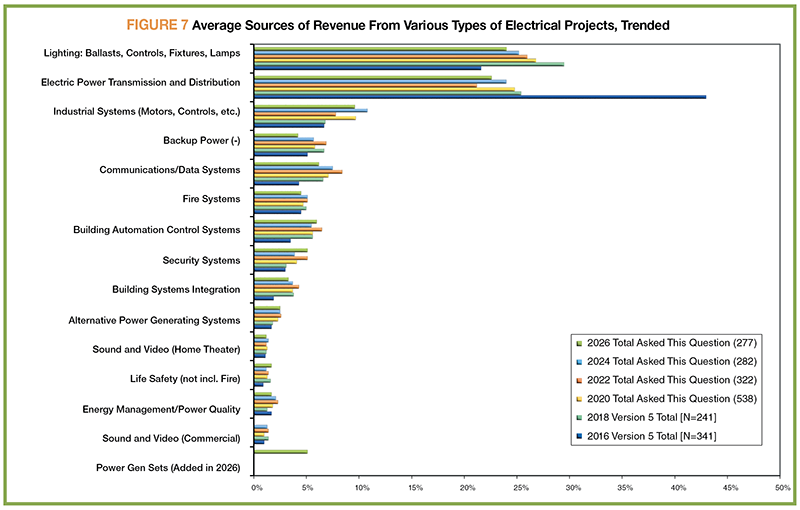
Figure 7
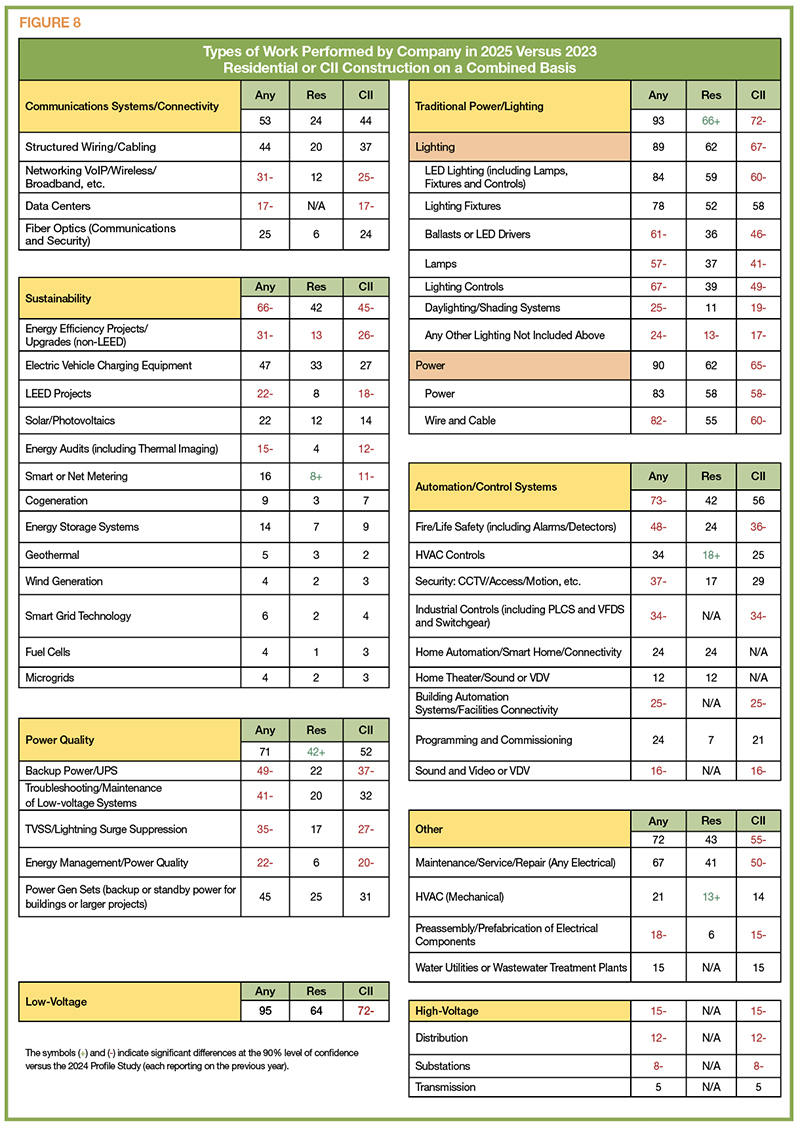
Figure 8
To break these statistics down even further, we asked about the work you performed in 2025 in a range of more than 40 different project types in residential and CII settings, shown in Figure 8. Compared to the figures reported for 2023, we found a statistically significant decline across many major categories and subcategories. This is driven by a broad decline in CII work without many comparable upticks in residential projects. Specifically:
Many types of traditional power and lighting, automation/control systems, power quality and sustainability categories—along with communications and “other” project types—are all down.
Very few areas show stability, compared to our 2024 report, and none show significant growth when CII and residential are combined.
Interestingly, categories in which participation remained stable in 2025 include a number focused on home or on-site energy management, possibly a response to rising utility costs across the country. These include:
- Electric vehicle charging, at 47%, remains unchanged.
- Solar, at 22%, remains unchanged.
- Energy storage is unchanged at 14%.
- HVAC controls is unchanged at 34%.
- Home automation is statistically unchanged at 24%.
- HVAC (mechanical) is unchanged at 21%.
Looking at CII on its own, this work is more often the purview of larger firms.
Participation in CII categories rises quickly with company size. Firms with fewer than 10 employees, especially those with 1–4 workers, are significantly less likely to participate in work with specialty systems such as automated building systems, industrial controls and programming and commissioning. In contrast, companies with more than 10 employees—especially those with 20–99 and 100-plus employees—over-index in these areas. This difference suggests that larger firms increasingly work as integrated systems contractors, rather than solely as electrical installers. See Figure 9.
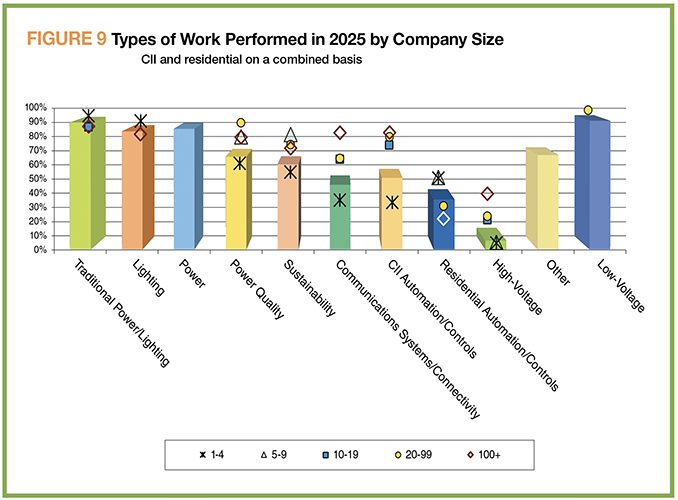
Figure 9
However, among all firms, work remains focused on standard bread-and-butter electrical projects. Roughly nine in 10 respondents report working in at least one such category, and traditional power/lighting and ancillary work is nearly universal. The most common categories across all firm sizes include core power, wire and cable, LED lighting and lighting fixtures.
Participation in government work tracks closely with what we found two years ago. As Figure 10 shows, more than half (58%) said they’d done government work since 2024, and 59% expect to work in such projects in 2026. In both cases, work for local government is most common, followed by work for state and federal clients. Larger firms are more likely than their smaller counterparts to do any of these projects and to work for more than one government entity. So, firms with 10 or more employees were about twice as likely as smaller companies to have done any government work, as well as any local or state work. And they were about four times as likely to have worked with the federal government. Similar differences were observed when participants were asked what they expected for 2026.
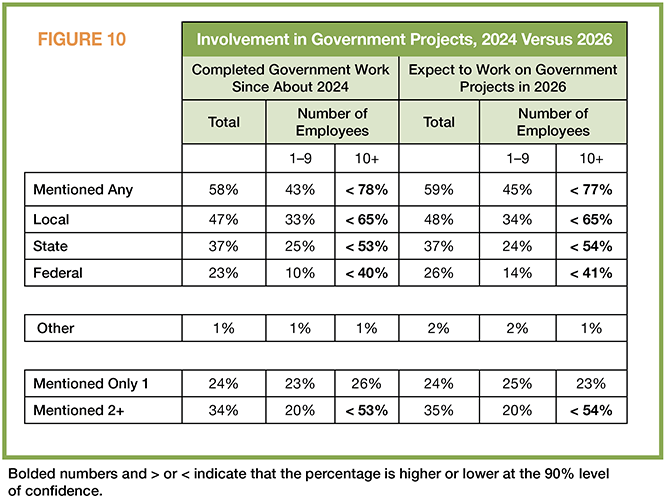
Figure 10
Looking at electrical contractors’ service territories, we found that, similar to 2024, about 40% work in multiple states. And like 2024, these companies are more likely to be larger firms. This has held true as far back as 2014, with about 55% of companies with 10 or more employees working in two or more states, roughly twice the percentage of those with 1–9 employees.
Lowdown on low-voltage
Low-voltage work covers a broad category of assignments, encompassing fiber optic cable installation, networking, LED lighing controls and structured wiring, among the most common projects. As a result of this wide reach, 95% of our respondents reported work in this category, and about a quarter already have a separate low-voltage division. Not surprisingly, larger organizations are more likely to go this route—a trend that grew significantly since our last report, with 44% of firms with 10 or more employees having a separate low-voltage group in 2026, versus 38% in 2024 (not shown).
Systems integration is a big part of electrical contractors’ low-voltage business, especially with today’s rapid buildout of data centers related to artificial intelligence (A.I.). As Figure 11 shows, the percentage of firms engaged in these projects has remained steady since 2024, with more than half of all respondents reporting work in this field. Low-voltage systems integration is the most frequent job, at 48%, followed by design and specification of those systems at 36% and installation of data/telecom centers at 25%. The more sophisticated tasks of commissioning and programming and data center design or specification came in at 27% and 18%, respectively.
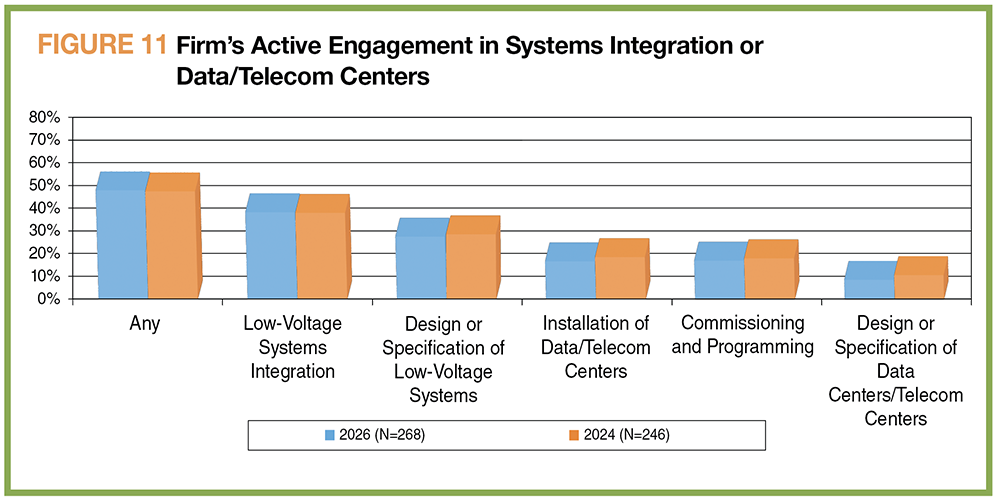
Figure 11
Looking at work with integrated systems, almost 60% of respondents said their firms specified and installed lighting. As has been the case historically, this is twice the percentage of those who only do installation. For other integrated systems, as Figure 12 shows, the percentages of contractors both specifying and installing ranges from 11% to 22%. One notable shift upward is in the HVAC category, including controls, which jumped to 11% this year, up from 5% in 2024’s survey.
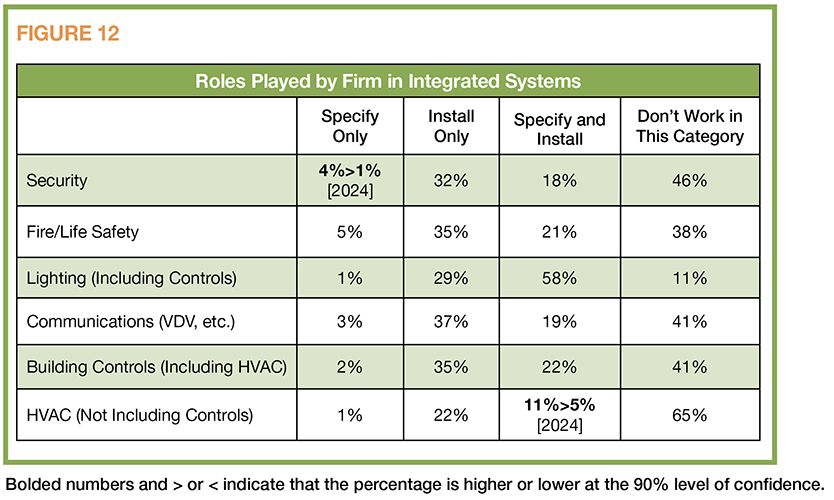
Figure 12
Following the money
This year’s survey highlighted a flip from our 2024 report when it comes to the kinds of work most important to electrical contractors’ balance sheets. Two years ago, when describing work from 2023, you told us that new construction revenues had edged out those from MSR projects, at 37% to 36%, respectively. This year, looking at 2025 performance, that lineup is reversed, with MSR now responsible for 39.7% of revenue and new construction falling to 31.7%. (See Figure 13.)
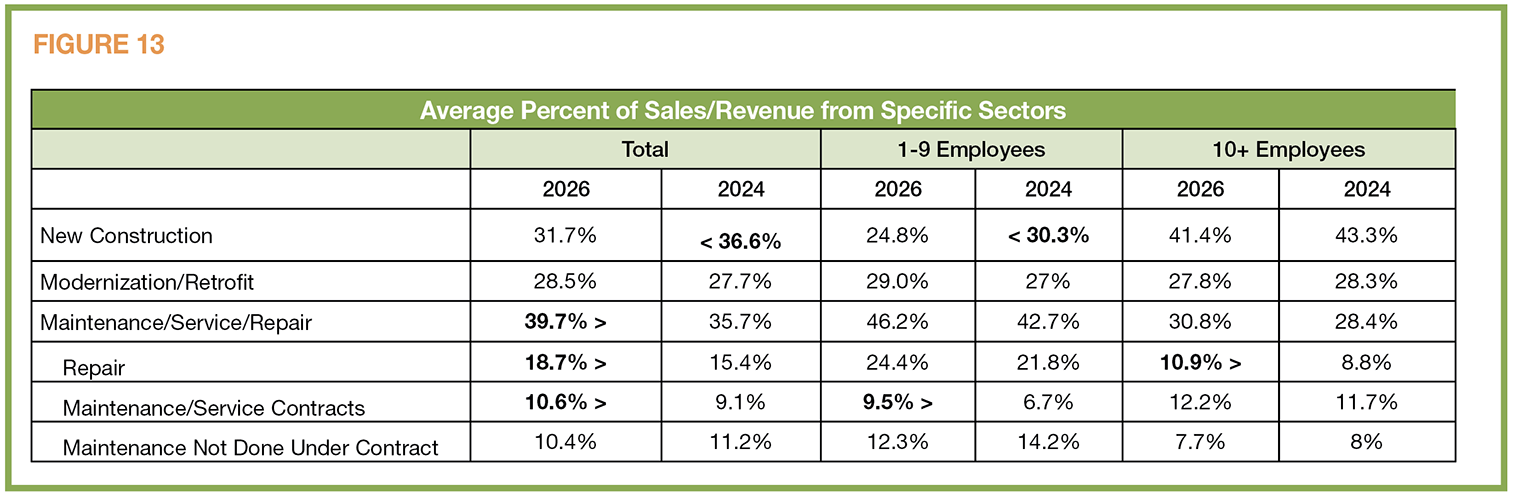
Figure 13
Obviously, this change runs in parallel with the fall in new construction across the building industry. And our 2024 findings might have been a post-pandemic anomaly, given the drop in new construction since the Great Recession. In our 2008 survey, which looked at work in 2007 (just before that, even), new construction accounted for an average of 43% of revenue across firms of all sizes. We’ve yet to return to anything close to that number.
Some other shifts by firm size include an uptick in repair work, led by a small but significant increase for companies with 10 or more employees. Additionally, smaller firms saw a small but notable shift in work related to maintenance and service contracts.
Revenues by building type
We also asked you about the importance of different building sectors to your firms’ bottom lines. CII work continues to predominate, but its importance relative to residential jobs has dropped a bit. Across all
firm sizes, the CII category was responsible for 48.5% of revenue—down from 55% in 2024’s survey—compared to 39.1% for residential, up from 35% two years ago.
The overall reduction in CII is specifically tied to a significant drop in commercial work, rather than in the industrial or institutional categories. However, commercial work, at an average of 24.6% of revenue, still dwarfs the other two categories, which are at 14.2% and 9.7%, respectively. Of course, relative importance shifts when we break down results by firm size, as shown in Figure 14. For example, single-family homes represent an average of 33.4% of revenue across all firm sizes, but jump to almost 50% of revenue for firms with fewer than 10 employees. Similarly, the nonbuilding (including utility) category pulls in an average across all firms of 12.5% of revenue, a figure that rises to 22.8% for the largest firms (100+ employees).
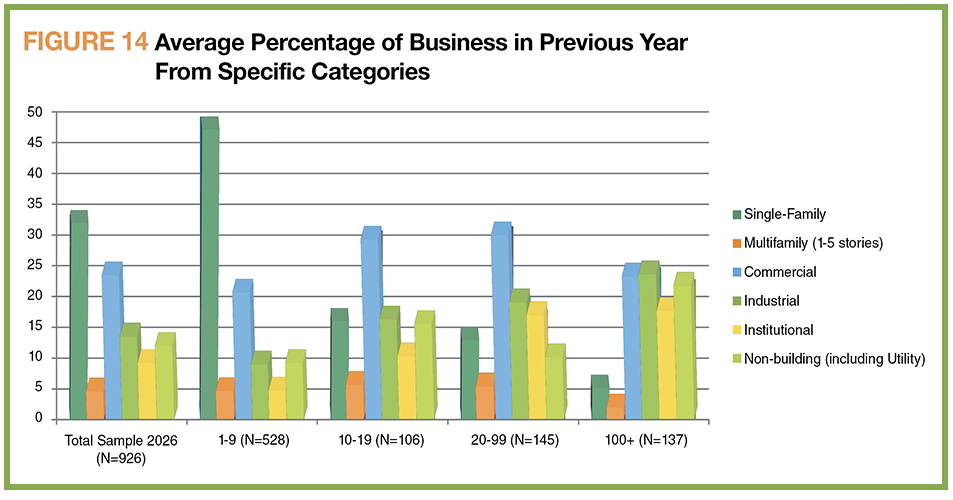
Figure 14
Other notable firm size differences:
- Commercial work predominates as soon as firms get past 10 employees, climbing to almost 30% of revenue, while single-family work accounts for less revenue.
- Industrial work’s importance rises significantly to 20% of revenue as firms cross the 20-employee threshold.
- Commercial, industrial and nonbuilding work come close to evening out for firms with more than 100 employees.
Bidding requirements
You reported that the need to meet requirements to bid a project has declined over the last two years, both in terms of person-hour mandates and safety programs. Across the total sample, 42%—down from 48% in 2024—reported requirements to have prequalified standards and safety programs in place before bidding on a project.
But, as we’ve previously found, this climbs with company size. Only 15% of firms with 1–4 employees noted these demands, while the figure jumped to 43% for firms with 5–9 workers. The percentage jumps again to 82% for firms with more than 100 employees.
Additionally, 19% of the total sample noted person-hour requirements for women, minorities or veterans. This was a significant drop from 2024, driven by a drop from 40% down to 32% among firms with 10 or more employees. This is another requirement that larger firms are more likely to face, rising to 49% for companies with more than 100 employees.
The percentage of firms meeting any of the special designation requirements remains low, at 17% across the total sample. And, unlike other data we’ve tracked, that figure doesn’t vary much with company size, with the two highest percentages occurring within the 10-or-more and 10–19 employee categories, at 19% and 24%, respectively.
Staying in training
In 2024, we noted a rise in the number of respondents reporting they’d attended college, and that figure has remained statistically consistent through this year’s survey at 60%. Consistent with previous findings, those in firms with 10-plus employees were more likely to hold a bachelor’s degree or higher, at 30%, versus 23% for those in firms with 1–9 employees.
But even for those with college degrees, professional training for ECs remains an ongoing requirement. This is certainly true for our respondents, with 74% reporting that they or someone in their firm has taken a course in the previous 12 months. And 84% plan to take training in the next 12 months to improve or broaden skills for certification, either in a classroom, in the field or online.
Since the pandemic, hybrid training approaches that combine in-person and online classwork have also become an option. We queried respondents as to whether they thought this alternative would continue into the future, and 66% said they did. This is a statistically significant drop from the 72% who agreed in 2024.
Regardless of the training method, respondents reported higher interest in technical rather than broader professional development, as shown in Figure 15. NEC use or changes tops the list at 62%—a significant jump from 50% two years ago, likely due to the 2026 code being released. Safety (electrical/personal/job site) was second, at 57%, followed by grounding and bonding at 43%.
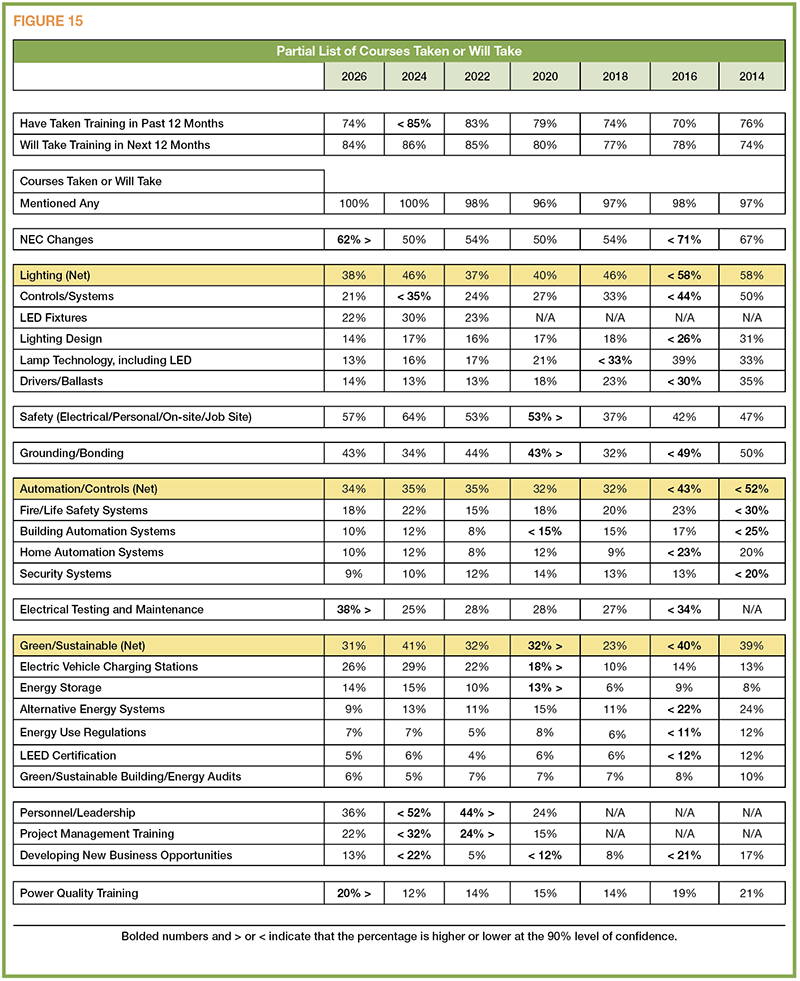
Figure 15
Interest in several nontechnical categories dropped, including personnel/leadership (to 36%, from 52%), project management (to 22%, from 32%) and developing new business (to 13%, from 22%).
Respondents noted similar levels of interest in individual course topics as in 2024, but there were a couple of exceptions worth noting:
- Interest in power quality training jumped to 20% from 12% two years ago.
- Interest in lighting controls training dropped to 21% from 35%.
- A.I. debuted as a training category in this year’s survey, and 14% of respondents noted an interest in the topic (not shown in the figure).
Electrical contractors continued to show enthusiasm for training, overall, with 80% indicating an interest in three or more topics.
Summing it up
Our last survey told a story of growth, with the industry emerging from the challenges of the pandemic and its effect on business and supply chains. While not exactly a step back, our 2026 report illustrates the challenges of the last two years, with tariffs and inflation slowing the rise in new construction we noted in 2024. Certainly, data centers are one sector of potential growth moving forward, along with the utility infrastructure needed to serve them. New industries bring new opportunities for growth, which you can count on us to explore in our next Profile in 2028.
Still to come
With too much data from our biennial survey to cover in just one article, we’ll continue our exploration next month. We'll cover firms’ business operations and bidding formats, along with coverage of the role electrical contractors play in specifying and substituting the products they install.
Methodology
The survey was conducted exclusively online among subscribers to ELECTRICAL CONTRACTOR magazine and its newsletters. In addition, 144 members of the ELECTRICAL CONTRACTOR Subscriber Research Panel also participated in the survey. The field period for the survey ran from Jan. 28 through March 31, 2026. A total of 926 participants completed the survey in that time.
As in 2024, the 2026 survey was only offered on the internet because of the dwindling participation in previous years through the mailed printed surveys. The online option was introduced in 2004.
We also attracted respondents through the weekly ELECTRICAL CONTRACTOR e-newsletter and with advertisements in the February and March print magazines that included a link to the survey using their subscriber number, which was then authenticated online.
As in 2020, 2022 and 2024, the proportion of the total respondents attributable to the print list was so low that weighting the data would distort the total statistics.
Each respondent who received the online survey was sent up to seven follow-up emails. For each completed survey, ELECTRICAL CONTRACTOR contributed $5 to charity. In addition, the magazine offered a sweepstakes drawing for a chance to win one of ten $150 Amazon gift cards. Panel members were also entitled to be entered into two monthly Panel sweepstakes for completing the Profile survey.
Since 2004, we have produced different versions of the survey. For the 2008 through 2016 Profile studies, there were four versions that had 30 common questions, differing on fewer than 10 questions. Since 2018, there have been seven versions.
This research was conducted by New York-based Renaissance Research & Consulting Inc. (www.renaiss.com), an independent market research firm that specializes in the construction industry among others. The survey was conducted using the Qualtrics survey platform.
We used ChatGPT in the development of the report. However, its findings were checked and modified by human analysts and editors.
Statistics
The margin of error on the total sample of 926 is +/–2.7% for percentages around 50%, (i.e., we are confident that a reported 50% will fall between 53% on the plus side and 47% on the minus side 90% of the time). Please note that different rules apply to testing of averages, which were also tested at the 90% level of confidence and are noted in the report.
A significant difference in the total sample between 2026 with a sample size of 926 and 2024 with a sample size of 828 is at least 4.4% at the 90% confidence level. Bold text and an arrow in the charts indicate significant difference and the direction of the difference. A (+) or (–) next to the title indicates a significant difference compared to its pair.
stock.adobe.com/Asta Desain, BrightSprout
About The Author

ROSS has covered building and energy technologies and electric-utility business issues for more than 25 years. Contact him at [email protected].