It’s a new year, but will it be different from last year? From 2012–2015, the wind was to our backs, and we made great strides. Total construction starts (breaking ground) grew between 11–14 percent. In 2016–2017, we maintained a spirited run, achieving 7 percent growth. Slowing to a jog in 2019, expect a repeat of 2018; this long-distance runner isn’t quite finished.
As in years past, our forecast is based on Dodge Data & Analytics’ “2019 Dodge Construction Outlook” and ConstructConnect’s “Tariffs, Trade & Transition: Post Election Design & Construction Outlook.” Dodge reported starts for the U.S. construction industry in 2018 grew by 3 percent ($806.8 billion). This year, expect a near repeat ($808.3 billion) with some variation in sector performance (see Figure 1). ConstructConnect’s report focused on put-in-place spending (total dollar value of construction work), finding a spending increase between 5–7 percent in 2018 and projecting nearly the same in 2019 between 5–8 percent.
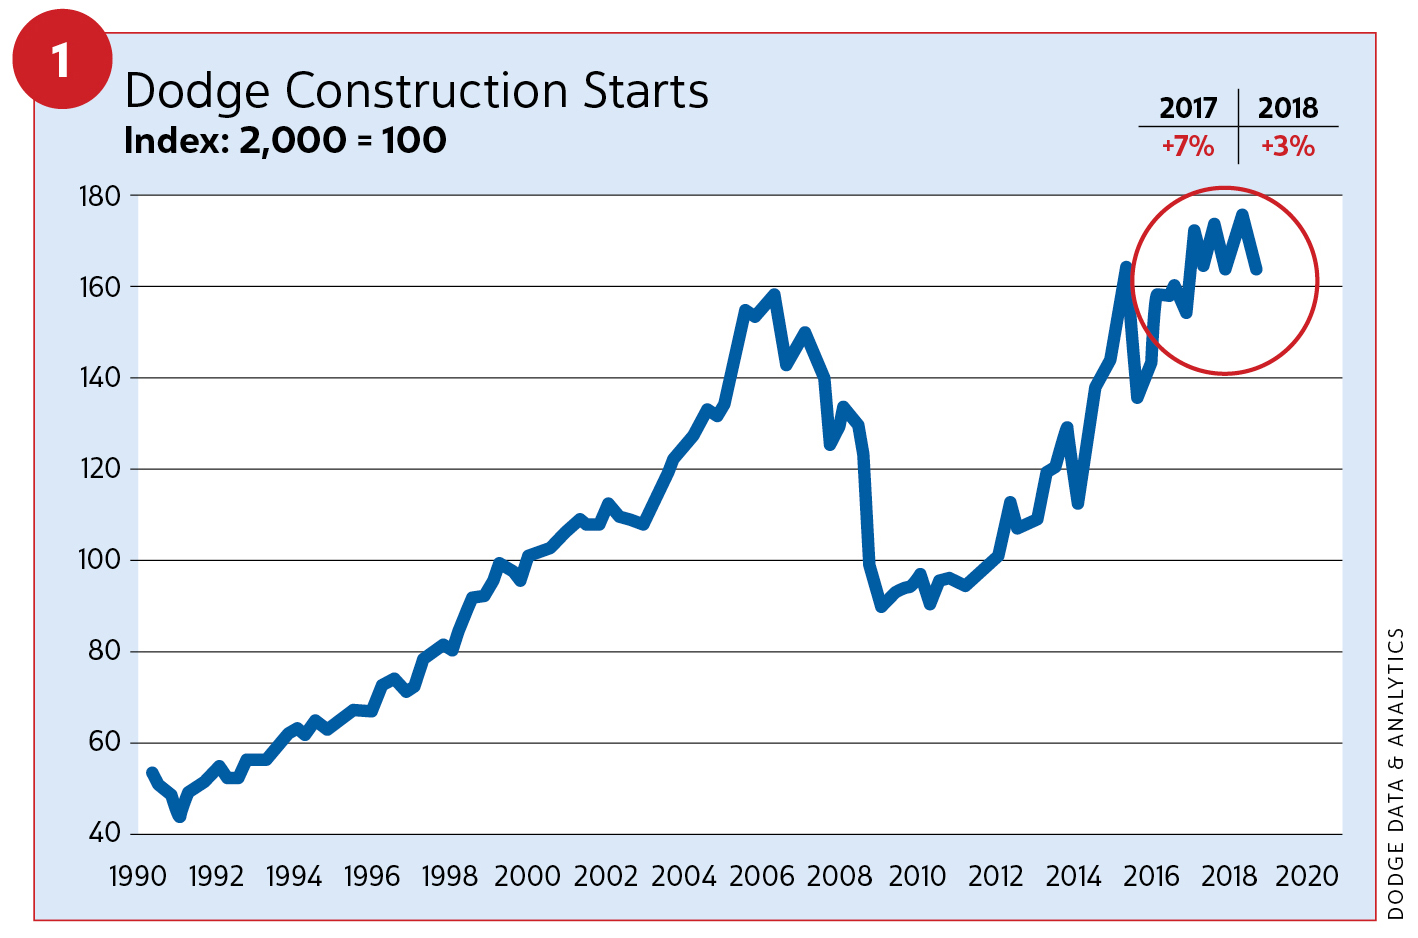
“Over the past three years, the expansion for the U.S. construction industry has shown deceleration in its rate of growth, a pattern that typically takes place as an expansion matures,” said Robert A. Murray, chief economist for Dodge Data & Analytics.
Strong economic fundamentals, including declining unemployment, managed inflation, modestly rising wages and happy consumers, have buoyed this modest construction growth. The difference this year may be an injection of uncertainty as the economic expansion matures.
In 2018, residential building starts grew, advancing in both single-famiy (6 percent) and multifamily (5 percent) construction (see Figure 2).
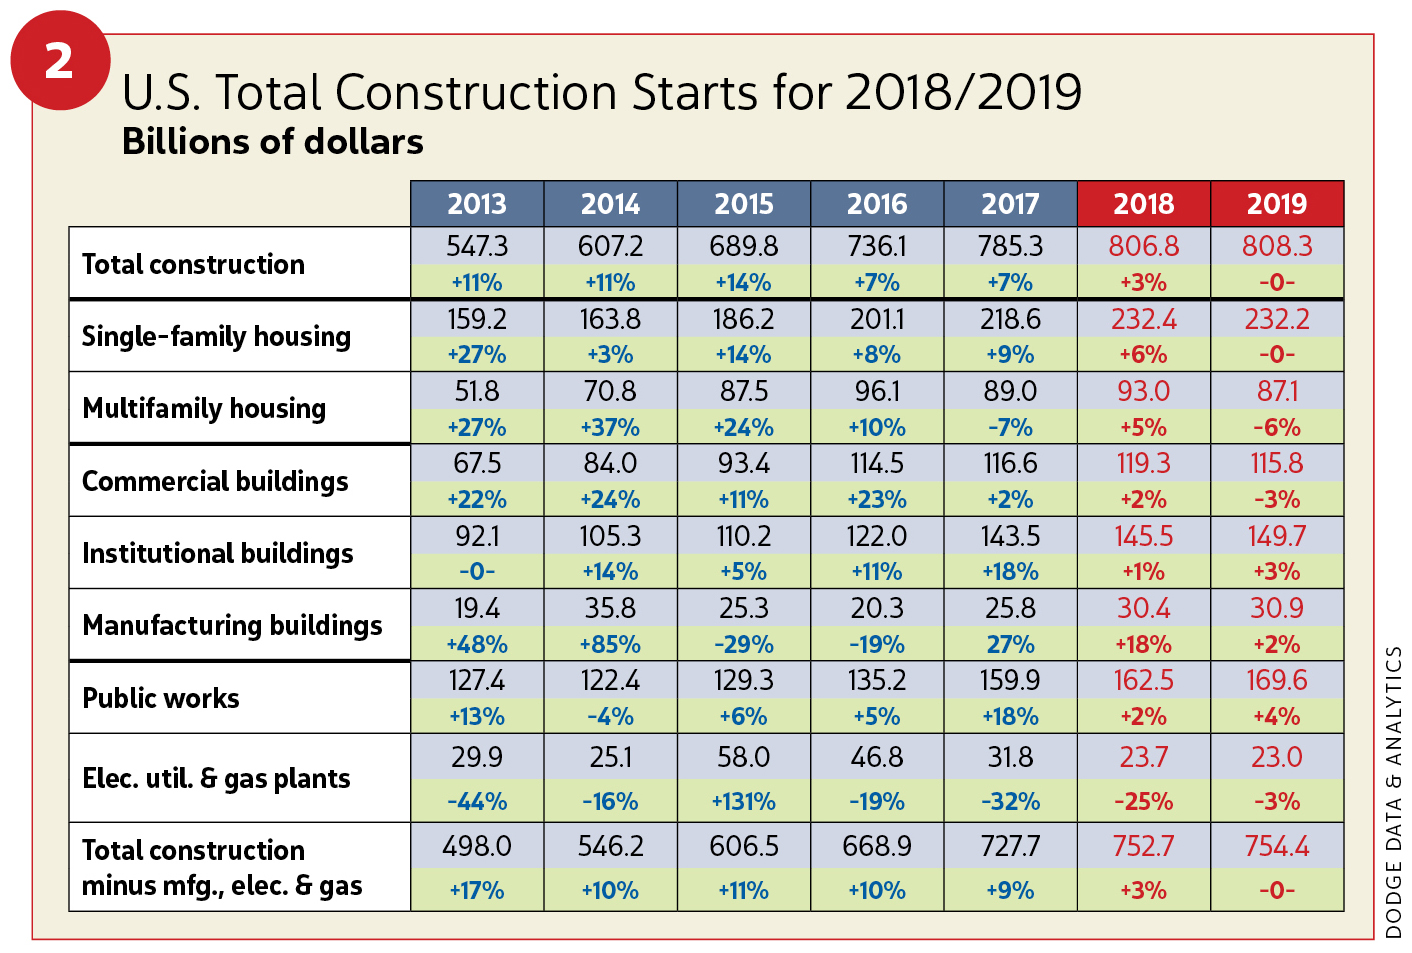
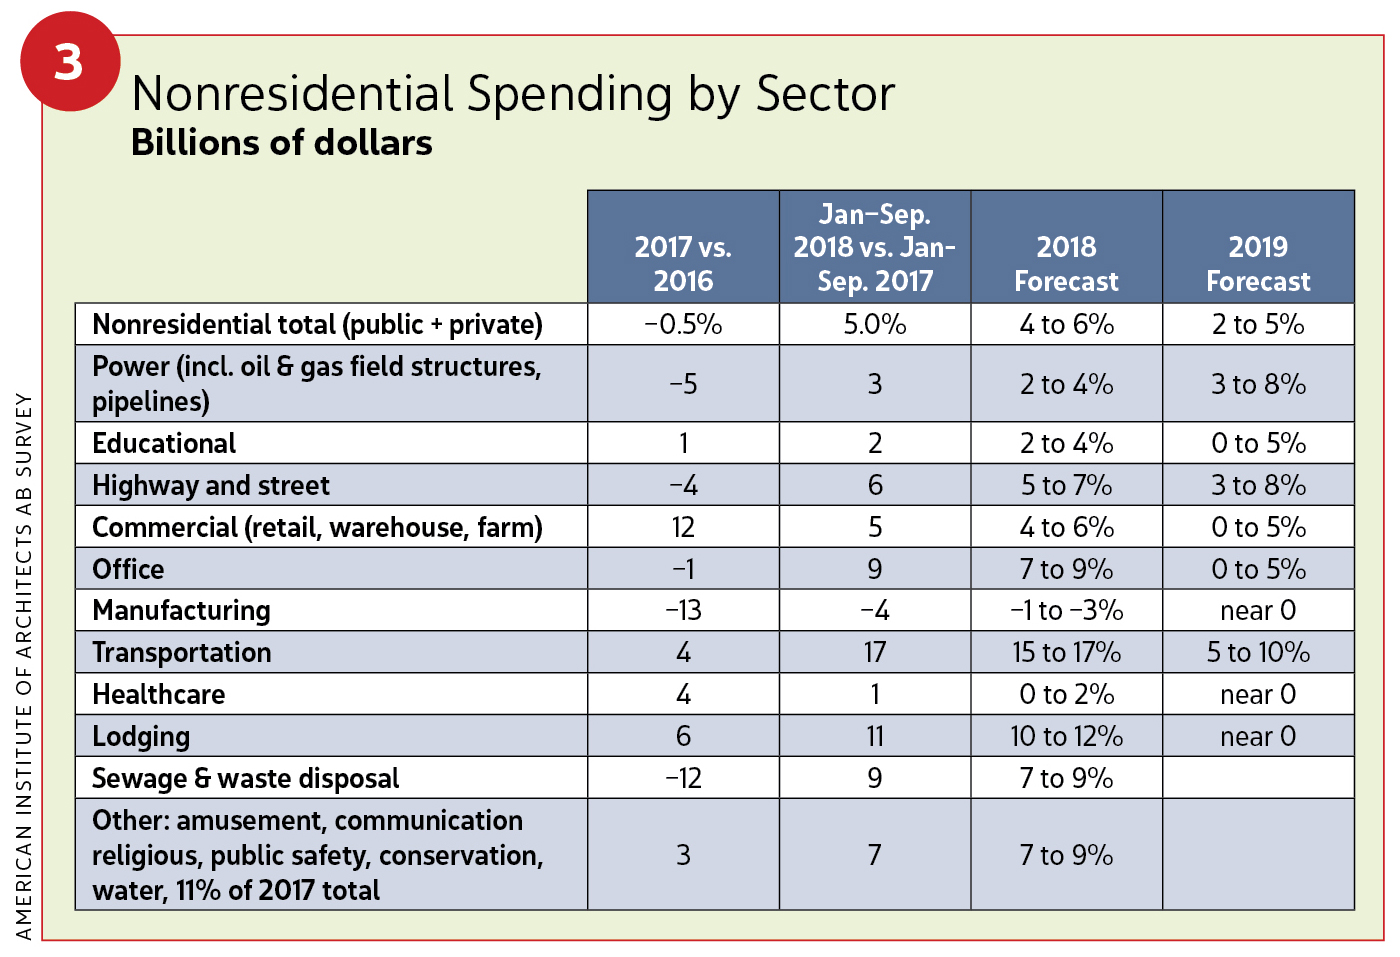
Put-in-place spending grew between 5–9 percent, according to ConstructConnect. Nonresidential construction starts advanced 3 percent thanks to small gains in commercial (2 percent) and institutional (1 percent) and a big gain (18 percent) in manufacturing. Put-in-place dollars grew 3–6 percent. Meanwhile, nonbuilding construction showed a decline (–3 percent) where growth in public works softened; retreating numbers were impacted by negative electric plant/gas plant activity. Put-in-place was estimated between 2–5 percent.
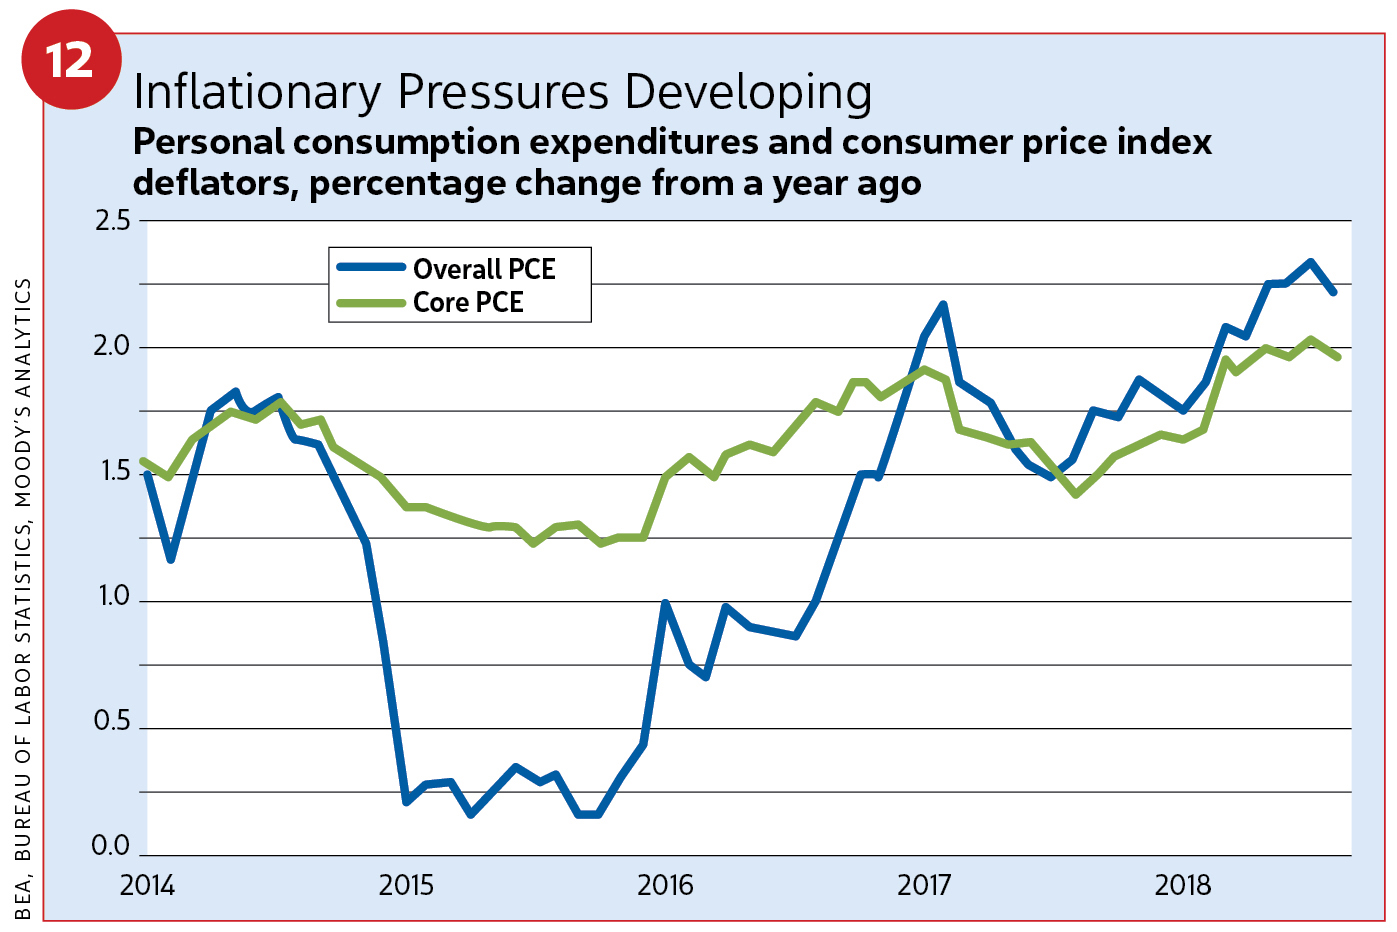
Economists for Dodge, ConstructConnect and others are watching rising interest rates, inflation, higher material costs and a continued shortage of skilled construction workers. They also are monitoring inflation. The U.S. Labor Department reported inflation at 2.5 percent for the 12 months ending October 2018. Rates over 3.0 percent raise concerns.
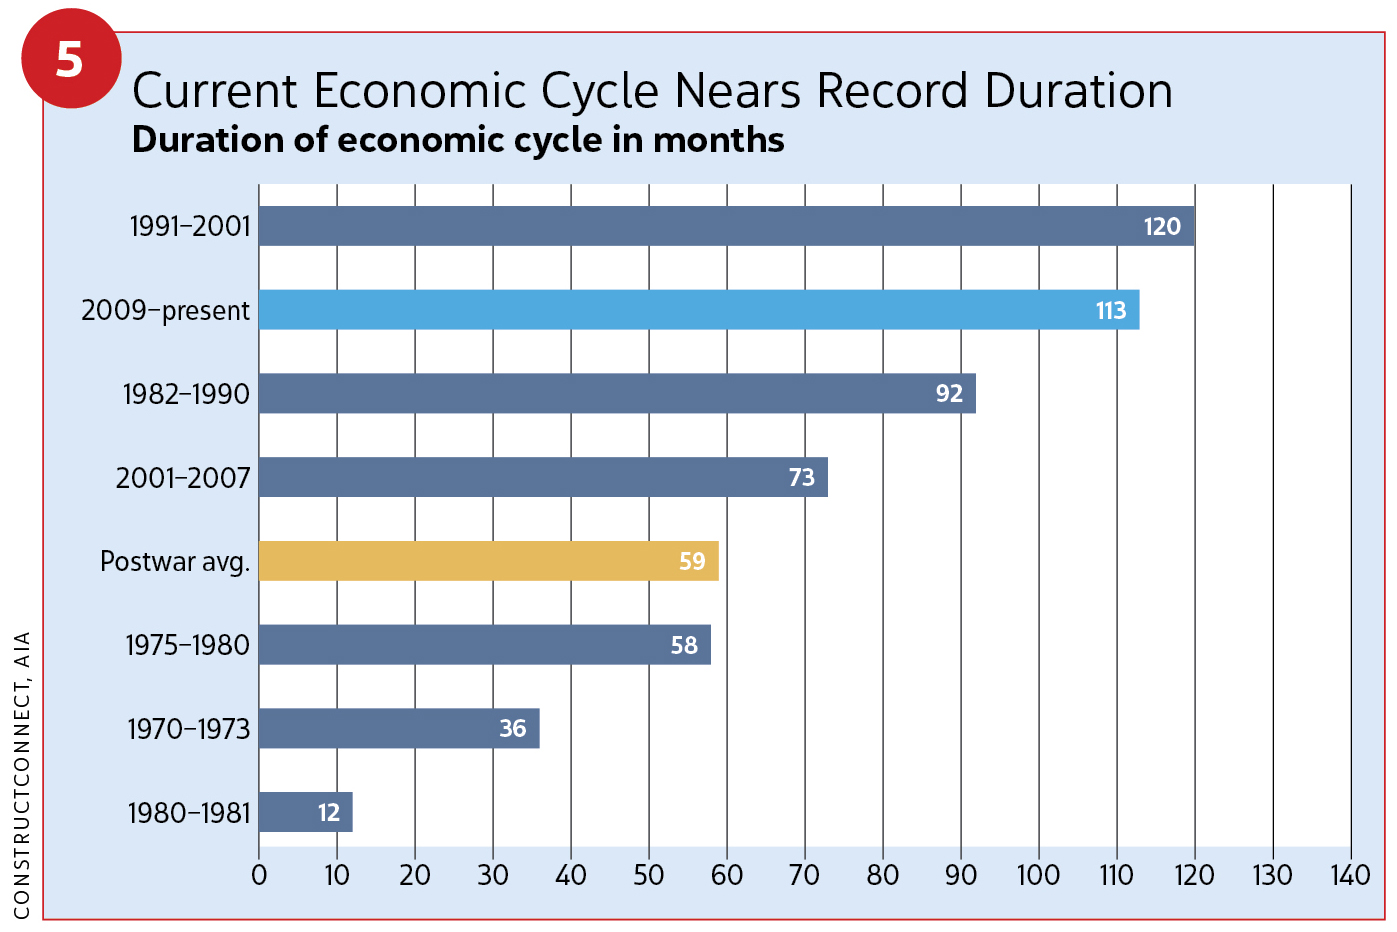
We are approaching 10 years of economic recovery in summer 2019, which would match the largest expansion in post-World War II times (see Figure 5). Gross domestic product (GDP) averaged 3.0 percent in 2018.
“Contractors are equally confident now [2018] and in the year to come based on an AGC [Associated General Contractors of America] survey,” said Ken Simonson, chief economist, AGC of America. Simonson participated in ConstructConnect’s webcast, held on Nov. 15, 2018.
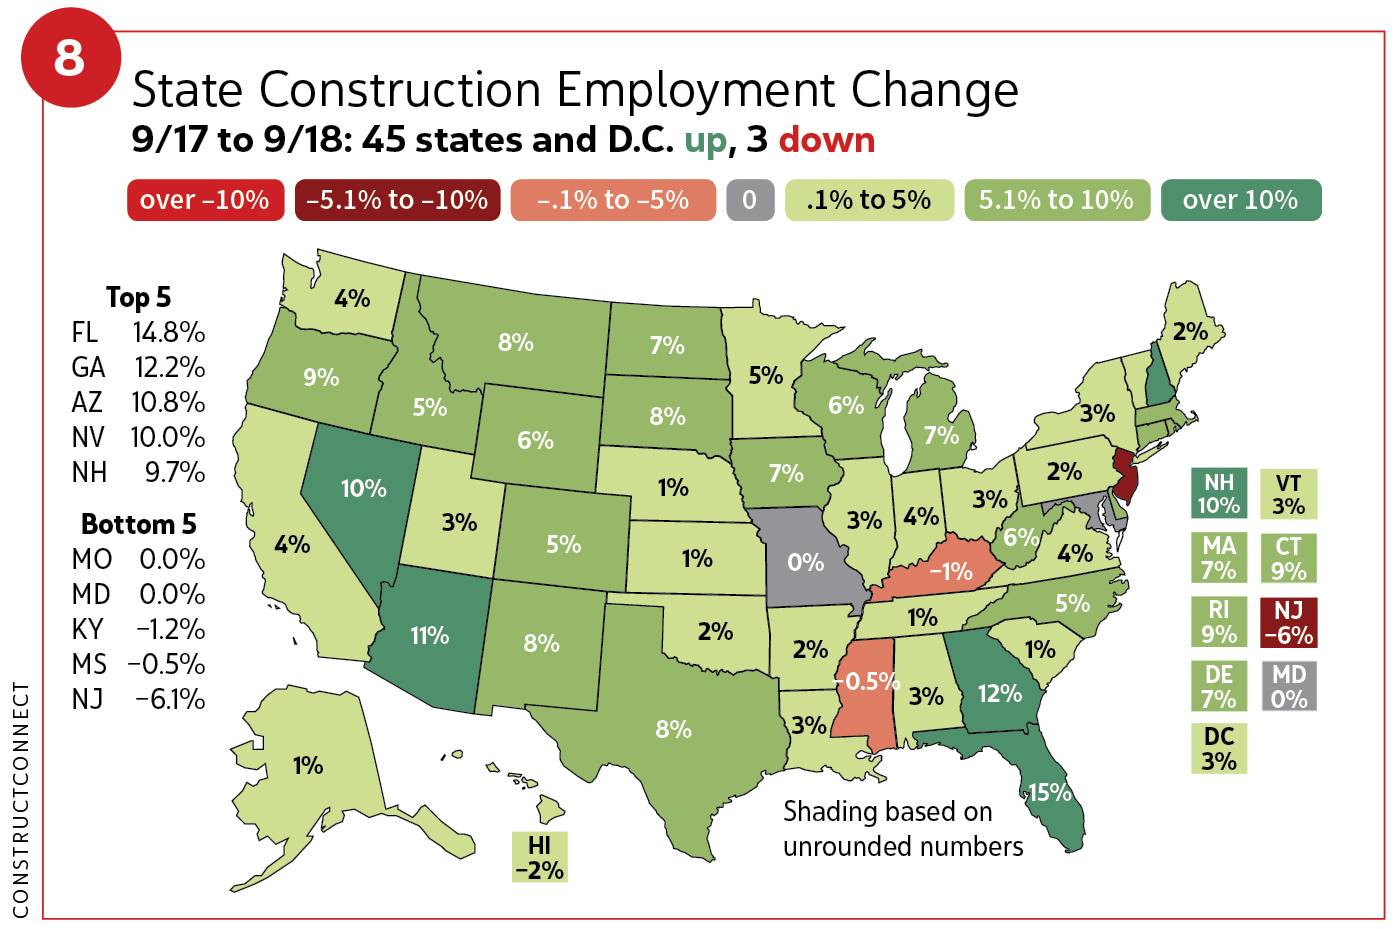
Simonson said construction employment rose by 5 percent from 2017–2018.
“That’s triple the rate of the overall economy,” he said. “The industry is hiring ... but [the workers] may not be the ones they want to hire.”
Unfortunately, a lack of ready-skilled workers remains a challenge.
“Interest rates will keep rising but not sharply,” Simonson said. “They may price out some homebuyers, some developers may pencil out projects, and perhaps bond issuers will scale back some projects. Spending, however, is well above its previous peak, not taking into account inflation.”
Robert Dietz, National Association of Home Builders (NAHB) chief economist, said, aside from the declining affordability of housing, “overall economic conditions remain solid.”
More positives
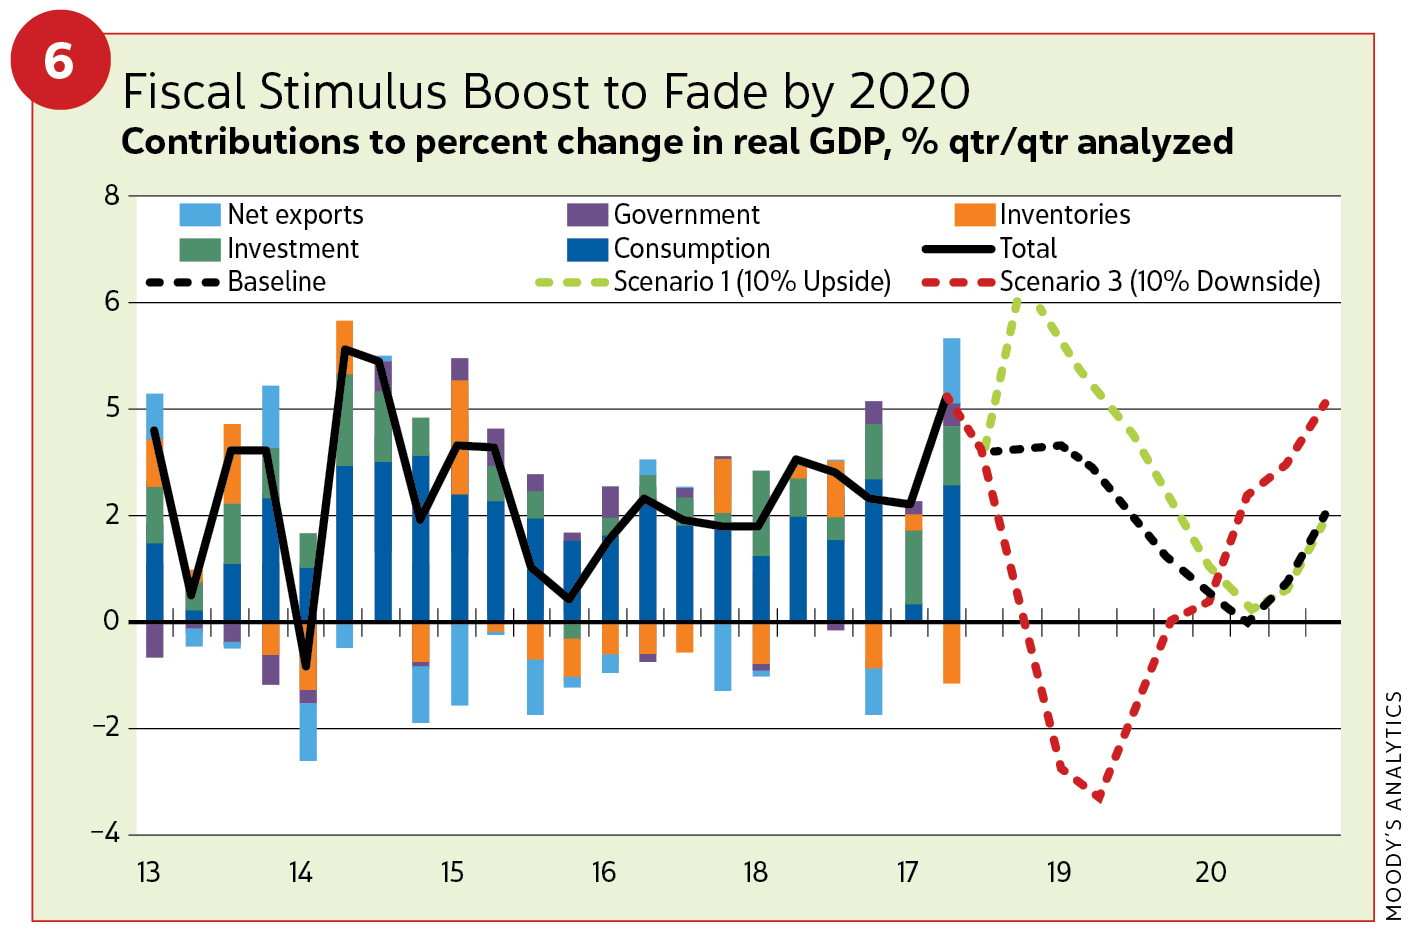
Tax cuts passed in late 2017 helped strengthen business investment and create some jobs; however, economists don’t expect this form of fiscal stimulus to provide prolonged growth (see Figure 6). GDP for 2019 is projected to fall back to 2.5 percent.
At the Dodge forecast, Murray pointed to other bright spots supporting the U.S. expansion carrying over to 2019, including eased bank lending standards for commercial projects and some rollbacks of Dodd-Frank bank restrictions.
“The Congressional 2018 omnibus spending stood at $1.3 trillion, surpassing previous caps,” Murray said. “Within it, $21.2 billion was set aside for infrastructure. Transportation-related construction was a big winner. U.S. Army Corps of Engineers [USACE] activity received an additional $918 million.”
Murray considered the passage of bonds another positive.
“California is seeing some pretty good gains,” he said. “Texas continues to pass bond measures. The year 2017 showed more bonds passed than rejected.”
Trouble reading tea leaves
The question on most attendees’ minds at both the Dodge event and ConstructConnect webcast was whether decelerated growth reflects an imminent recession? At Dodge, Cristian deRitis, senior director, Moody’s Analytics, said he sees a recessionary possibility sometime in 2020. The AGC’s Simonson and Kermit Baker, American Institute of Architects (AIA) chief economist, agreed.
Baker added in the ConstructConnect webcast, “Maybe we see a slowdown [smaller growth] but not a downturn at all.”
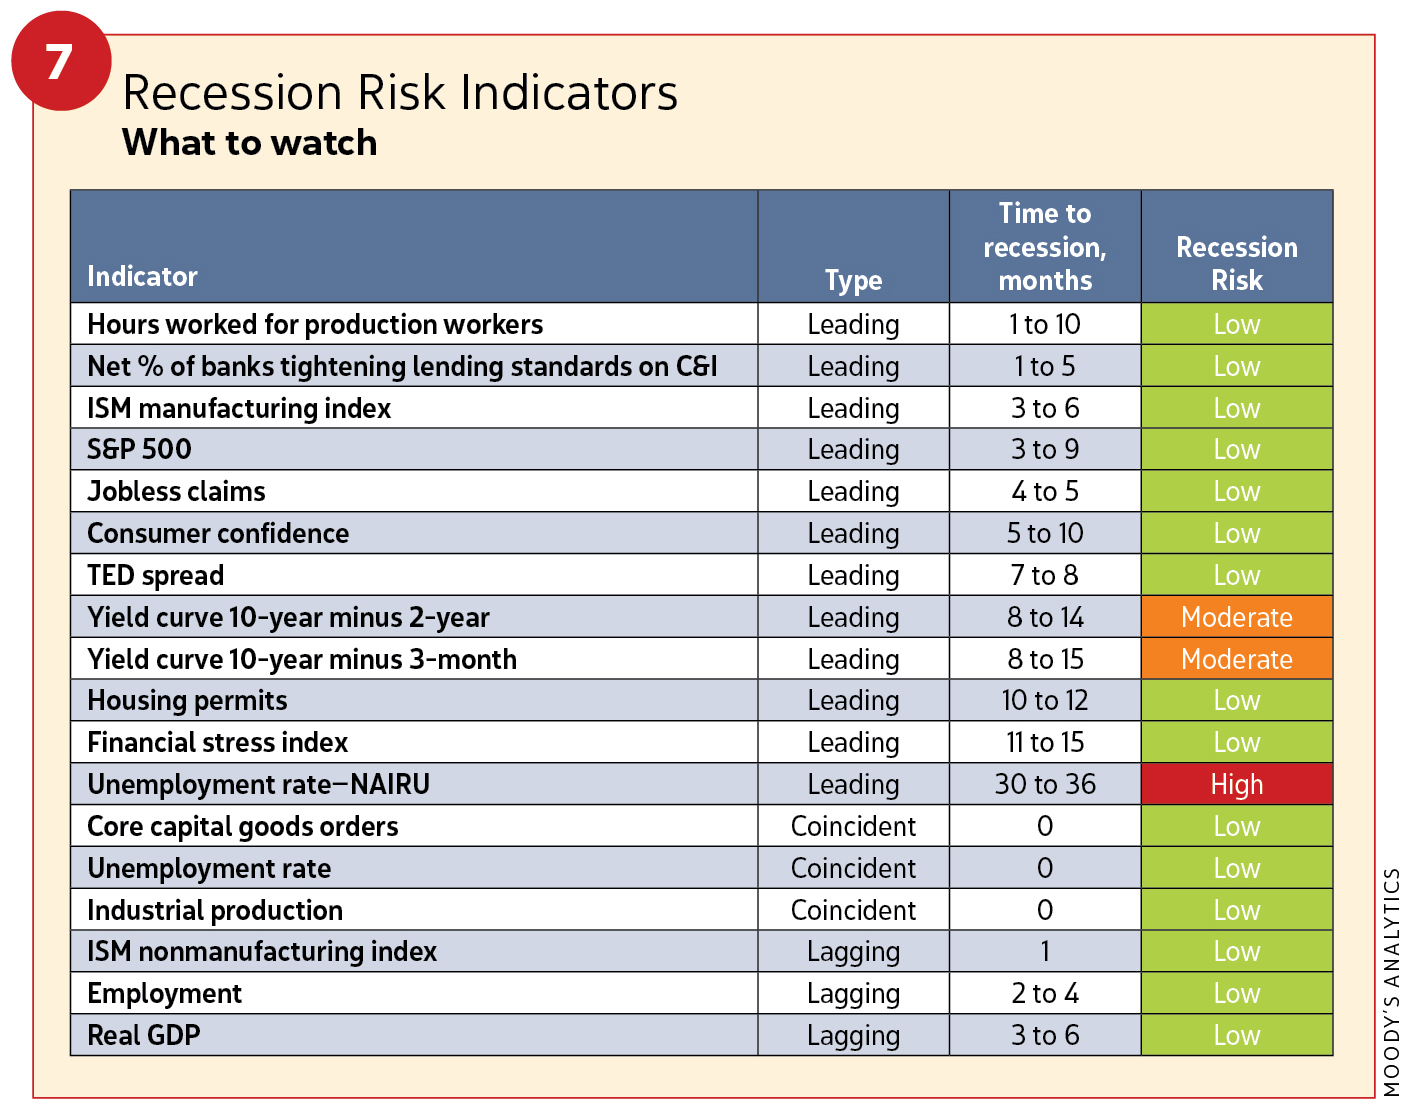
Of note, Christophe Barraud, Paris-based chief economist for Market Securities, pushes a possible U.S. recession into 2021 or beyond (see Figure 7).
Meanwhile, the Dodge Momentum Index bounced around in 2018. The index is a monthly measure for nonresidential building projects in planning, and it has shown to lead construction spending of this sector by a full year. The index retreated in August and September, 164.1 (2,000=100) to 150.5. That turned around in October as robust construction activity raised the index to 179, second only to June’s 192 figure. Through the first 10 months of 2018, total construction starts were up 1 percent from the same period in 2017.
“During 2018, the presence of very large projects in a given month has played a considerable role in shaping the monthly pattern of activity,” Murray said. “In October 2018, nonresidential starts climbed 53 percent, contributing to a 21-percent boost in overall construction.”
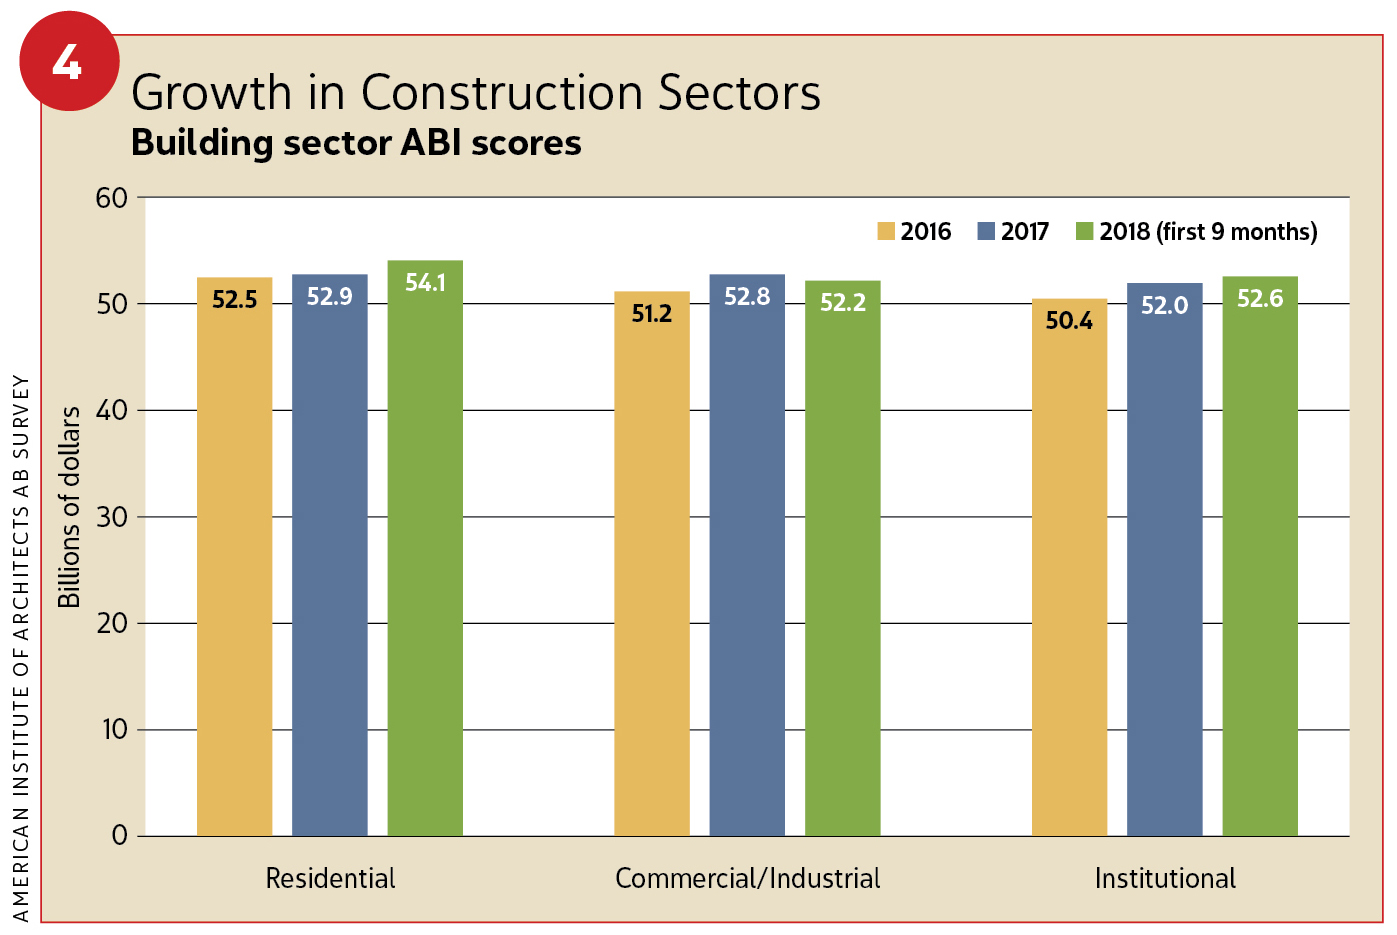
Meanwhile, the AIA’s Architecture Billing Index (a measure of activity in architecture firms), while also fluid, held on at 150 or above, signifying growth in 2018.
“The first three quarters of 2018 were just as strong as the numbers in 2017,” Baker said. “Multifamily has seemed very healthy in the housing sector, even accelerating in the first three quarters of 2018. Commercial [and] industrial showed stable growth. We expect growth from both in 2019.”
Baker added spending on rehabilitation, remodeling, additions and historic renovations has stayed strong since the recession, a noteworthy contributor to overall construction health.
When the inevitable downturn does develop, deRitis said a housing bubble will not be the culprit, meaning recessionary effects on the construction industry likely will be less severe than in 2008. He characterized 2019 as a “good but risky time.”
Employment has been a big positive.
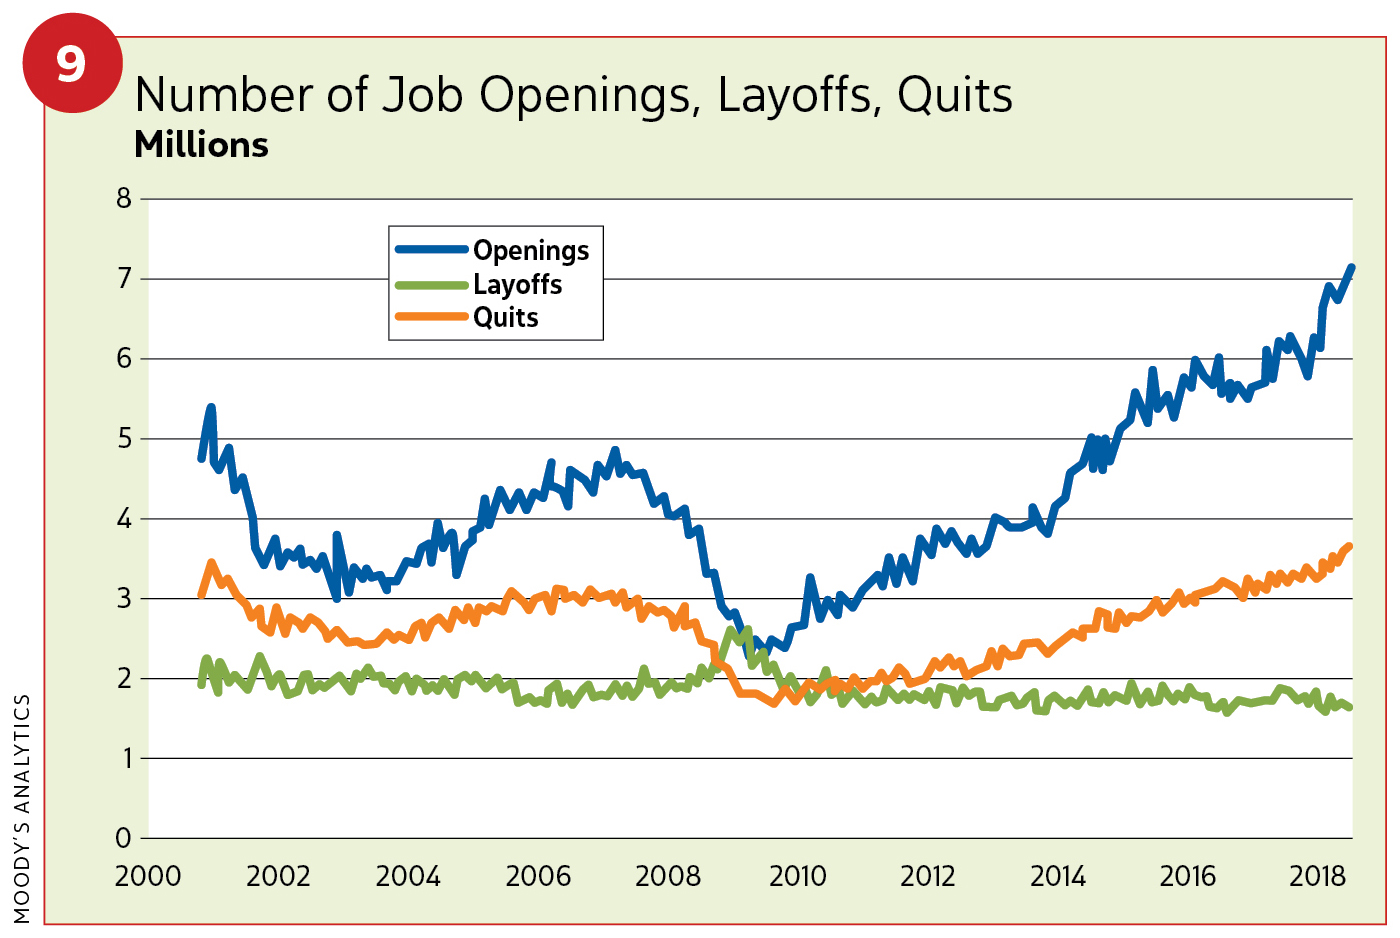
“We’re seeing 200,000 jobs drawing people into the economy each month,” deRitis said. “In fact, there are more job openings than candidates to fill them. We are at the lowest unemployment rate in 50 years [3.7 percent/Oct. 25, 2018].”
The unemployment rate remained un-changed in November 2018.
Since October, job growth has slowed, but workers are feeling confident nonetheless. Wage growth, however, remains stubborn.
“It is at 2.8 percent right now,” he said. “In 2000, with 3.9 percent unemployment, we saw wage growth rising 4 to 4.5 percent.” Meanwhile, job openings, layoffs and quits totals show a healthy economy (see Figures 8 and 9).
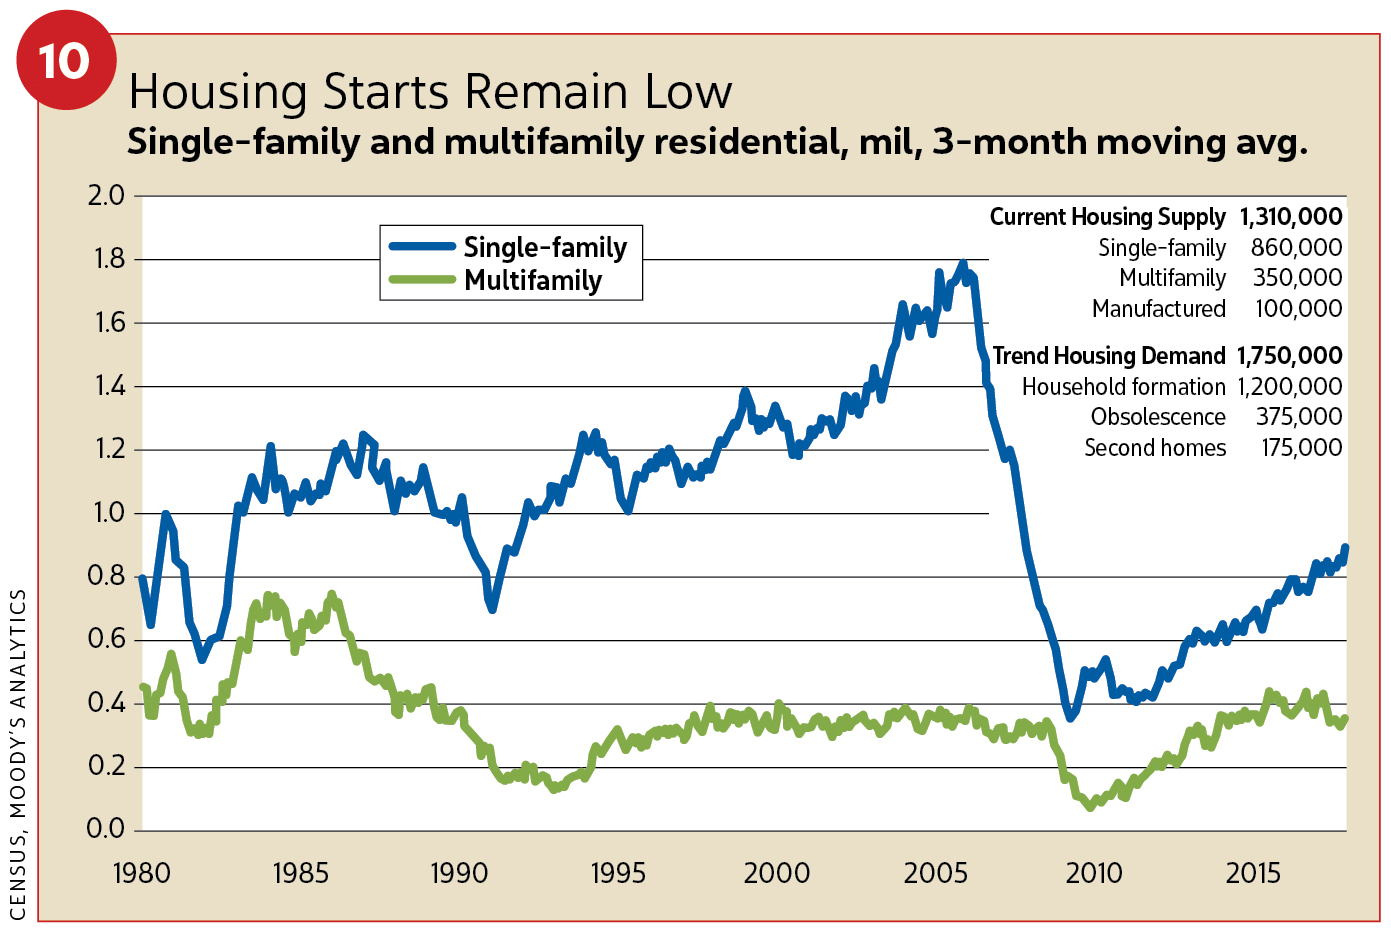
For deRitis, the risks in our economy are creating uncertainty, such as the housing market being short 400,000 units.
“Housing starts remain low,” he said. “Housing contributes 5 percent to GDP growth. Every single-family start adds three full-time jobs. So, [low starts are] a concern. Multifamily may not be at the levels we want, but it is holding its own. Meanwhile, household formations are not rising based on expectation, and there is not enough housing in the market.” (see Figure 10).
DeRitis also found the all-time low of infrastructure spending as percentage of GDP a “real risk” and drag on the economy. He pointed to a growing trade war with China.
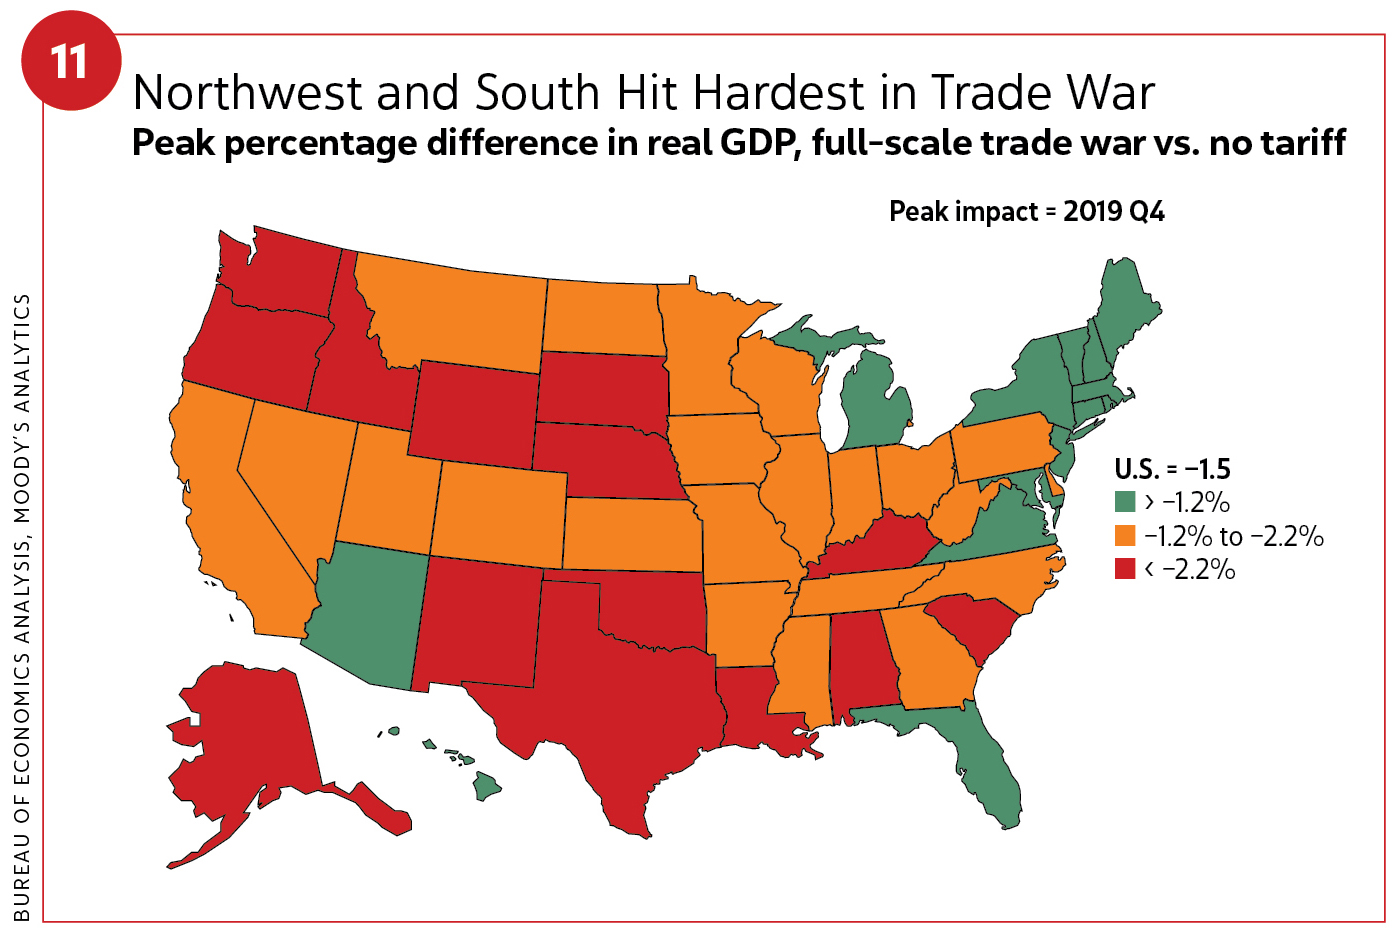
“The first round of tariffs [25 percent of $34 billion of Chinese goods] had a negligible effect,” he said. “The second round [$200 billion of goods] will affect more consumer goods but won’t push us into recession. A full-scale trade war at $500 billion would hurt us and maybe push a recession. Supply chains would be affected, and that impacts the economy and growth with a tax on key inputs for companies. A preview was the washing machine tariff and prices jumping 25 percent. The Northwest and South would be hit hardest in a trade war” (see Figure 11).
Alex Carrick, chief economist for ConstructConnect, added a few more possible headwinds. He called them “shadows at the edge.”
“The rising interest rates also impact auto sales,” he said. “I also wouldn’t discount inflation. Prices are coming up. And while the U.S. economy is strong, the rest of the world is behaving much more sluggishly. The deficit wall may hurt prospects of a middle class tax cut. Finally, President Trump is likely to be at loggerheads with the chairman of the Fed [Jerome Powell]. Trump doesn’t want interest rates to jump up.”
DeRitis also weighed in on interest rates.
“We expect to see inflationary pressure in 2019, though the investor market may not believe this forecast,” he said (see Figure 12). “If we overheat with prices and inflation, we hike interest rates to control them. The Fed may need to be more aggressive than they think. We may also risk an inverted yield curve—a bad deal for the economy. Average length [between] an inversion when it appears and a recession is 12 months.”
An inverted yield curve is an interest rate environment in which long-term debt instruments have a lower yield than short-term of the same credit quality.
The Fed hiked rates in December 2018. Two or more hikes are likely in 2019, which could get interest rates to 3.5 percent or greater, Murray projected. He and others also cited the federal deficit as a point for concern, increasing 17 percent to $779 billion in 2018 and projected by the Congressional Budget Office to climb to $973 billion for 2019.
In positive gains, Kiplinger forecast 10-year Treasury notes to edge up to 3.2 percent by year-end 2018 (a 3.1 percent yield) and achieve 3.6 percent by the end of 2019.
“There’s a funny contradiction going on,” Murray said. “The recent stock market behavior is a warning sign that the good times don’t last forever. So does construction-industry-growth deceleration signify decline? Ask construction contractors, and they cite the highest levels of backlogs and remain optimistic about the construction market. There is some anxiety, but the fundamentals remain sound.”
Sector Performance and Forecasts for 2019
These are based on Dodge Analytics and Data and ConstructConnect estimates unless otherwise stated.
RESIDENTIAL—Still an economic driver
Eight years of recovery for the housing market has shown starts growing 127 percent (2009–2017). Multifamily has led, increasing 281 percent from 2009–2016. Single-family starts rose 94 percent from 2011–2017. In 2018, total housing starts reached an estimated 1.350 million units, a 4-percent increase. (The NAHB figure is 1.263 million.) A maturing economy and rising interest rates will add pressure this year. A 5-percent decline to 1.280 million units in total housing starts is projected for 2019. The NAHB’s estimates are similar at 1.283 million.
Single-family
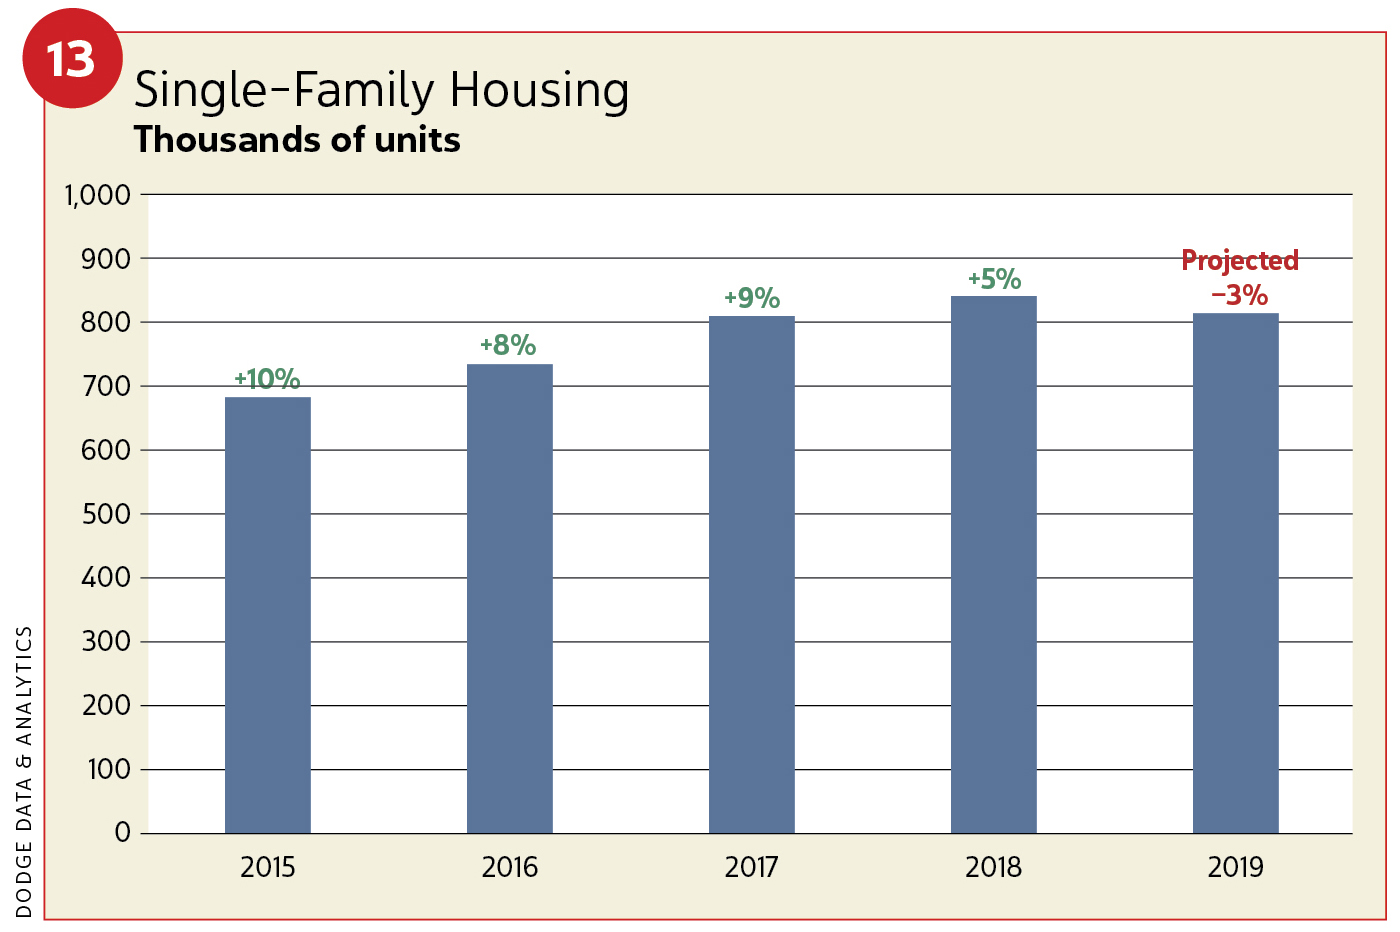
By and large, the single-family housing sector did well in 2018, gaining 5 percent in units and 6 percent in dollars ($232.4 billion). The NAHB placed total single-family housing starts at 884,000 units. Put-in-place spending grew between 6–8 percent. Dodge and others, however, see “signs of aging.” This year’s forecast projects lesser growth at 3 percent with flat dollar gains ($232.2 billion). The NAHB projects 917,000 units. Put-in-place spending is expected to climb 6–10 percent. Fixed-rate mortgages in 2018 topped out at 4.60 percent. The NAHB forecasts 5.21 percent for 2019 (see Figure 13).
Simonson included put-in-place figures for remodeling and improvements. In 2018, this spending grew 6–8 percent. In 2019, expect advancements between 5–10 percent.
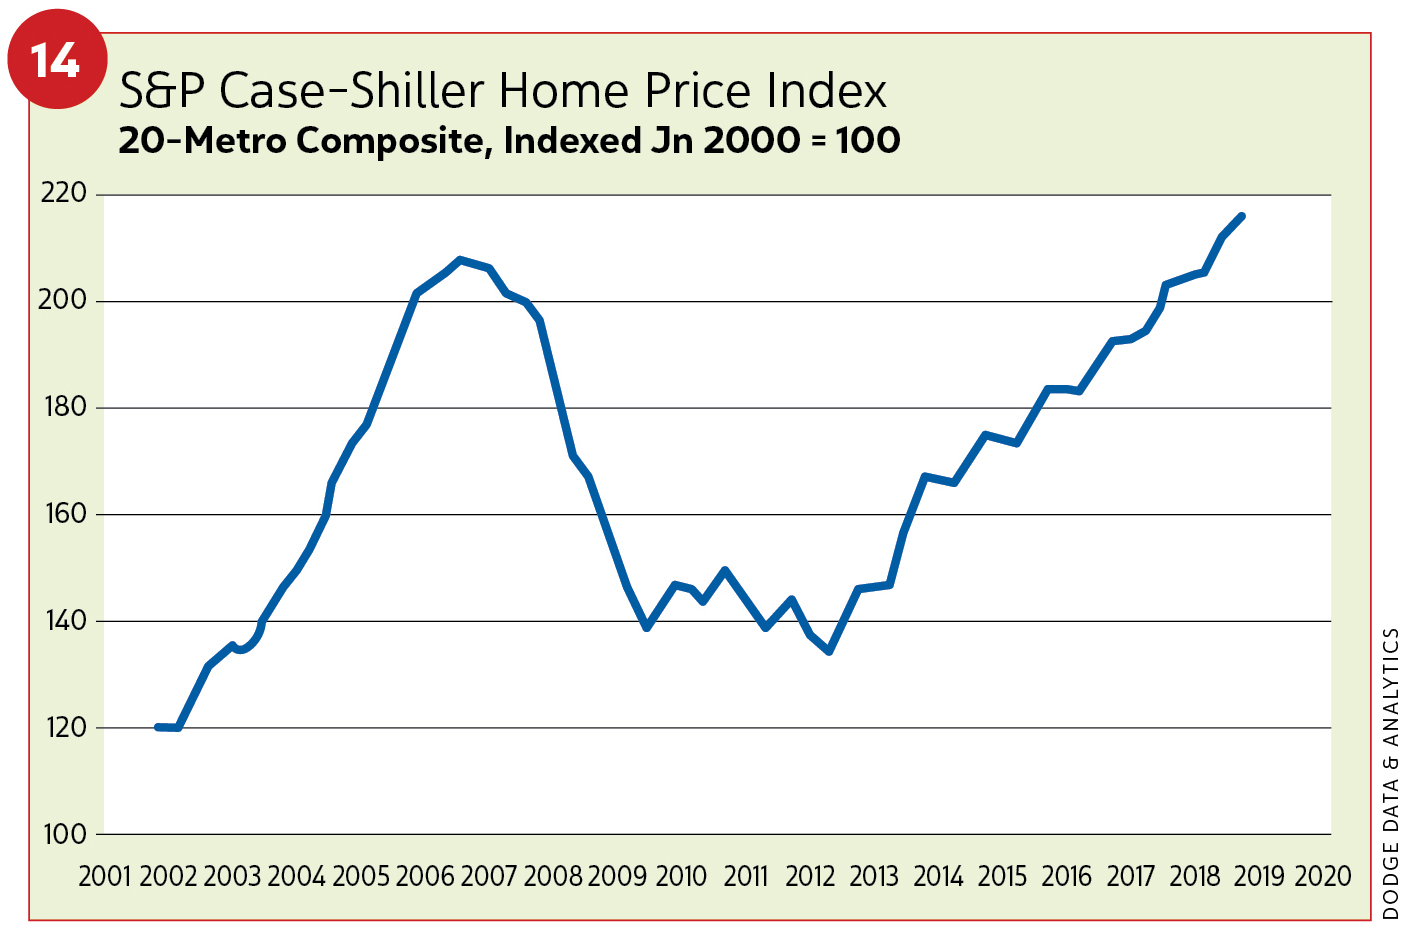
Housing affordability is creating its own drag on the single-family market. Dodge considers it a No. 1 issue. From February 2007 to February 2012, the S&P Corelogic Case-Shiller Home Price Index revealed home prices dropped 26 percent. That helped deliver a buyer-friendly market.
Home prices then rose 49 percent through July 2018. The rise was most acute in 2013 (9.6 percent), slowed in 2015 (4.6 percent), accelerated in 2016 (5.6 percent), again in 2017 (5.8 percent), and more in the first half of 2018 (6.3 percent). Home prices continue to rise up 6–7 percent year over year (see Figure 14).
“I think income growth will help us get out of this period,” NAHB's Dietz said. “We’re probably looking at a period where existing home sales volume is flat to declining.”
Multifamily
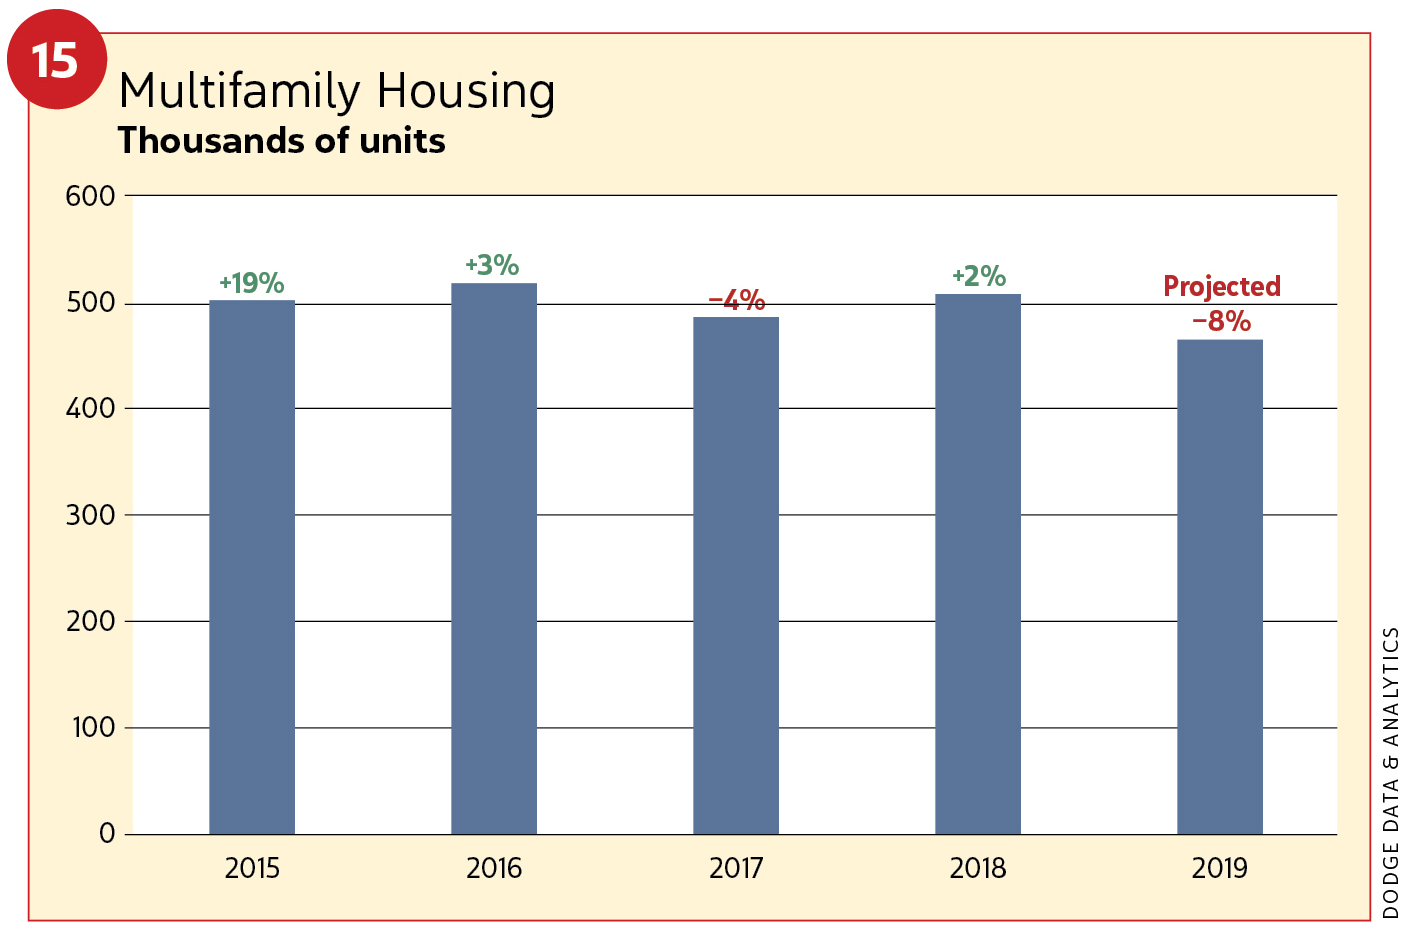
While multifamily is a maturing market, it has been pretty stable (see Figure 15). In 2016, starts slowed to 3 percent but still represented a market up 282 percent from the depth of the recession. Growth matured as gains fell to 4 percent in 2017 (497,000 units). In 2018, starts surprised observers and grew by 2 percent (508,000 units), and dollar value rose 5 percent ($93 billion). Put-in-place spending was flat. The NAHB found 2018 multifamily starts at 380,000 units. This year, anticipate an 8-percent drop in starts (465,000 units) and a dollar value decline of 6 percent ($87.1 billion). Spending gains are projected between 2–5 percent. The NAHB projects lesser starts of 366,000 units.
Household formation among millennials, while improving, is not happening at the pace of past generations. This age group of 18–38 year olds remains primarily renters or still live with their parents. As a consequence, the last eight years of the rental market has remained strong with tightening vacancies but escalating rental rates. This may be starting to change.
Growth of multifamily construction during the economic expansion has largely been driven by large projects. In the first nine months of last year, 74 projects ($100 million or more) broke ground, adding $13.2 billion. Unit totals of 32,752 were 10 percent of the total market. New York City and its outlying metro area represent the largest placement of big apartment complexes. In 2018, New York City topped the starts list again ($12.8 billion) followed by Washington, D.C. ($3.5 billion); Miami ($3.5 billion); and Boston ($3.1 billion). Dollar value for seven of the top 10 multifamily markets grew by double digits in 2018. Los Angeles, Chicago and Atlanta showed declines.
Despite an expected multifamily softening in 2019, Dodge feels this sector may still drive overall construction activity in the decade ahead. It points to demand keeping pace with supply supported by more young adults, the continued popularity of downtown living and reasonable vacancy rates.
COMMERCIAL—Gains for a shrinking player
The up-and-down ride for commercial construction may be peaking. Starts for 2018 saw a 1-percent decline, or 761,000 million square feet (msf) from 2017 but earned a 2 percent dollar gain ($119.3 billion). Spending rose 4–6 percent. In 2019, some weakening is forecast with declines of 7 percent (704 msf) and an erosion of 3 percent in dollars ($115.8 million). Put-in-place spending will register gains of 5 percent or less. Dodge expects square-footage declines in every sector of commercial building in 2019 but characterizes them as “moderate” supported by reasonably healthy market fundamentals and some easing of bank lending.
Stores and shopping centers
The words “recovery” and “store construction” haven’t generally fit together for eight years, though 2010–2017 did see stores advance 58 percent in dollar value. Even with a strong economy and hearty consumer spending, new store construction has disappointed. In 2018, starts declined 13 percent in square footage (84 msf) and 9 percent dollar value ($18.3 billion). This year, stores and shopping centers construction is expected to decline 5 percent in square footage (80 msf) and 1 percent in dollar value ($18.1 billion).
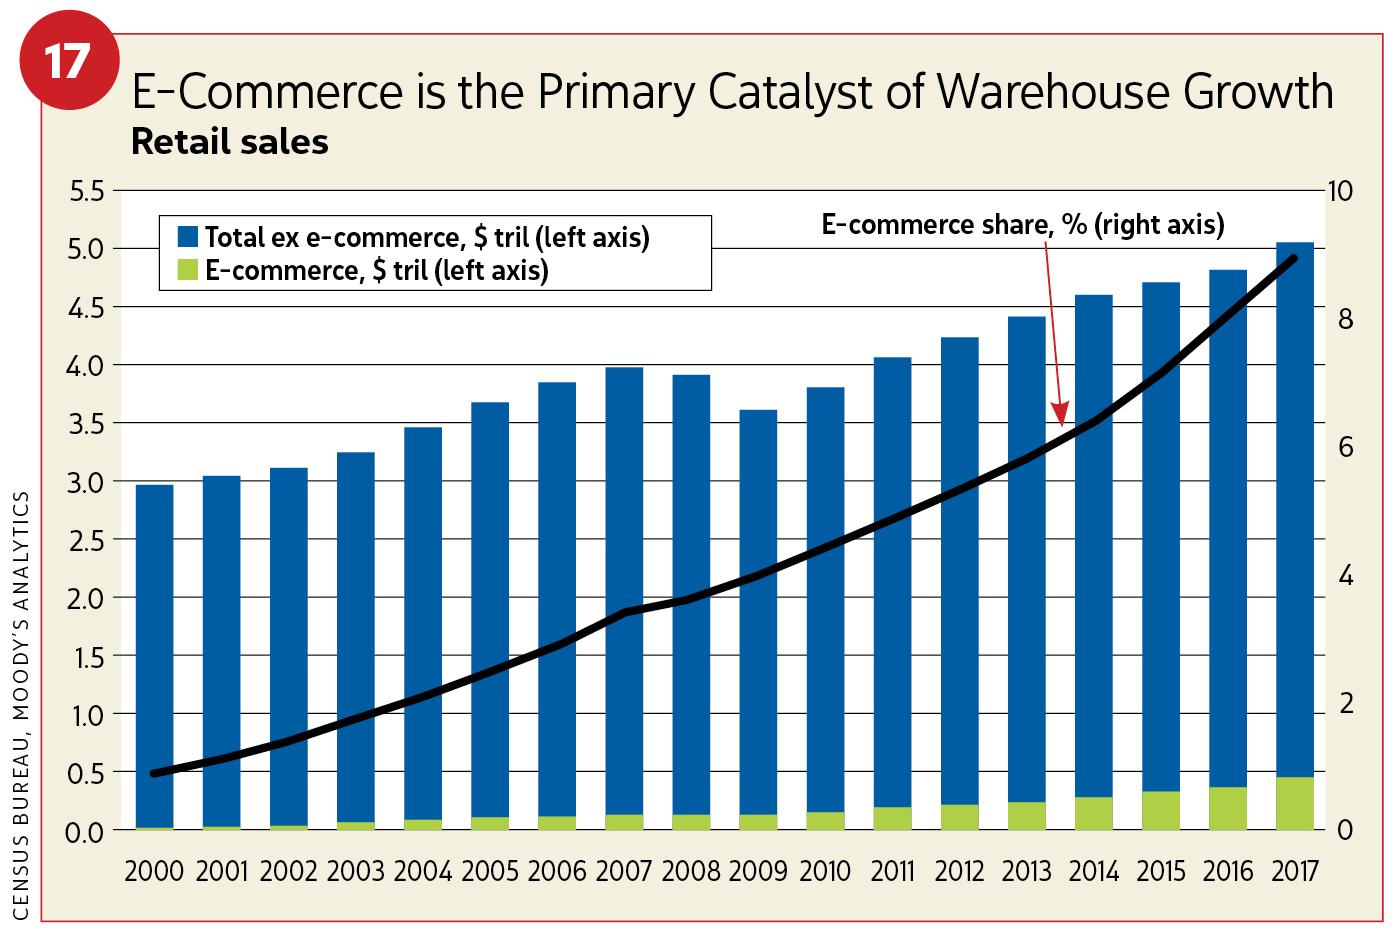
The structural shift of online shopping continues to grow as store construction weakens. The U.S. Commerce Department reported second-quarter 2018 e-commerce growth at 15.2 percent ($127.3 billion) year-over-year. In comparison, total retail sales grew 5.7 percent over the same period. New capital investment also is focused on e-commerce. Notably, however, online shopping still represents only 9.6 percent of total retail sales.
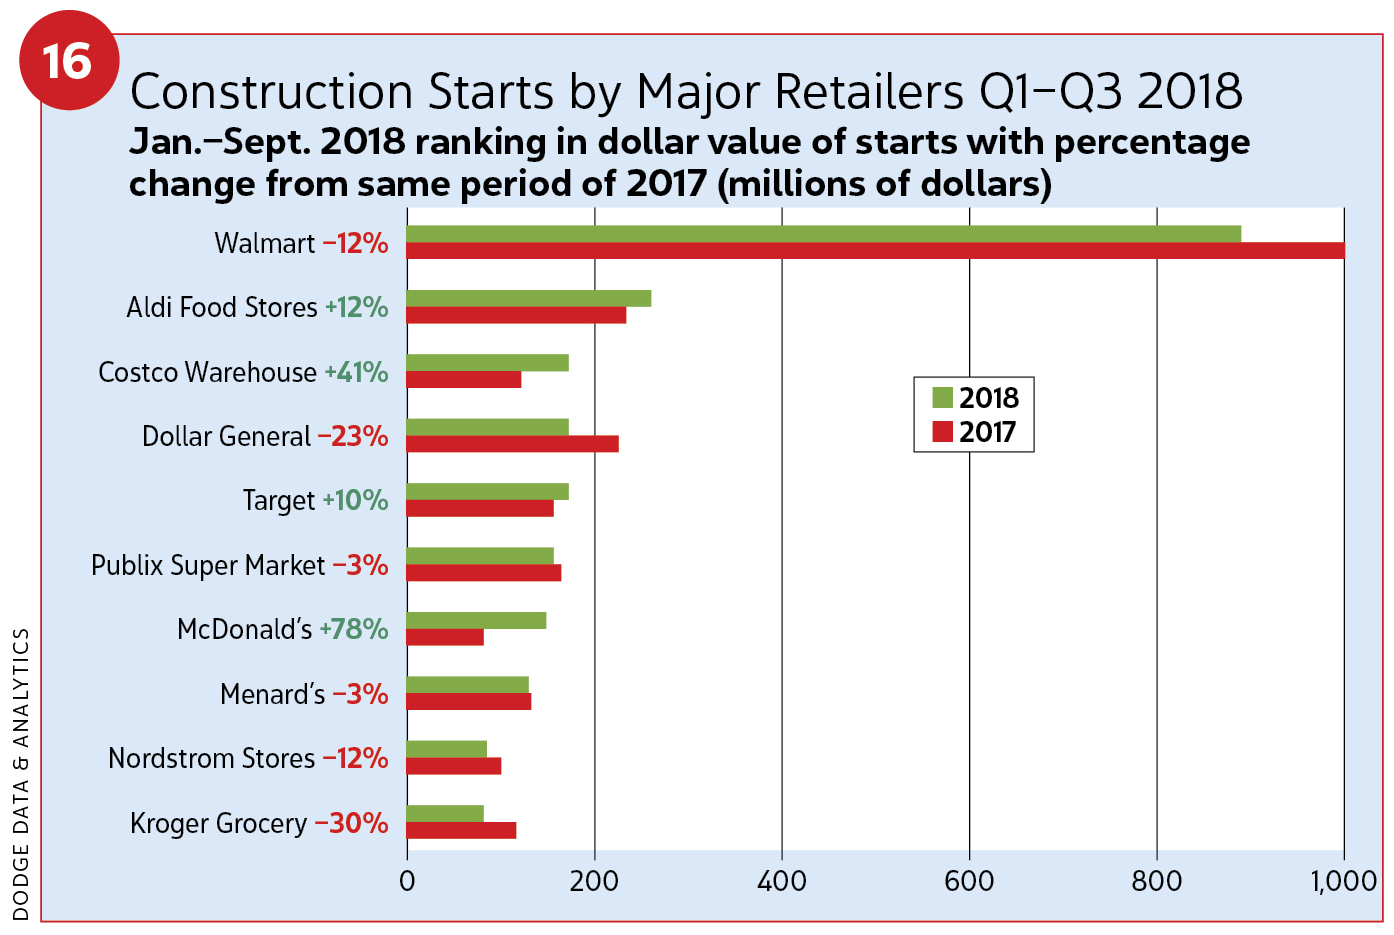
Walmart led in new store openings. In the first nine months of 2018, it spent $866 million on new construction projects, although that was a 12-percent construction drop from 2017 (see Figure 16). Big projects for 2018 also included the Bal Harbour Shops expansion ($258 million); and a renovation for retail in a vacant Dayton’s department store ($75 million) in Minneapolis, part of a mixed-use project ($150 million). Mixed-use may be a space where retail finds some traction. Renovating existing spaces has been popular for retail in recent years.
Commercial warehouses
In 2010, warehouse starts represented 49 msf. By the end of 2017, starts had grown 500 percent thanks largely to e-commerce (see Figure 17). After seven years, this sector appears to be maturing. In 2018, warehouse starts increased 2 percent in square footage and dollars (299 msf, $23.8 billion). This year, warehouse construction is expected to pull back 11 percent in square footage (265 msf) and 8 percent in dollar value ($21.9 billion). Vacancy rate declines show demand is still outpacing supply. CBRE Econometric Advisors (CBRE-EA) found third-quarter 2018 vacancy rates standing at 7.1 percent.
Amazon ruled the day, owning the top three warehouse-construction projects in 2018. Those projects included the “Project Rose” Fulfillment Center (2.6 msf) in Spokane, Wash.; “Project Dylan” warehouse (2.4 msf) in Tulsa, Okla.; and a warehouse (2.3 msf) in Bessemer, Ala. Today’s design imperatives are demanding larger, technologically sophisticated spaces.
Offices and data centers
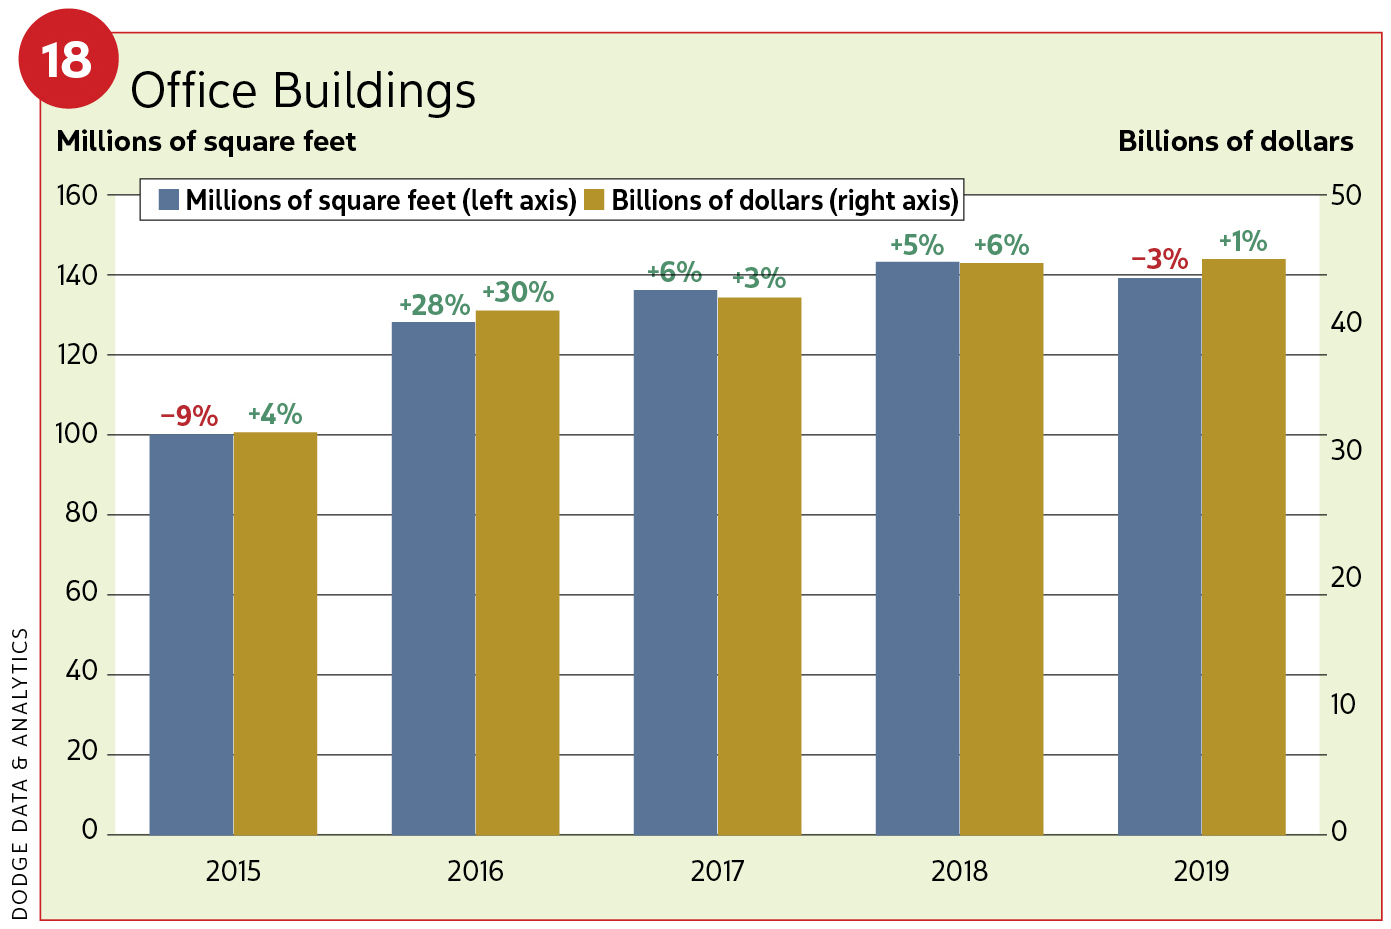
In 2018, office starts increased 5 percent in square footage (143 msf) and 6 percent in dollar value ($44.6 billion). Put-in-place spending rose between 7–9 percent. In 2019, gains may pull back 3 percent (139 msf) but increase in dollar value by 1 percent ($44.9 billion). Gains in spending will top out at 5 percent.
Several noteworthy projects broke ground in 2018. They included the 64-story Tishman-Speyer Spiral Tower ($1.8 billion) in New York City’s Hudson Yard; two Facebook data centers in Papillion, Neb., and Huntsville, Ala. ($1.0 billion and $750 million, respectively) three Google data centers (in Clarksville, Tenn., Stevenson, Ala.; and Pryor Okla.) and the North Wacker office tower ($659 million) in Chicago.
In 2017, of the 52 office projects valued at $100 million or more, 10 were data centers ($3.4 billion, 5.8 msf). Last year, of the 34 projects valued at the same threshold, 14 were data centers ($5.8 billion, 8.6 msf). Facebook data center starts in 2018 were dominant in Dallas/Fort Worth; Huntsville, Ala.; and Columbus, Ohio. Atlanta and Austin, Texas, also saw major data center projects.
According to CBRE-EA, U.S. office vacancy rates fell by 10 basis points to 12.8 percent during the third quarter of 2018. This marked the fourth consecutive quarter of a 10-point drop. Downtown rates stayed flat at 10.5 percent. Suburban rates fell 10 points to 14.1 percent. Office renovations have also remained very strong (see Figure 18).
In overall office construction, New York City led in 2018 with $5.8 billion in projects, most notably the Spiral office tower. It was followed by Washington, D.C. ($2.5 billion), Chicago, Boston and Omaha, Neb.
Hotels
Hotels have seen healthy growth. Between 2011–2016, starts rose 344 percent, or 75 msf. Growth retreated 2 percent in 2017 but progressed in 2018 by 4 percent in square footage (77 msf) and 10 percent in dollar value ($18.5 billion). Put-in-place advanced a strong 10–12 percent. This year, hotel construction will slip 8 percent in square footage (71 msf) and 6 percent in dollar value ($17.4 billion). Spending advances will be near zero.
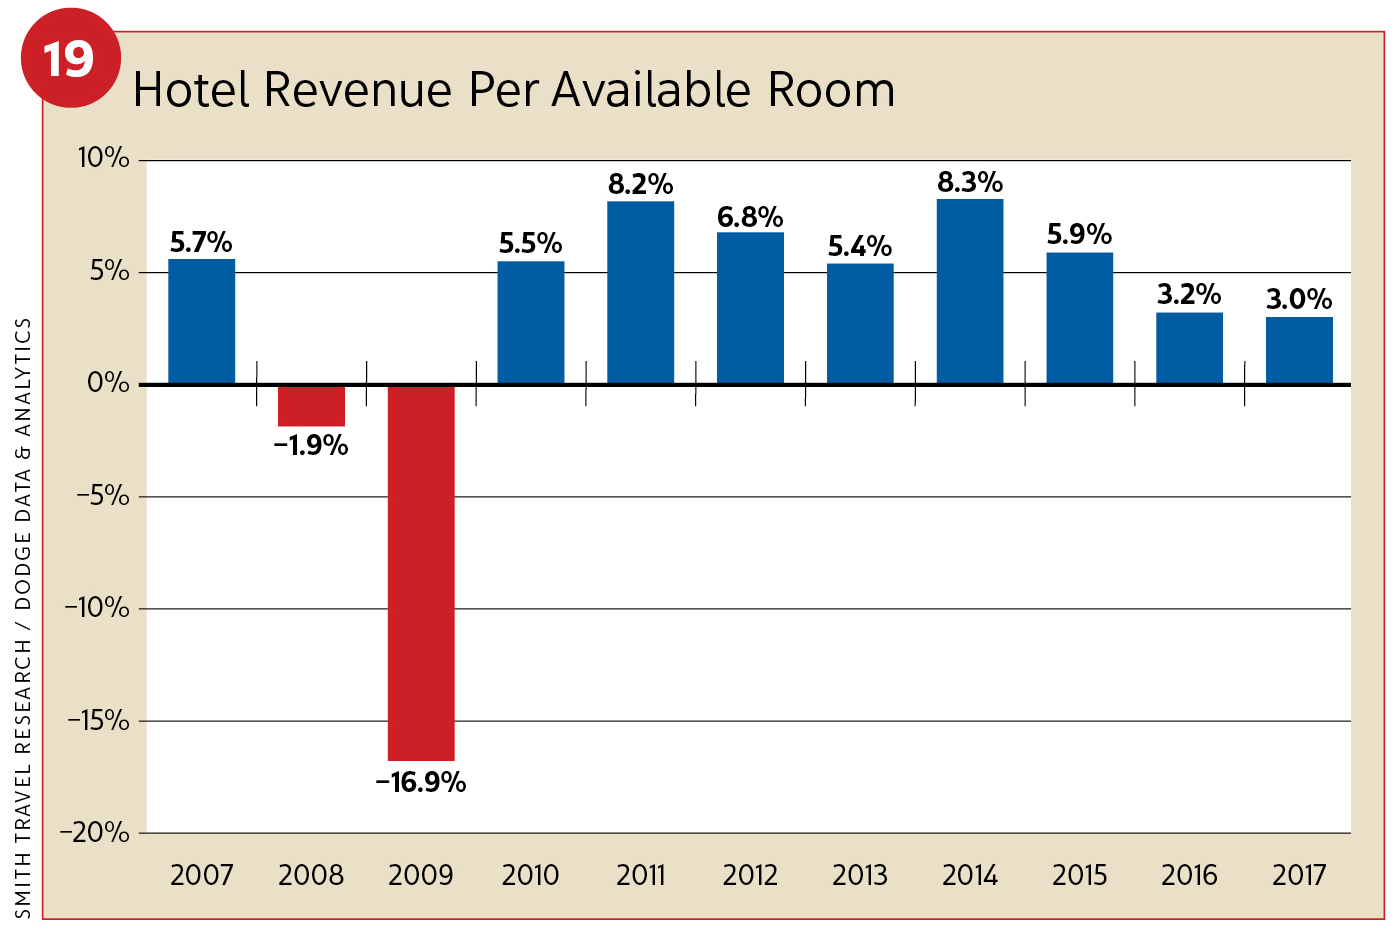
Now that 37 of 50 states offer legalized gambling, casino growth has fed hotel construction. Strong leisure and business travel has also strengthened this sector; business travel can help support convention center projects. Meanwhile, revenue per available room (RevPAR) rose 4.2 percent in the fourth quarter of 2017, another 3.5 percent in the first quarter of 2018, and 4.0 percent in the second quarter. Hotel occupancy rates were strong as well. The national average rose to 70.2 percent in second quarter of 2018 from 69.4 percent a year earlier (see Figure 19).
The largest 2018 projects included the Omni Seaport Hotel ($450 million) in Boston; the Four Seasons Hotel ($320 million) in New Orleans; and the Loew’s Kansas City Convention Center Hotel ($232 million) in Kansas City, Mo.
INSTITUTIONAL—Staying in the game
The institutional building sector regained its mojo in 2017, growing 9 percent in square footage (348 msf) and 18 percent in dollar value ($143.5 billion) with growth in educational buildings, healthcare facilities and large transportation terminal projects. In 2018, this sector advanced another 2 percent in square footage (354 msf) and 1 percent in dollar value ($145.5 billion). Increases are expected again this year, gaining 2 percent in square footage (361 msf) and 3 percent in dollar value ($149.7 billion).
Education
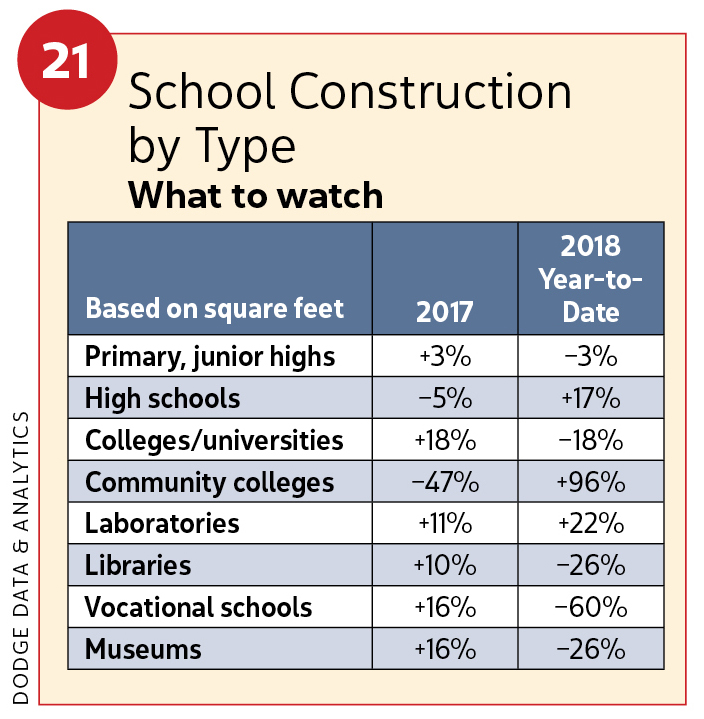
Educational facility gains in 2018 rose 9 percent in square footage (147 msf) and 11 percent in dollar value ($64.2 billion) (see Figures 20 and 21). Put-in-place growth stood between 2–4 percent. Stability was seen in primary and junior high schools. High school construction experienced moderate growth. College and university projects receded in square footage. In 2019, education is predicted to grow 4 percent in square footage (153 msf) and 6 percent in dollar value ($68.3 billion).
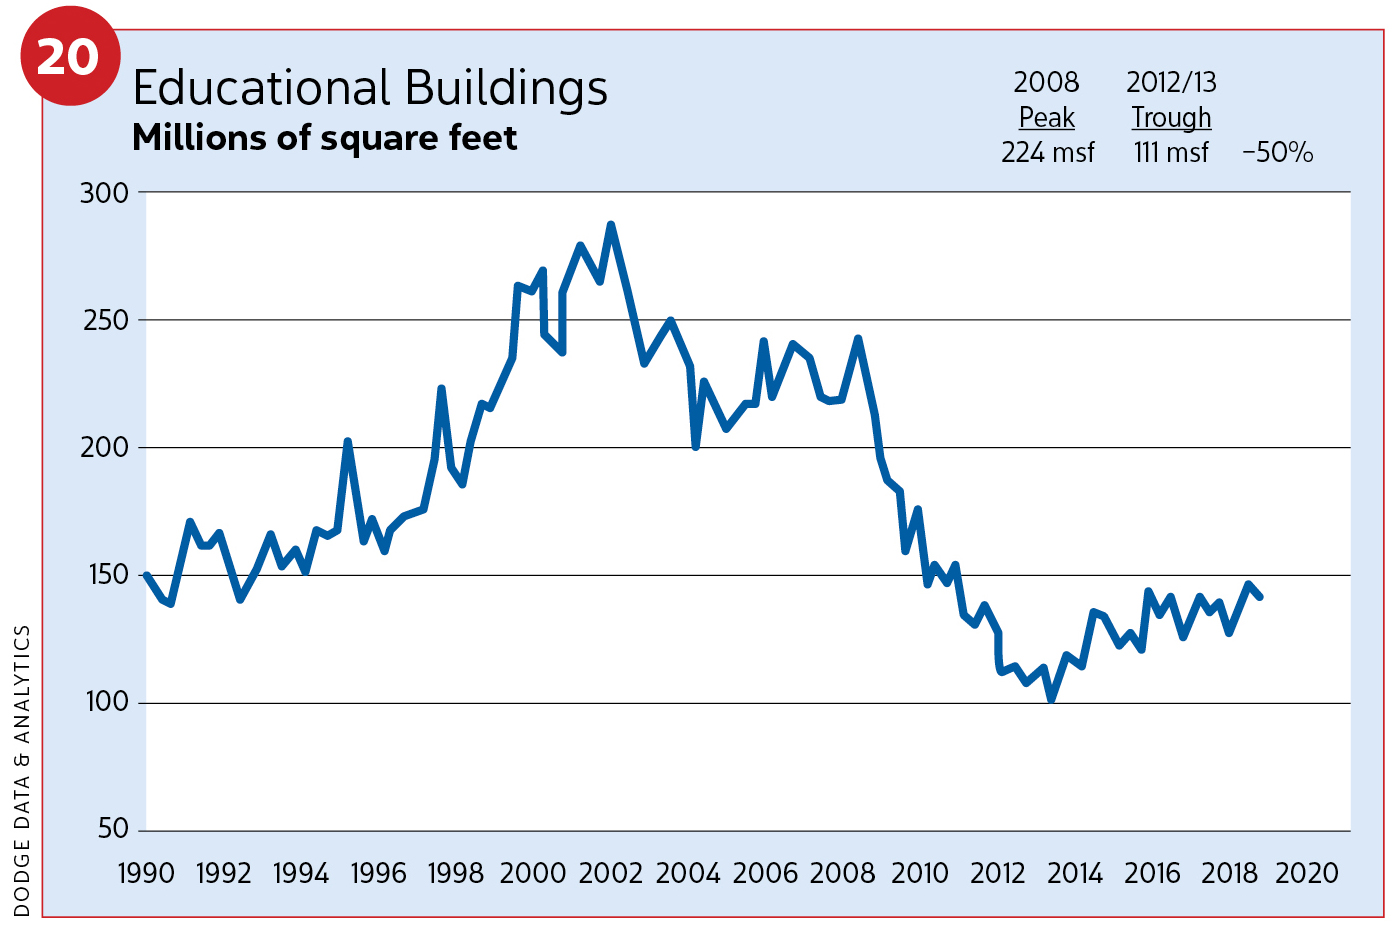
Spending is forecast to reach no more than 5 percent.
Noteworthy bond measures in 2017 have given the educational sector a good foundation. Examples included $2.7 billion in metro Houston; $1.1 billion in Austin, Texas; and $922 million in school construction in Charlotte, N.C. More bond measures (some of which were renovation) passed in November 2018 and build on the momentum. They included Round Rock, Texas ($508 million); Spokane, Wash. ($495 million); and Eugene, Ore. ($319 million).
Large K–12 projects greenlit in 2018 included a high school addition ($202 million) in Somerville, Mass., new high schools in Frisco, Texas ($200 million), and Sherwood, Ore. ($186 million). The top five states in K–12 construction starts (dollar amounts year-over-year) were Texas (up 9 percent), California (up 30 percent), New York (up 8 percent), Washington state (up 28 percent) and Ohio (up 30 percent).
According to the National Center for Education Statistics (NCES), K–12 enrollments (public and private schools) grew by 469,000 (0.9 percent) between 2008–2013. Between 2013–2018, numbers advanced to 451,000 (0.8 percent). Together, they represent 55.9 million students in 2018. By 2023, numbers will reach 56.5 million, or 621,000 more. High school enrollments will climb by 369,000 (2.2 percent) and lower grades by 252,000 (0.6 percent). At the college/university level, enrollments are improving, too. From 2013–2018, growth stood at 311,000 (1.5 percent). Over the next five years (until 2023) enrollments are projected to jump 1.4 million (6.9 percent), bringing total enrollment to 22.1 million.
Notable projects that broke ground in 2018 included the University of Washington Population and Health Initiative facility ($230 million) in Seattle; the University of Oregon’s Knight Campus for the Acceleration of Scientific Impacts ($230 million) in Eugene, Ore.; and a biomedical research facility ($210 million) at Stanford University in Stanford, Calif.
Hospitals and healthcare facilities
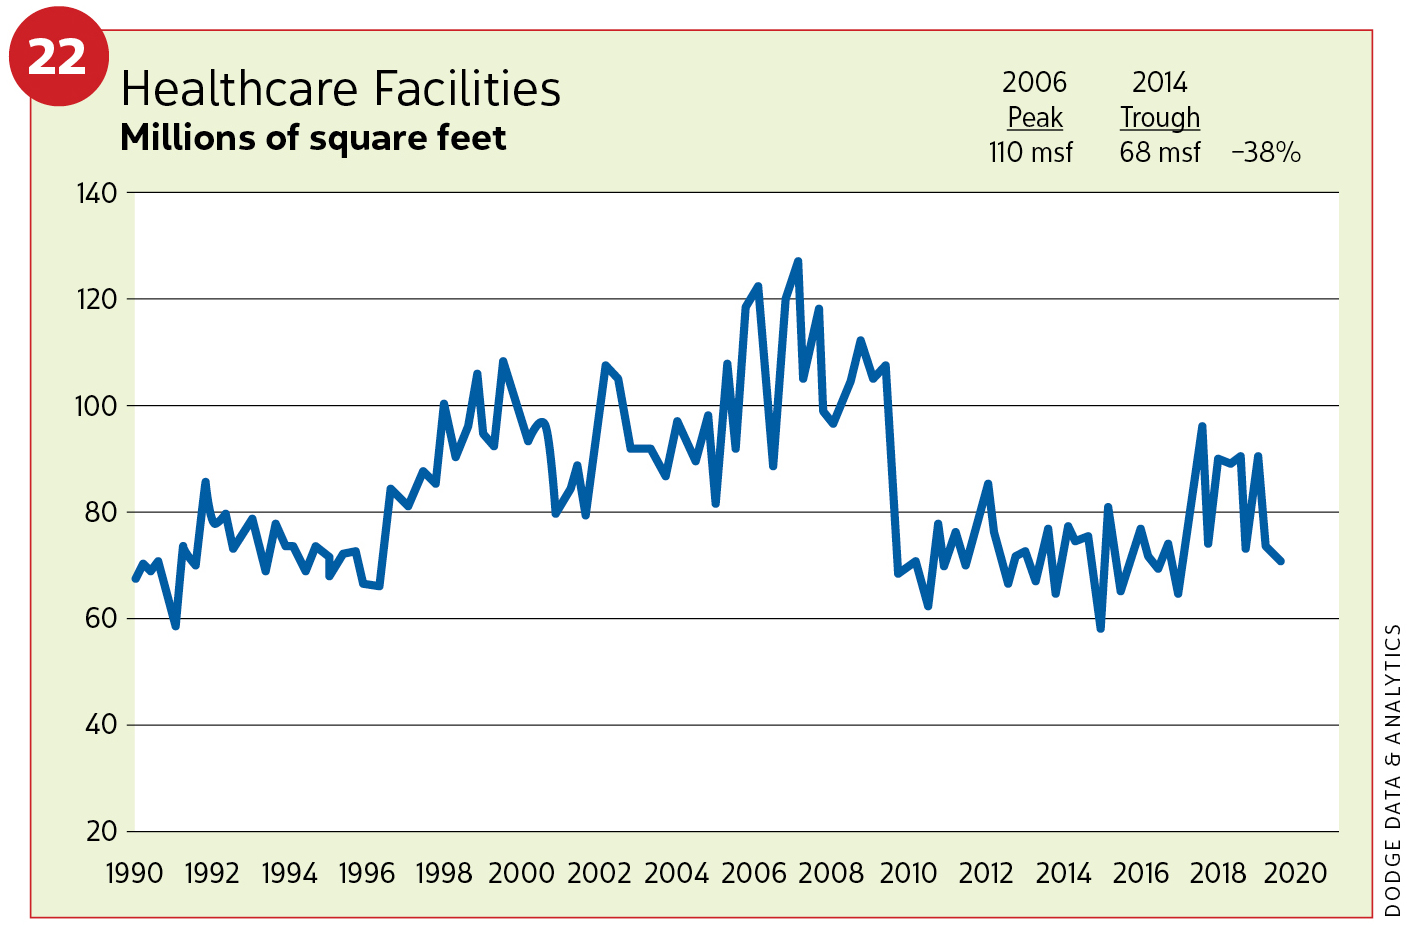
Healthcare construction has languished but took a notable upturn in 2017, growing 10 percent in square footage (85 msf) and 6 percent in dollar value ($28.2 billion) (see Figure 22). Several large hospital projects helped. With fewer such projects in 2018, sector performance dropped 6 percent in square footage (80 msf) and 5 percent in dollar value ($26.8 billion). Spending grew as much as 2 percent. In 2019, momentum is expected to return, showing growth by 4 percent in square footage (83 msf) and 6 percent in dollar value ($28.6 billion). Put-in-place spending will be flat.
With 28 percent of the U.S. population now over the age of 55, this growing demographic shift should portend well for healthcare construction. The continuing fight over the Affordable Care Act in Congress and the courts adds some volatility.
Major 2018 projects included an expansion of Cincinnati Children’s Hospital ($500 million); the construction of the Boston Children’s Hospital clinical building ($400 million); and Prince George’s County Regional Hospital ($295 million) in Upper Marlboro, Md.
Transportation
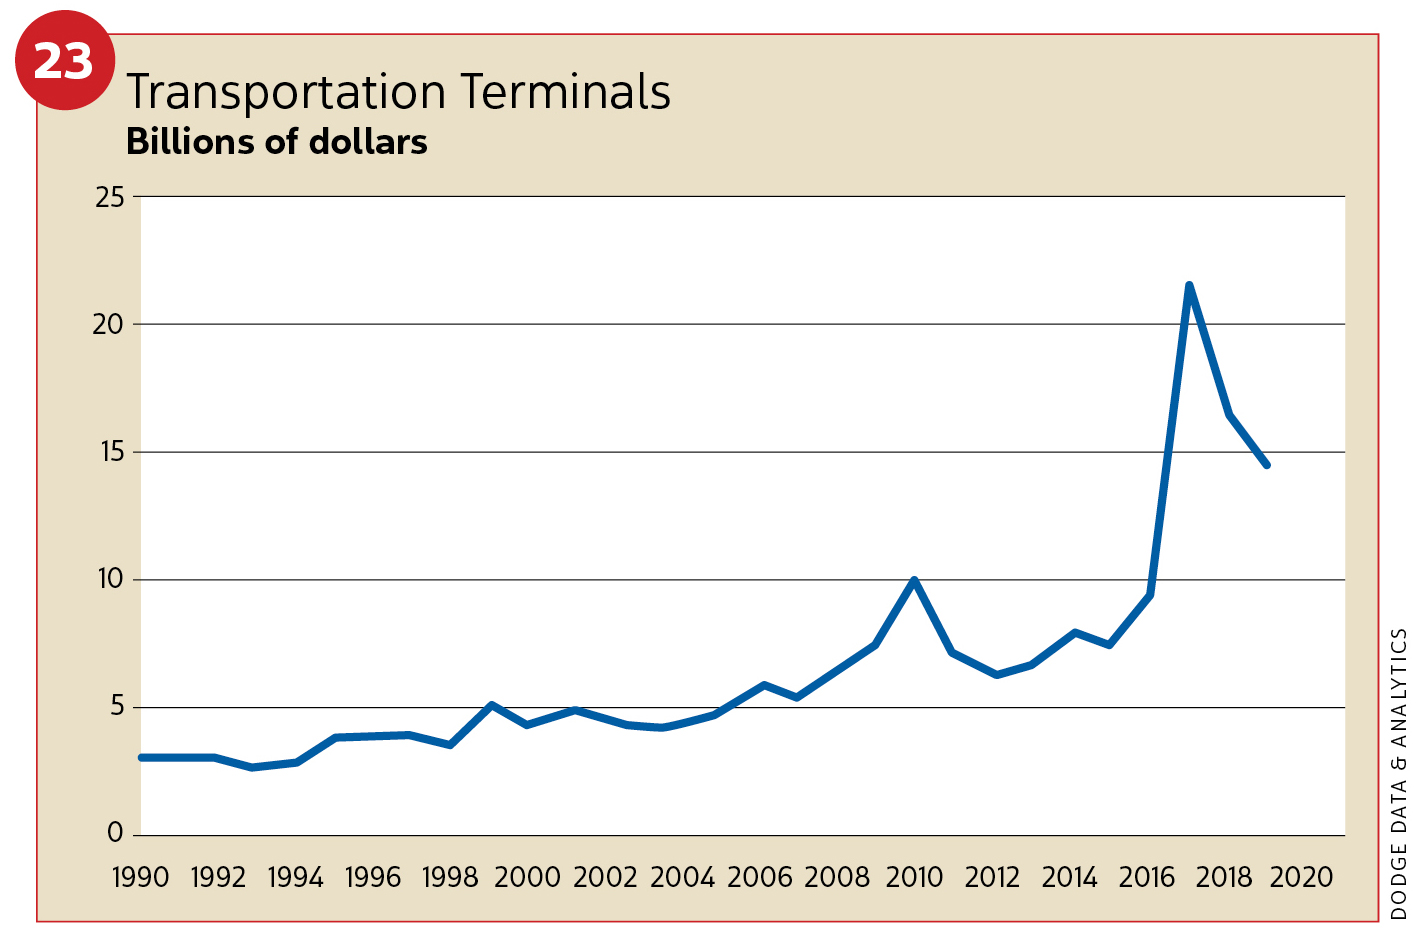
In 2017, the transportation sector led the way in institutional building with starts gaining 34 percent in square footage (29.0 msf) and a massive 126 percent rise in dollar value ($21.5 billion). Major contributors included work commencing on the $4 billion terminal overhaul at LaGuardia Airport in New York City; terminal work at major airports in Los Angeles, Orlando and San Francisco; and key rail work including a $1.3 billion Moynihan Station project in New York. Some pullback occurred in 2018 as starts withdrew by 5 percent in square footage (275 msf) and 24 percent in dollar value ($16.3 billion). Put-in-place spending was brisk at 15–17 percent. In 2019, forecasts show a lesser retreat at 2 percent in square footage (27.0 msf) and 12 percent in dollar value ($14.4 billion). Spending should advance between 5–10 percent (see Figure 23).
In 2018, major transportation projects included the North Concourse ($740 million) at Salt Lake City International Airport; a concourse expansion project ($700 million) and Great Hall terminal upgrade ($650 million) at Denver International Airport, and a North Concourse project ($375 million) at Reagan National Airport in Arlington, Va.
Amusement and recreational
The last couple of years have generally been strong for amusement and recreational building. In 2018, increases of 10 percent in square footage (52.0 msf) and 12 percent in dollar value ($20.1 billion) were seen. Construction types are shown in Figure 24. This year, fewer projects are expected to break ground. Expect to see declines of 6 percent in square footage (49.1 msf) and 2 percent in dollar value ($19.7 billion). Helping is the reauthorization of tax-exempt status for private activity bonds in the federal tax reform bill.
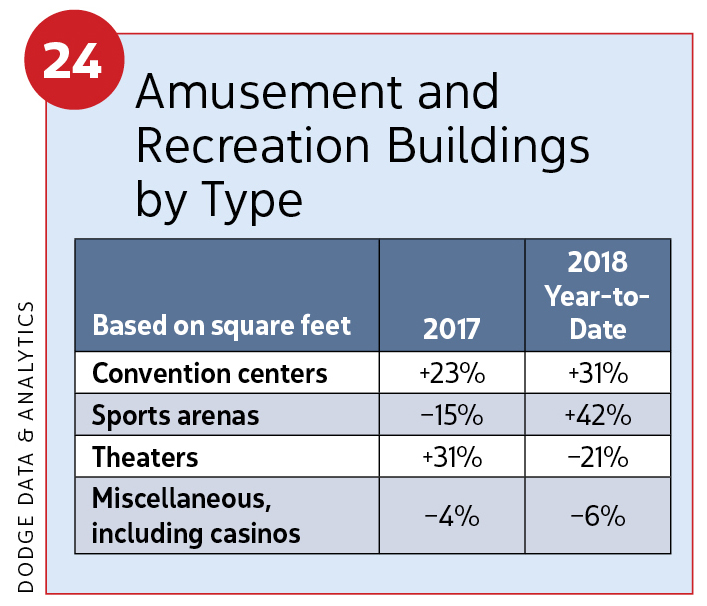
Major projects in 2018 included the NFL Raiders’ new home stadium ($1.3 billion) in Las Vegas; expansion of the Washington State Convention Center ($810 million) in Seattle; and the performing arts complex at the World Trade Center ($363 million) in New York City.
Public buildings
While starts in public building construction (fire and police stations, court houses, state capitols and governmental administrative buildings) have been soft, they have advanced into positive territory, most robustly in 2017 (24 percent to 195 msf and 6 percent to $9.6 billion). This past year, starts advanced 5 percent in square footage (20.5 msf) and 4 percent in dollar value ($9.8 billion). In 2019, there may be a 1-percent decline in square footage (20.3 msf) but a dollar gain of 2 percent ($10.4 billion). The sector had benefited from the 2009 stimulus act. More recently, however, it was affected by limited federal spending for General Services Administration spending.
In 2018, starts for detention facilities and police/fire stations were up. Military buildings and courthouses were down (see Figure 25). In the future, some stimulus for this sector will likely be found in a $486 million increase for the General Services Administration’s new construction account.
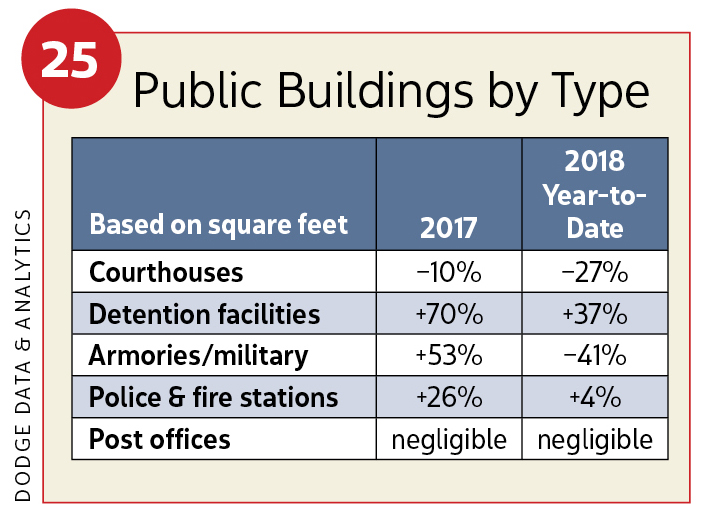
Major projects in 2018 included the Center for Law Enforcement and Public Health ($207 million) in Philadelphia; the Franklin County Corrections Center ($175 million) in Columbus, Ohio; and the Johnson County Courthouse ($126 million) in Olathe, Kan.
Religious
In 2017, religious building construction stopped its retreat and grew 16 percent in square footage (11.2 msf) and 19 percent in dollar value ($2.1 billion). Last year, starts slipped back by 18 percent in square footage (9.2 msf) and 12 percent in dollar value ($1.9 billion). Small gains are expected to return in 2019; 1 percent in square footage (9.2 msf) and 3 percent in dollar value ($1.9 billion).
The religious building sector is expected to make small gains in future years, though drags can be found in the recent tax reform bill. Because the standard deduction for individuals has increased, fewer taxpayers may choose to itemize deductions like charitable contributions. Lower tax rates also shrink savings gained from itemization.
The AGC summarized put-in-place for this sector (and added water, conservation and amusement) to show spending growth in 2018 between 7–9 percent. It offered no forecast for 2019.
MANUFACTURING—Cooling gains
Dollar values of manufacturing construction starts grew 27 percent ($25.8 billion) in 2017 while square footage shrunk 3 percent (70 msf) (see Figure 26). Last year, dollar gains reached 18 percent ($30.4 billion). Square footage fell another 5 percent (65 msf). Put-in-place spending fell into the negative for 2018, ranging between –1 to –3 percent. In 2019, smaller gains in starts are expected at a projected 2 percent for dollar value ($30.9 billion) and 5 percent in square footage (68 msf). Spending advances will be flat, (near zero).
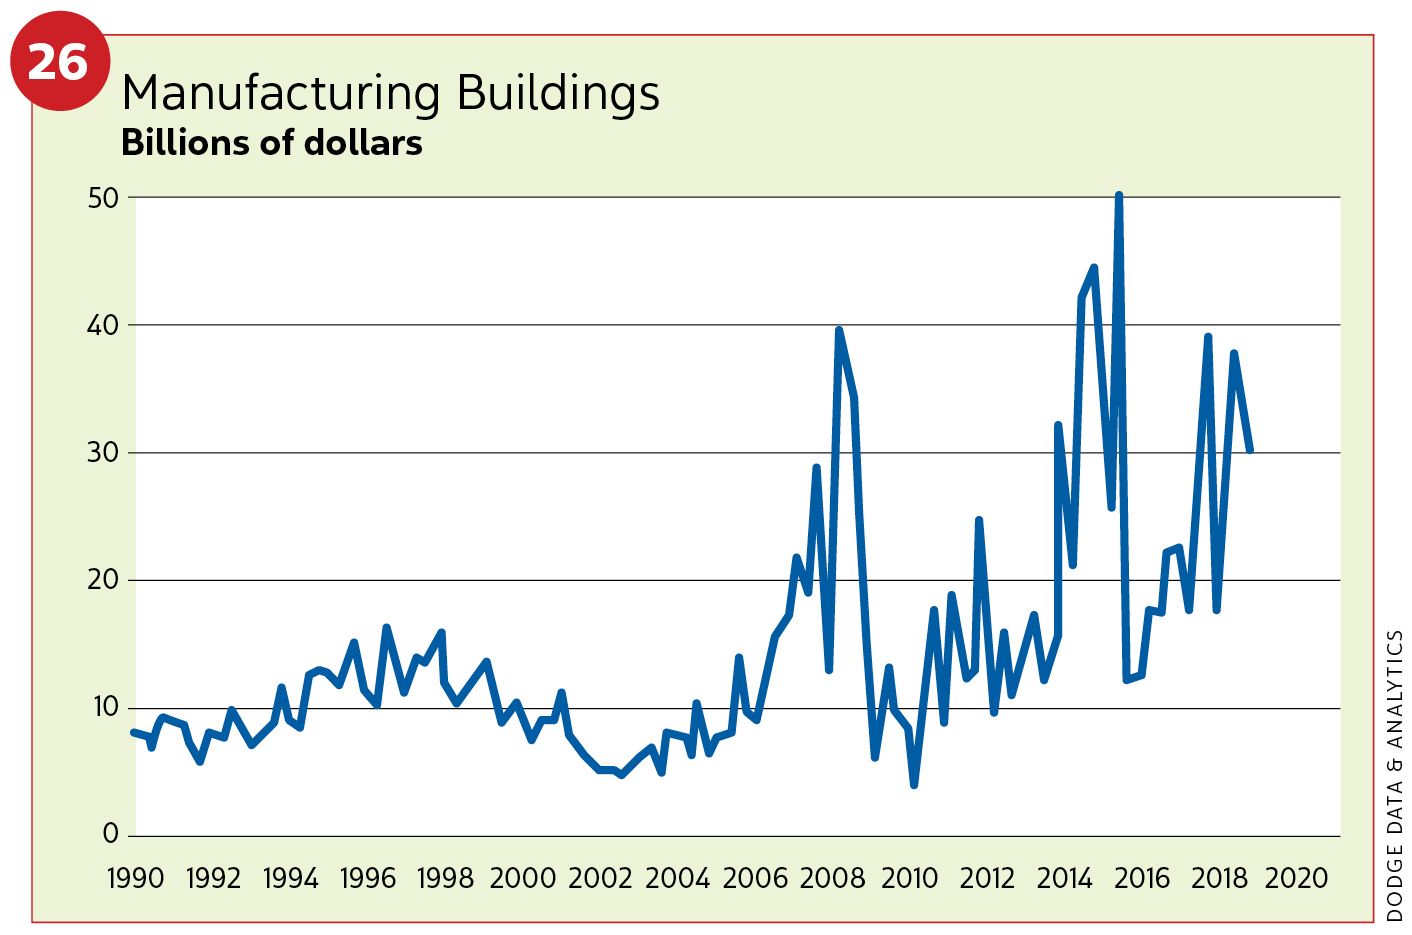
Rising oil prices in 2018 ($70 per barrel in the third quarter) have helped incentivize investment in energy-related projects. The lower corporate tax rate from 35 percent to 21 percent helped in full expensing for equipment spending. If ratified by Congress, the United States-Mexico-Canada Agreement (USMCA, formerly NAFTA) could positively influence this sector. Dampers of growth are lurking, however, such as rising interest rates and subsequent financing costs. Tariff hikes and a trade war with China could constrain this sector in 2019 and 2020 if exports flatten or decline. Capacity utilization rates in 2018 trended upward ever so slightly in the first nine months of 2018 (75.2 percent in January to 76.5 percent in September).
In that period, 31 projects were valued at $100 million or more. The largest was the U.S. Department of Energy’s uranium processing facility ($6.5 billion) in Oak Ridge, Tenn. Other noteworthy energy projects included a propylene-oxide and tertiary-butyl-alcohol plant ($2.4 billion) in Channelview, Texas, and a petrochemical plant expansion ($1.7 billion) in Port Arthur, Texas. Beyond energy projects, 2018 saw construction of an aluminum-rolling mill ($800 million) in Ashland, Ky.; a Continental Tire plant ($682 million) in Clinton, Miss.; and an Intel chip fabrication plant renovation ($400 million) in Chandler, Ariz.
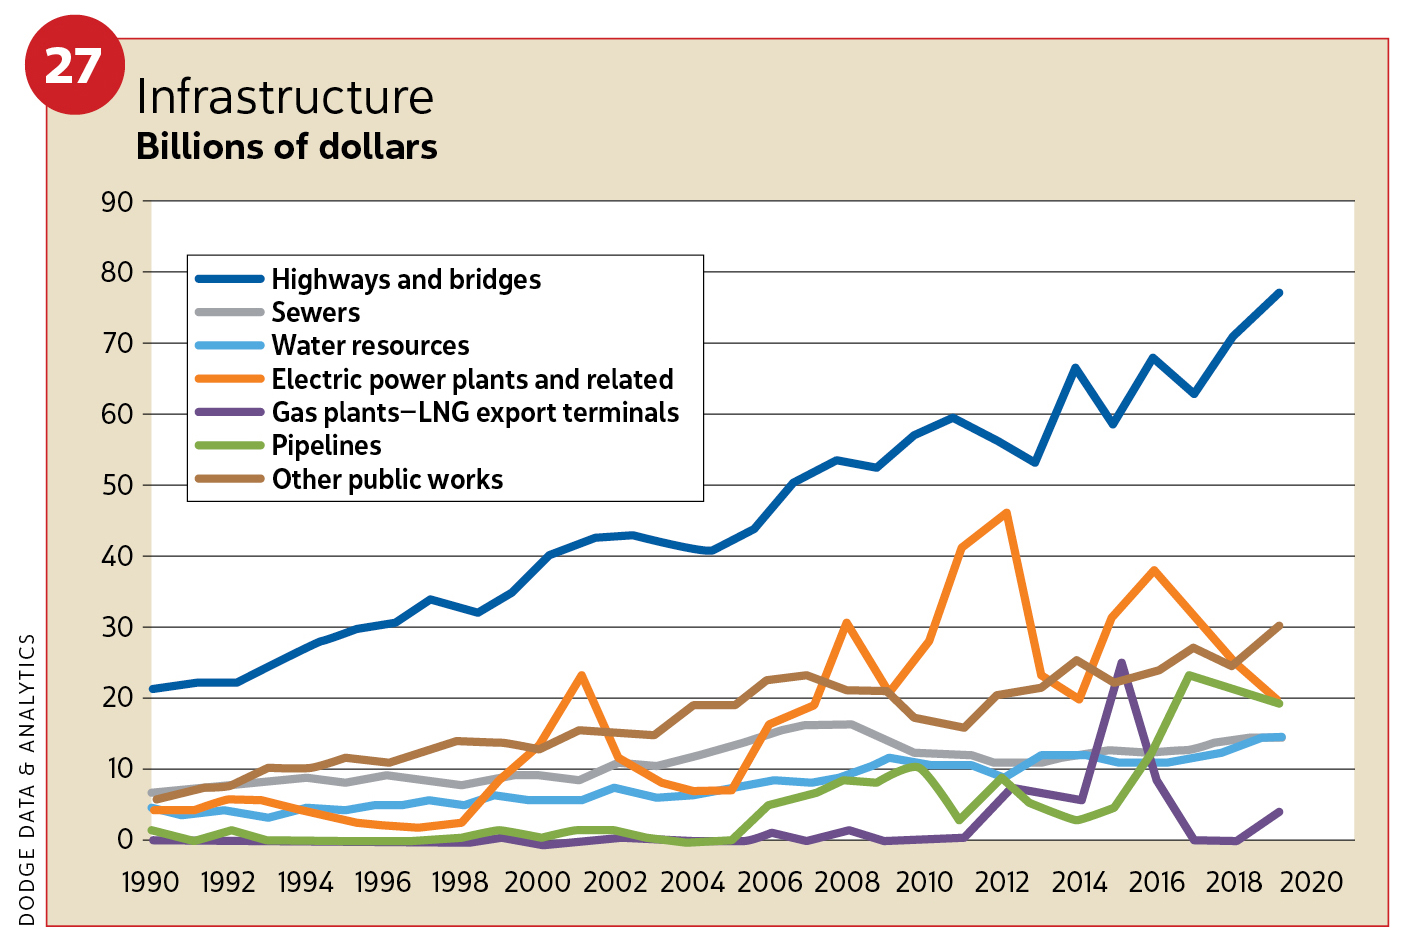
PUBLIC WORKS—Humming along
Robust construction, driven in part by pipeline projects, made 2017 a very good year for public works as starts more than doubled to 18 percent ($159.9 billion). Last year saw a smaller gain of 2 percent ($162.5 billion). The federal 2018 omnibus appropriations, state and local bond measures, and related hurricane-restoration projects helped support public works in 2018 (see Figure 27). Moody's deRitis believes infrastructure investment remains dangerously low. This year, stronger starts at 4 percent ($169.6 billion) are expected.
Highways and bridges
Highway and bridge construction rose 7 percent ($76.7 billion) in 2018. Put-in-place spending ranged between 5–7 percent. This year, another gain of 3 percent ($79.3 billion) is expected. Spending is projected between 3–8 percent. The 2018 omnibus allotted $8.7 billion for transportation, including a $3.5 billion increase for highways and bridges. State and local government funding is also supporting this sector, as has a rise in gasoline taxes, approved in 27 states since 2013.
The top five states for highway and bridge construction year-over-year (first 9 months of 2018) were Texas, up 48 percent; California, up 31 percent; Florida, flat growth; New York, up 1 percent; and Pennsylvania, though down 8 percent. Large projects in 2018 included the I-405 improvement project ($1.2 billion) in Orange County, Calif; the Grand Parkway project ($855 million) in Houston; and the Twin Ship Channel Bridge replacement ($568 million) in Pasadena, Texas.
Environmental public works
The omnibus appropriation bill has boosted this sector. Starts in 2018 were expected to climb 7 percent ($39.4 billion). This year should see a 6-percent gain ($41.7 billion).
A few factors are at work. The federal spending bill bolstered the Environmental Protection Agency’s water infrastructure state revolving fund low-interest loan programs by $300 million for both the clean water and drinking water fund. The Army Corps of Engineers civil works program was increased by $789 million. Both the USACE and the Bureau of Reclamation water infrastructure programs had funding increased to $918 million. Post-disaster relief and rebuilding funds also kicked in for 2018 hurricanes Harvey, Irma and Maria.
In 2018, river/harbor work climbed 14 percent ($13.4 billion). This year, it should grow 5 percent ($14.1 billion). Large projects in 2018 included a storm sewer tunnel project ($580 million) in Washington, D.C., and a flood mitigation project ($310 million) in Brooklyn, N.Y.
Sewer construction for 2018 rose an estimated 10 percent ($14.0 billion). This year, construction is expected to rise 4 percent ($14.5 billion). Key projects in 2018 included an environmental cleanup project ($1.4 billion) at the Los Alamos National Laboratory in New Mexico and the Echowater Tertiary Treatment facility ($300 million) in the Sacramento, Calif., region.
Put-in-place spending for sewer and waste-disposal projects stood at 7–9 percent. The AGC did not offer a 2019 projection in the ConstructConnect webinar.
Water-supply construction in 2018 slipped an estimated 2 percent ($12.2 billion). In 2019, this sector will reverse and climb an expected 9 percent ($13.1 billion). Major projects in 2018 included the Catskill Aqueduct repair and rehabilitation project ($159 million) in Catskill, N.Y., and a water treatment plant replacement ($99 million) in Thornton, Colo.
Other public works
Pipelines, mass transit and outdoor sports stadiums help comprise “other public works.” After continued strong gains in 2017 (43 percent, or $51.6 billion) thanks to pipelines, this sector retreated 10 percent ($46.4 billion) in 2018. It’s expected to regain momentum this year, growing 5 percent ($48.6 billion). A drag on this sector could materialize if China imposes a retaliatory 25 percent tariff on U.S. liquefied natural gas (LNG) exports.
Looking at 2018 natural gas pipeline work, major projects included the Mountain Valley Pipeline expansion ($3.5 billion) in West Virginia and Virginia; the Mountaineer Xpress Pipeline ($2.1 billion) in West Virginia; and the NEXUS natural gas pipeline ($2.0 billion) in Ohio and Michigan.
Rail projects continued to be strong in 2018 and should carry over into 2019. The 2018 omnibus spending bill added $3.1 billion for rail infrastructure. Top projects in 2019 include the Long Island Rail Road expansion ($1.5 billion) in Nassau County, N.Y.; the Westside Purple Line extension/section 2 ($1.4 billion) in Los Angeles; and the Green Line Extension ($1.1 billion) in Somerville, Mass.
Electric power plants
Electric power and gas plant construction dropped 32 percent ($31.8 billion) in 2017. Last year, the drop was less at 25 percent ($23.7 billion). Spending (adding in pipelines) did gain between 4–6 percent.
Consider 2019 a big improvement. This sector will still face a decline, but only 3 percent ($23.7 billion). Forecasts for put-in-place advances shift to 2–5 percent. Natural gas-fired power plants may see modest growth.
A trade war with China could impact construction in this sector, too. Dodge reported Trump’s approved 30-percent tariff on foreign-built solar panels (declining 5 percent per year to 2022) could lower the number of solar farms by 11 percent. Other 2019 headwinds include financing issues with LNG plants, a low capacity utilization rate (75 percent) for electric power generation, and the investment tax credit for large-scale wind projects reduced from 18 percent to 12 percent.
Top projects in 2018 included the South Field Energy power plant ($1.3 billion) in Wellsville, Ohio; the Entergy Lake Charles power station ($872 million) in Westlake, La.; and the North English Wind Farm ($510 million), one of two built last year in Iowa.
Summary
Total construction advances may be spying a finish line. Sector advances will continue, but some will be smaller. Total gains in 2019 will resemble those in 2018. Looking to this year, institutional and public works are showing strength supported by increased state and federal funding and select private-public partnerships. Residential housing will show overall gains. Manufacturing will grow. Commercial will also advance, and electric/gas will decline slower.
With a maturing economy, the logical question is what’s next? A recession, when it arrives, is expected be “garden variety” and perhaps short-lived. Maybe we slow down but avoid negative growth altogether. Actions in Washington, D.C., and on the world stage will be closely watched as this historic long run continues.
About The Author

GAVIN, Gavo Communications, is a LEED Green Associate providing marketing services for the energy, construction and urban planning industries. He can be reached at [email protected].