We began coverage of our biennial Profile of the Electrical Contractor survey last month with a discussion of demographics and trends in the age of today’s electrical contractors (ECs) and their firms, along with the types of work our readers are doing. In Part 2, we focus on how today’s ECs are doing their work, including the kinds of project teams with whom they’re involved, their level of influence and the importance of building information modeling (BIM) and other collaborative processes in their work.
Join the team
Design/build (DB) and design/assist (DA) project-delivery approaches continue to be a big part of how ECs get work done, according our 2016 survey results. Further, even more respondents reported involvement in any DB or DA work during 2015 (remember that our survey asks about work completed in the prior calendar year). Across the total sample, 73 percent said they had participated in such projects, up from 69 percent in the 2014 study. The uptick was particularly notable in firms with 1–9 employees, with 68 percent reporting any DB or DA work, up from 63 percent two years ago. Firms with 10-plus employees didn’t see a statistically significant increase in this work (86 percent, up from 84 percent in 2014), but the percentage is high enough that there isn’t much room for more significant growth. See Figure 1, Any Design/Build or Design/Assist Work in Previous Year.
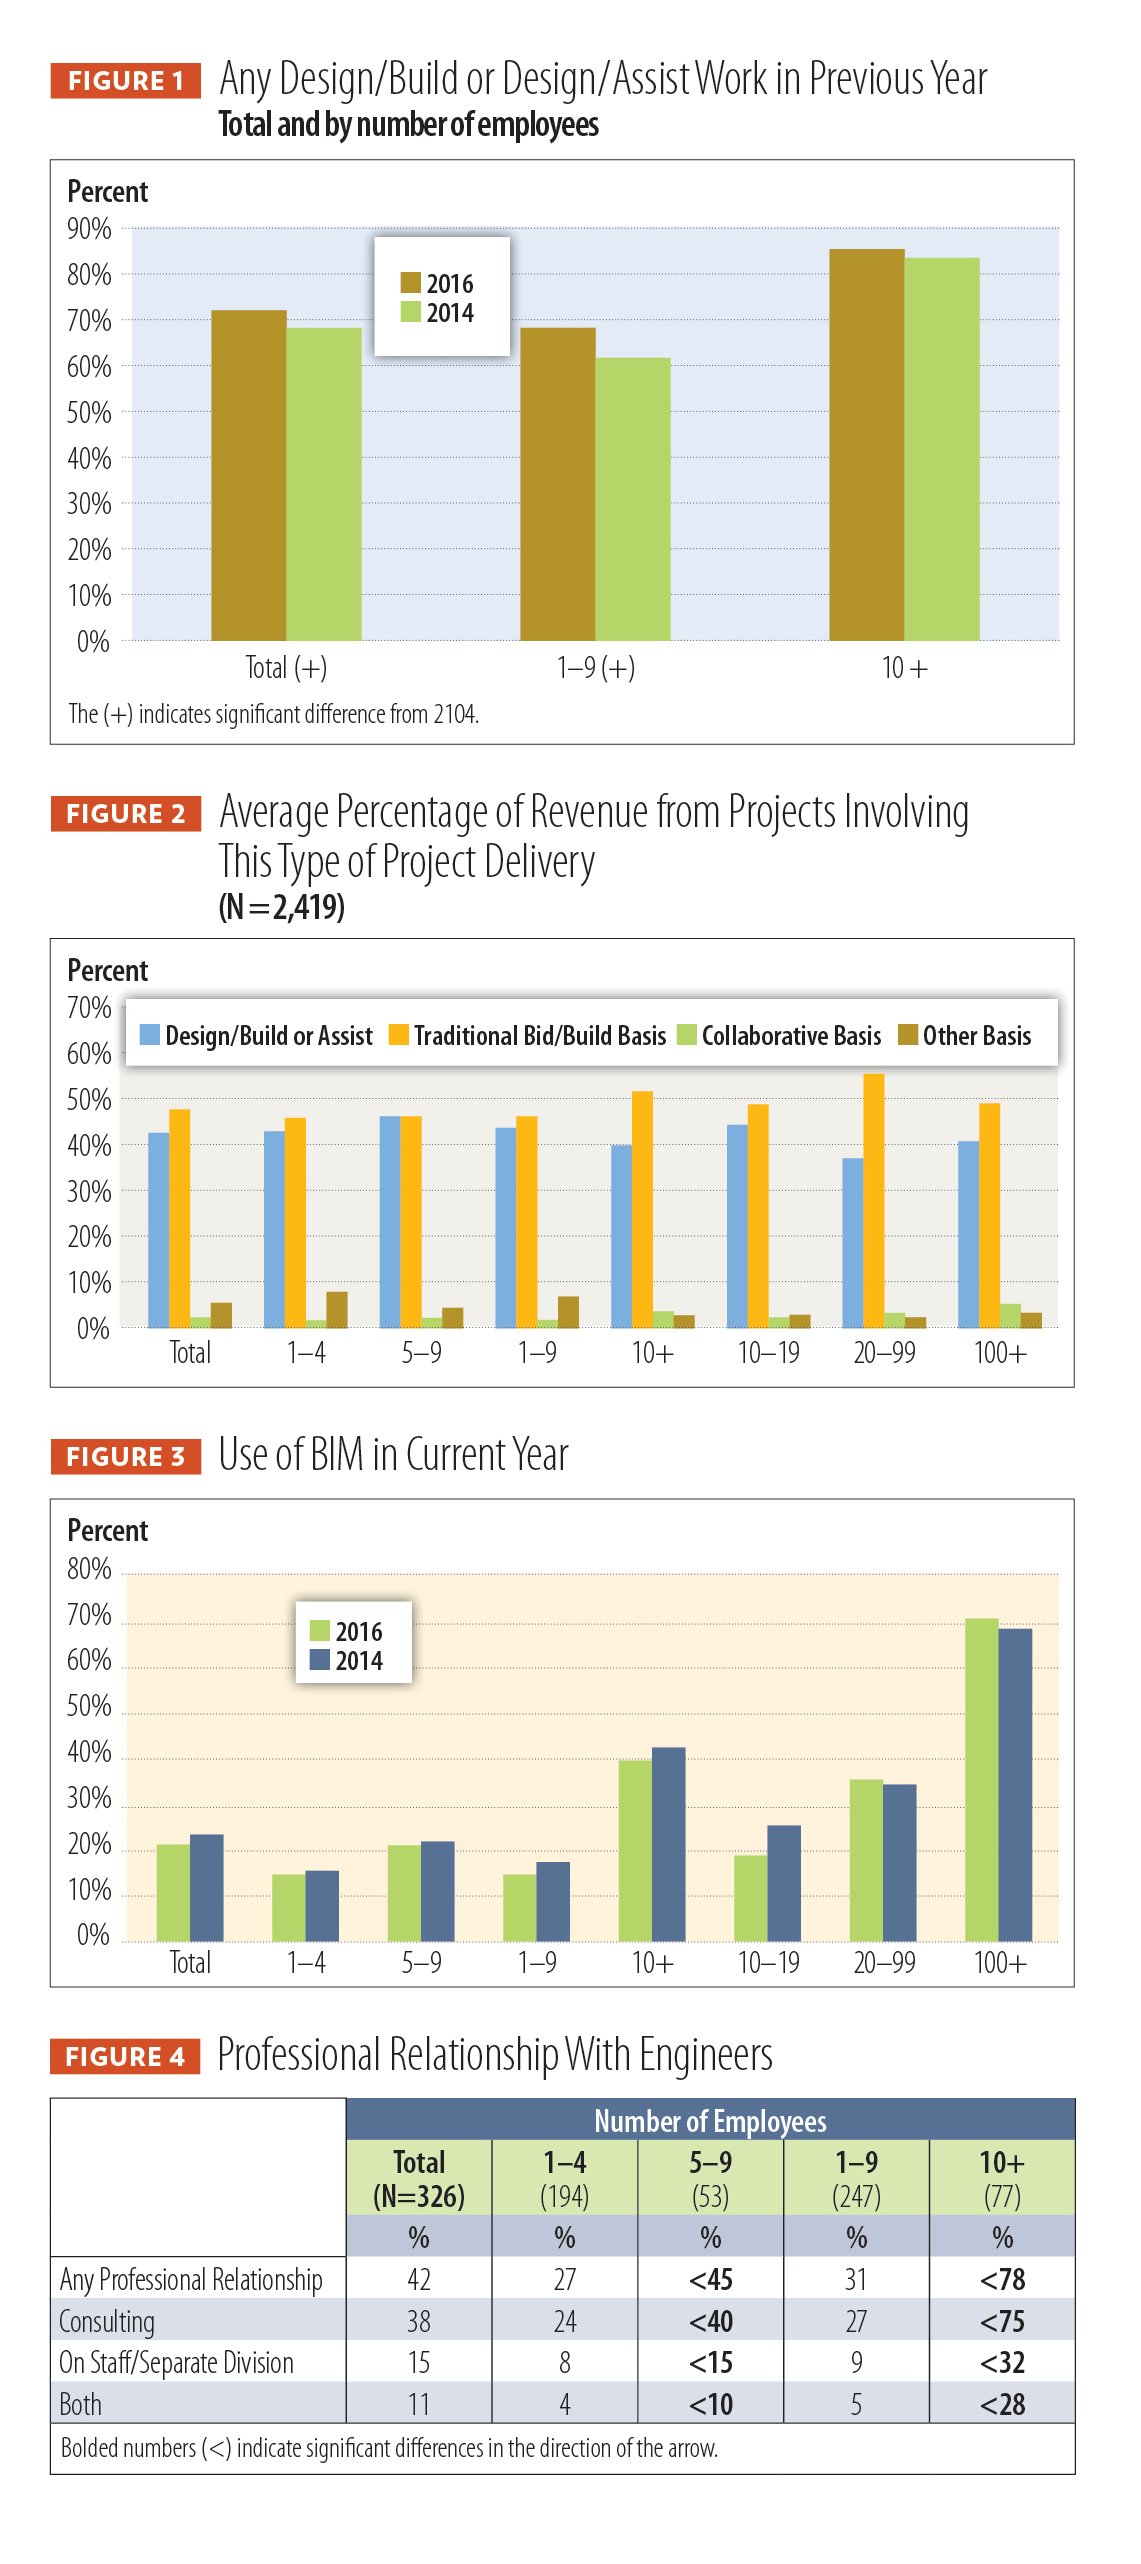
So how does this increased participation in DB and DA work affect ECs’ bottom lines? As shown in Figure 2, Average Percent of Revenue from Projects Involving This Type of Project Delivery, an average of 43 percent of revenue came from such projects, a statistically significant increase from 2014’s 39 percent. As in the past, DB represents the bigger piece of this pie, at 32 percent versus 11 percent for DA. At 49 percent, traditional bid/build is still the most important contributor to total firm revenues.
In an interesting twist from 2014’s results, DA and DB represent a significantly higher percentage of revenue for firms with 1–9 employees (especially 5–9 employees) than for larger firms; two years ago, there was no difference. Following a trend first noticed in 2012, however, traditional bid/build remains a higher contributor for larger firms, especially those with 20–99 employees.
As in the past, we also asked about revenue contributed by projects structured on some “other” basis, and the result was a bit of a surprise. Respondents attributed only 6 percent of project revenue to this category, a big drop from the 12 percent two years ago, which could be a result of the new “collaborative” project-delivery category introduced in this year’s survey. This category encompasses such arrangements as integrated project delivery and virtual design and construction. Perhaps not surprisingly, these methods, which can be expensive to implement, are more common with larger firms. Across the total sample, 12 percent say they have done “any” collaborative building work, but this figure grows to 21 percent for firms with 10–19 employees and approximately 32 percent among firms with 20-plus employees.
“We expect the importance of collaborative building to grow in the future among the largest firms and for it to be adopted to a greater extent by smaller firms,” the report notes. Collaborative building is “an area to watch in the years to come.”
Of course, BIM is a base-level enabling technology for any form of collaborative building. As shown in Figure 3, Use of BIM in Current Year, BIM use remains at essentially the same level first noted in 2012, with just more than 22 percent of respondents noting any use for an average of 6 percent of the time. However, this obscures the larger finding that, while BIM usage is low among the smallest firms (those with 1–4 employees), both use and related average revenues jumped significantly as firm size grows to 5–9 employees—in fact, this group mirrors the participation rate of firms with 10–19 employees.
Engineering—a difference
To better understand who is part of an EC’s team, the 2016 survey initiated some questions regarding the professional relationships ECs have with engineers, whether in a consulting relationship or as a staff member or member of a separate engineering division. The thought was this inquiry would lend some insight into the complexity of the work ECs now are doing. As shown in Figure 4, Professional Relationship With Engineers, engineers are, indeed, important to the work of today’s contractors, with 42 percent of firms reporting any such relationship.
Consulting relationships are more significant—38 percent of firms reported such an arrangement—but a notable 15 percent of firms said they had an engineer on staff or even had a separate engineering division. Also, 11 percent have both consulting and in-house engineering relationships. This setup is more prevalent as firm size grows. However, even small firms see benefit in these relationships, with more than a quarter of companies with 1–4 employees having some sort of ongoing arrangement with an engineer.
In another first, our researchers polled this year’s survey participants on their current level of collaboration with professionals from other building trades, including mechanical; heating, ventilating and air conditioning (HVAC); plumbing; and systems integrators from other trades.
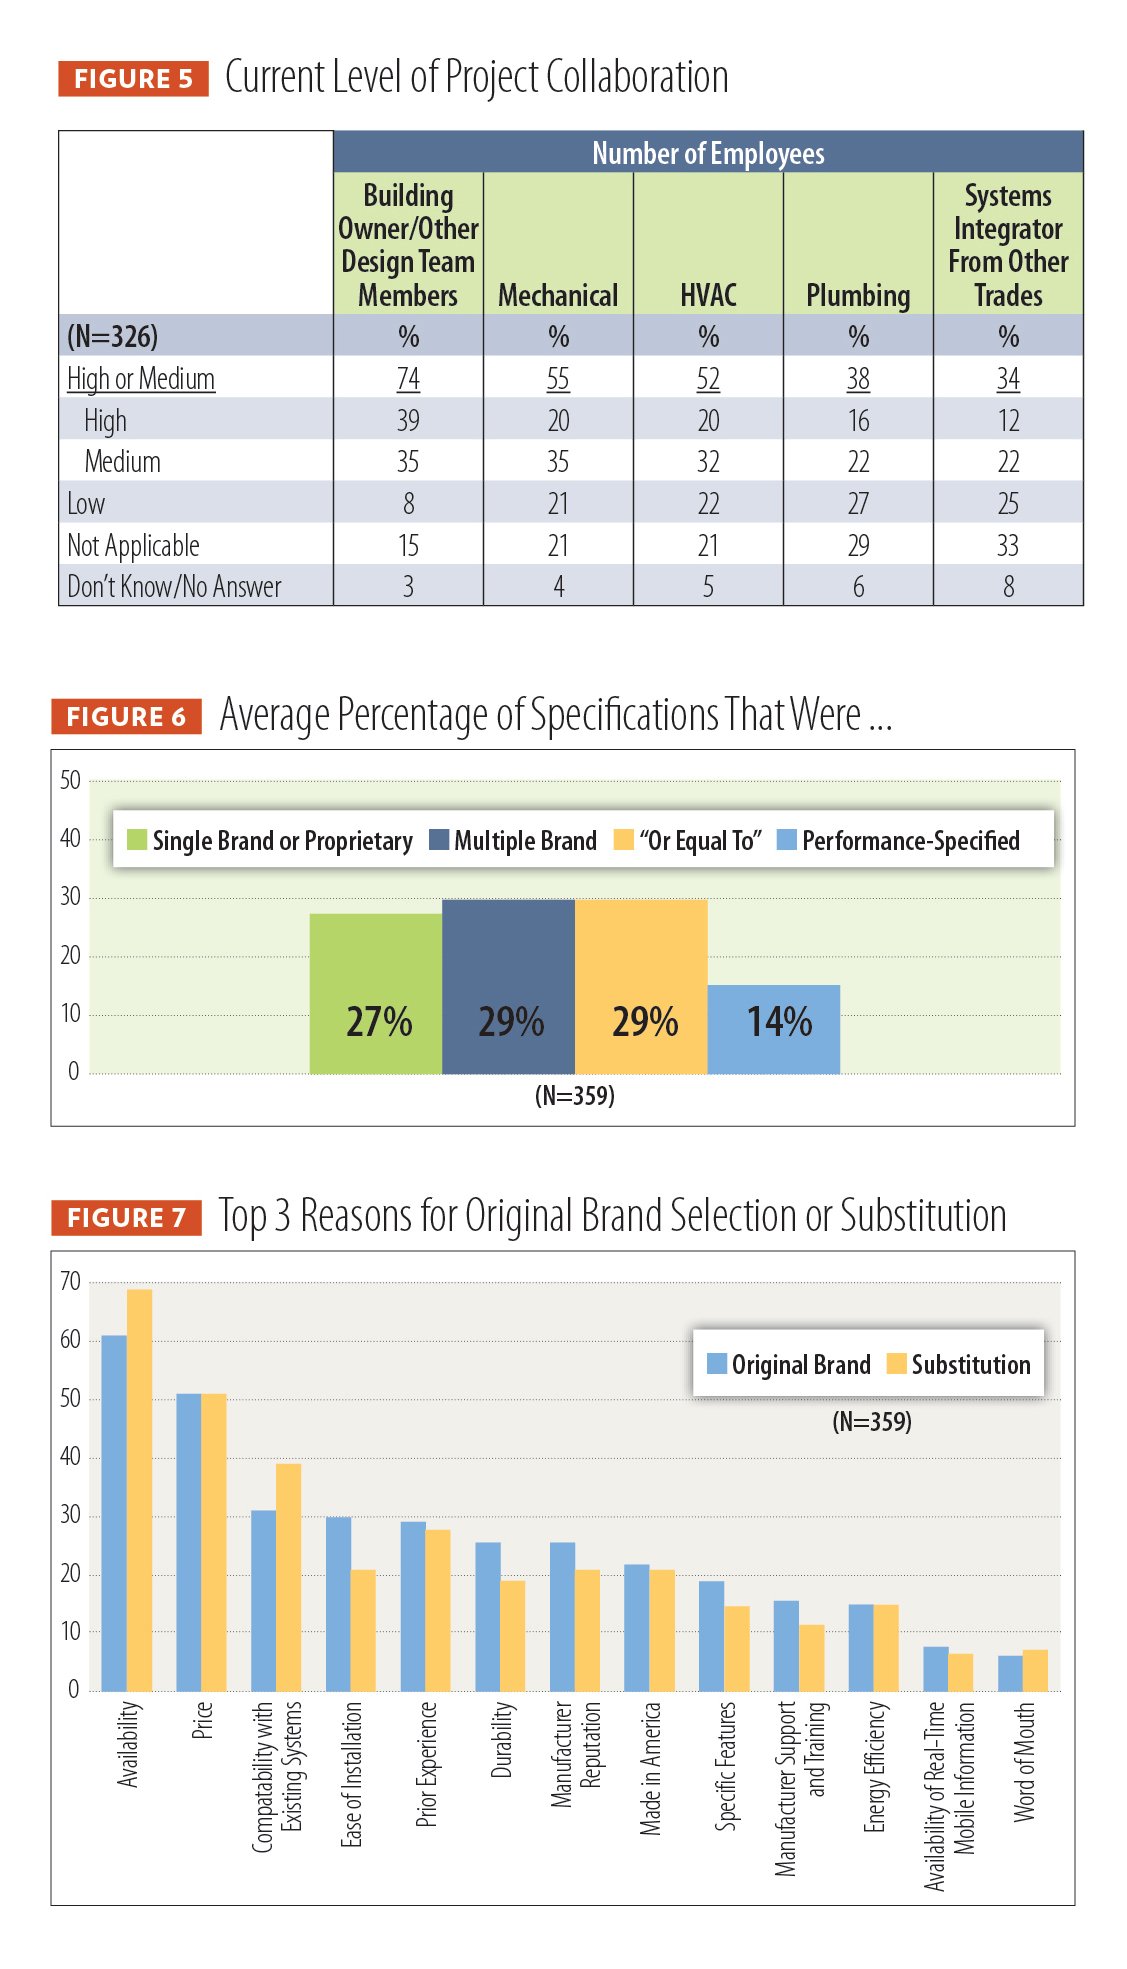
As shown in Figure 5, Current Level of Project Collaboration, there is a lot of teamwork with building owners and other design team professionals on the electrical design, with 74 percent of ECs reporting “high” or “medium” levels of project collaboration with representatives from various trades. In addition, there is cross-trade teamwork most frequently with mechanical and HVAC professionals (55 percent and 52 percent, respectively). More than one-third of respondents reported collaboration with plumbing professionals and integrators from other trades. It is clear that ECs are working with team members from around the building industry.
Just how important are you?
So, just how influential do today’s ECs see themselves when it comes to their projects’ overall electrical design and specifications? According to our findings, results are similar to what we have seen since the 2010 survey. Almost three-quarters reported having a “high” or “medium” ability to influence design or specification with building owners or design team members. However, firm size can make a difference in this perspective: 42 percent of those in firms with 1–9 employees reported a “high” level of influence, versus 30 percent in firms with 10-plus employees. On the flip side, 17 percent of those in larger firms reported a “low” ability of influence, versus only 6 percent in the smaller firms.
This difference in perceived influence could, perhaps, reflect the kind of work performed by companies of different sizes. For example, a small company’s residential customers may be more likely to lean on an EC’s recommendations. The larger and more complex projects in which bigger firms specialize might also include consulting engineers who are responsible for planning and specification.
Influence also could depend on the building stage in which an EC firm gets involved in a project. This apparently varies widely, as the answer “it depends” garnered the most responses, at 35 percent. “Preconstruction” and “construction” came in second, each at approximately 25 percent. Although 58 percent of the total sample say there’s been no change in when their involvement begins over the last three to five years, some 16 percent reported they now get involved earlier in the design process than they did before.
One would expect ECs to have more influence when they receive incomplete plans and specifications, which remains a common occurrence for our respondents, with 72 percent reporting they received incomplete plans or specs at some point during 2015. On average, 40 percent of plans and specs received were incomplete, which is statistically unchanged from the 43.4 percent reported two years ago.
For the first time this year, we asked which building categories saw the highest level of incompleteness, and, not surprisingly, single-family construction took the prize, with plans and specs becoming more complete as project complexity increases.
What specifiers want
As in previous years, 2016’s investigation into EC purchasing patterns began with a look at the requirements of the specifications they initially receive. We asked respondents to estimate the percentage of initial specifications that fall into each of four categories: single brand or proprietary, multiple brand, “or equal to,” or performance-specified. On average, participants reported a single brand is specified about one-quarter of the time, as shown in Figure 6, Average Percentage of Specifications That Were.
An interesting twist emerged in this year’s finding. In contrast to earlier surveys, there was no statistical difference in how categories ranked based on firm size. However, the “single brand” option jumped significantly this year to 24 percent from 16 percent, among firms with 10-plus employees, although no other selection option, by itself, changed enough to account for the difference. Initial specifications are, by no means, the final word, as ECs said they are able to make brand substitutions about two-thirds of the time.
A range of factors play into brand selection. As shown in Figure 7, Reasons for Original Brand Selection or Substitution, “availability” and “price” beat all other attributes as a reason for original brand selection. “Availability” was the clear winner for the top spot. We first included compatibility with existing systems in the 2014 survey, and this year, it showed up on 32 percent of respondents’ top-three lists, comparable with ease of installation and prior experience and slightly higher than either durability or manufacturer reputation. When it comes to brand substitution, availability and price remain the top two decision factors, with compatibility with existing systems a clear winner for third place, included in the top-three list by 37 percent of respondents.
It’s interesting that energy efficiency only showed up on 10–15 percent of respondents’ top-three lists, for both original brand selection and brand substitution. One possible explanation is efficiency benefits take place too long after project completion to play a role in an EC’s selection process. Alternatively, it could be that efficiency is so integral to overall performance that ECs don’t consider it as a separate feature.
That’s a wrap
So, in this year’s profile, we saw continued, albeit slow, improvement in the EC market. Green-related projects, such as installing electric-vehicle charging stations and energy storage, have become more important to ECs’ bottom lines, and BIM, perhaps thanks to more affordable technology, is becoming a bigger presence in smaller firms.
Will these trends continue? Quite possibly, and we will let you know for sure in two years when we present the 2018 Profile of the Electrical Contractor.
About The Author

ROSS has covered building and energy technologies and electric-utility business issues for more than 25 years. Contact him at [email protected].