You're reading an older article from ELECTRICAL CONTRACTOR. Some content, such as code-related information, may be outdated. Visit our homepage to view the most up-to-date articles.
Economists coined the term “half-fast” to describe the financial recovery. It’s an economy in flight, but it isn’t quite soaring. Dodge Analytics calls it “a mixture of headwinds and tailwinds.” For example, 2015 construction starts were forecast for 9 percent growth. They landed at 13—a tailwind. This year’s construction market advance is estimated at 6 percent—a definite headwind. However, it may still catch a tailwind. Construction in 2016 should be a year of sustained progress, albeit with a few soft spots.
(Editor's Note: For an optimized view of the outlook, you also can read it in the digital edition.)
The U.S. economy is projected to grow 3.1 percent this year, up from 2.5 percent in 2015. Upward quarterly performance revisions throughout 2015 bode well for 2016. In fact, that 6 percent construction increase for 2016 ($172 billion) is closer to 10 percent if you eliminate a projected 43 percent downturn in electric power and gas, a nonbuilding sector. Gains of 9 percent are expected for nonresidential building. Residential will be even stronger at 16 percent. Nonbuilding construction overall is projected to fall 14 percent.
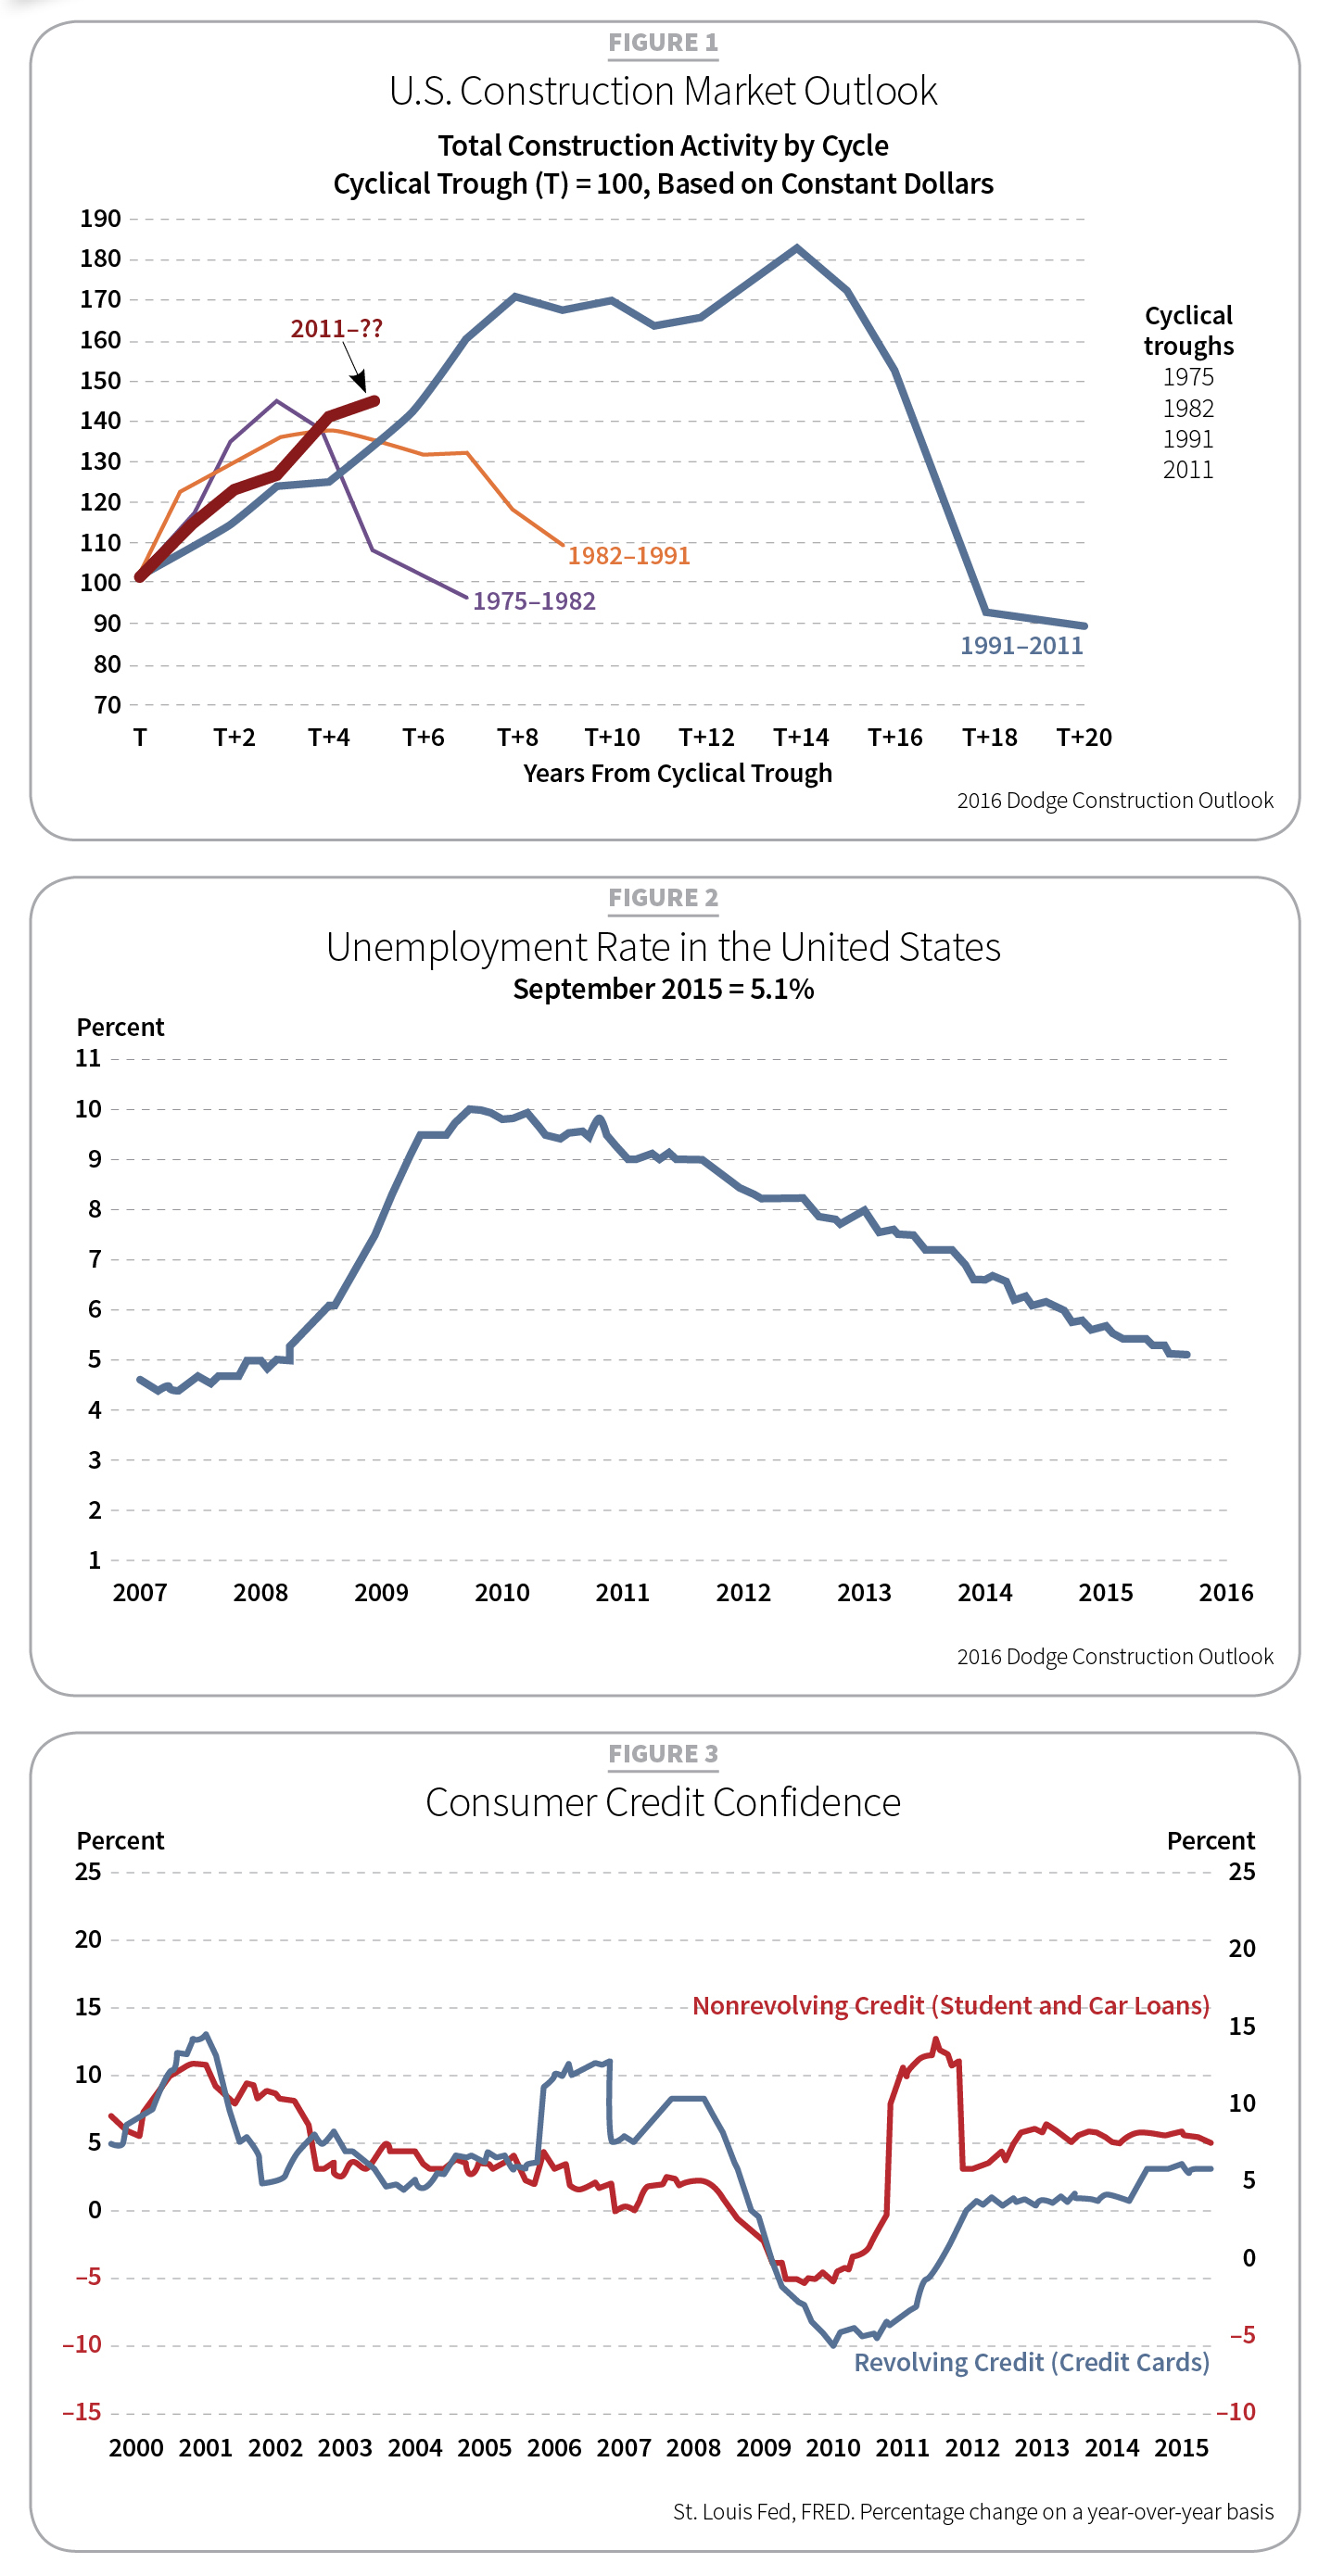
ELECTRICAL CONTRACTOR’s 2016 Construction Outlook is based on two forecasts. One is compiled by Dodge Data and Analytics and the other by Construction Market Data (CMD). Other forecasts, including the National Association of Home Builders (NAHB), show similar growth for 2016, while offering slightly different sector performance numbers. Overall, forecasts agree that total construction activity is trending upward on a cycle that began in 2011 (see Figure 1).
The U.S. economy and construction
Beth Ann Bovino, chief U.S. Economist for Standard & Poor’s Rating Services, spoke at the 2016 Dodge Construction Executive Conference in Washington, D.C., on Oct. 30, 2015. She said the U.S. economy seems to be nearing normal, and she cited several reasons, including an unemployment rate close to a “normal” range of 5.2 to 5.8 percent (see Figure 2). The Bureau of Labor Statistics reported employers added 2.8 million jobs from September 2014 to September 2015, with 1.8 million created in the first nine months of 2015.
Other encouraging statistics include increased consumer spending and more revolving credit (see Figure 3), a strengthening housing market, a return of U.S. manufacturing, resolution to last autumn’s U.S. government budget impasse, and the Federal Reserve (Fed) ready to begin raising interest rates.
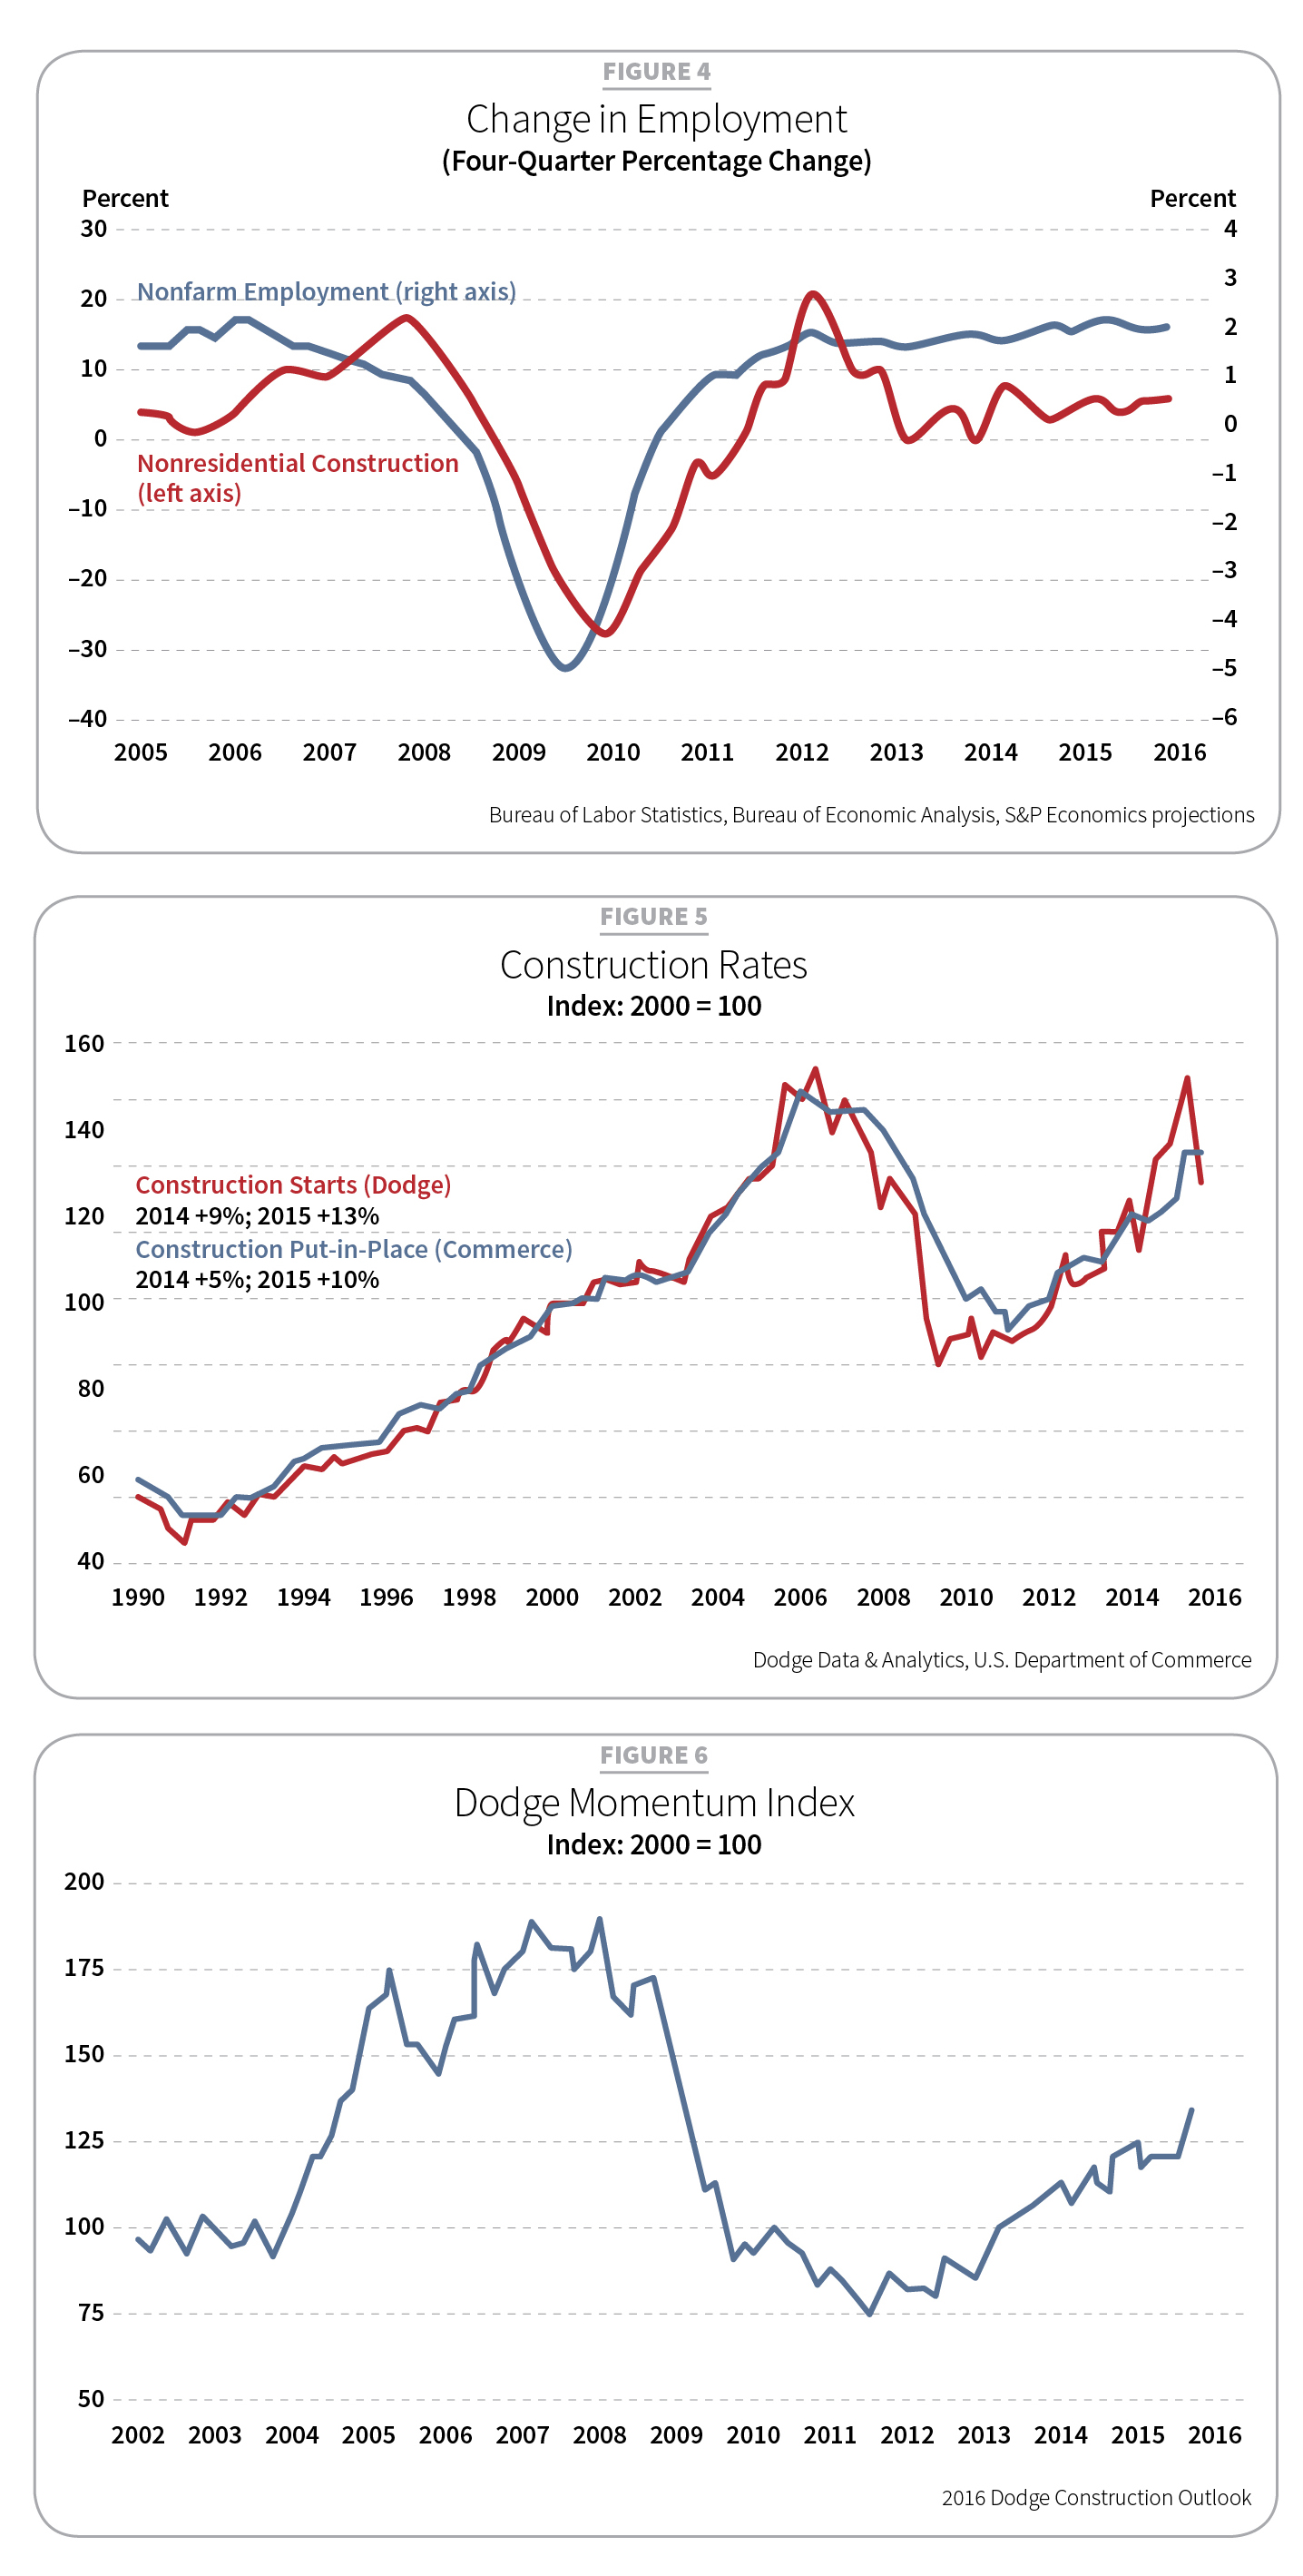
“These are all reasons for optimism,” Bovino said. “We are seeing improvement in nonfarm employment, construction employment (see Figure 4). The ‘missing piston’ in this recovery—housing—is back. Housing starts are bettering 1 million over the past five or more months [largely second half of 2015]. There’s also an improvement in home prices. First-time homebuyers [half of which are millennials] are now buying big-ticket items. For example, millennials make up the largest share of new car buyers [a thriving market]. We are now seeing the beginning of home purchases for this group. Multifamily is close to prerecession levels. Overall, confidence is returning in this economy.”
Worker confidence and bargaining power also is growing. In fact, it may be stronger than suspected.
“Construction starts and construction spending show the expansion is continuing,” said Robert Murray, vice president, economic affairs, Dodge Data and Analytics. “Starts are a leading indicator of construction health and impact of materials costs. They did pull back in the third quarter [of 2015], causing some to ask if construction stalled. I don’t think so. Put-in-place figures [lagging behind starts] are up 19 percent.”
Murray predicted the patterns of growth shown in 2015 would continue into 2016 (see Figure 5).
As a leading indicator of nonresidential building construction, the Dodge Momentum Index tracks initial reports for nonresidential projects at the planning stage, and it provides insight into future construction spending. From a low point in 2011–2012, the index has climbed almost half of the way back to its 2008 high (see Figure 6).
Lending has also reacted to a growing economy
“In a Fed survey, lending standards have eased [18 months for commercial and real estate loans],” Murray said. “Some easing in residential loans has been seen, as well.”
In the second quarter of 2015, commercial and multifamily mortgages rose 29 percent over the same period in 2014. In the third quarter, it grew 12 percent. The Mortgage Bankers Association also reported the delinquency rate for mortgage loans (one- to-four-unit residential properties) decreased to 4.99 percent at the end of 2015’s third quarter. This marked the lowest level since the first quarter of 2007.
In other positives, Murray said oil prices should continue at $44–$50 per barrel, which will sustain the break for consumers at the gas pump. Improved state fiscal health is another positive, although it is still fragile for some states. A large number of bond measures were and are being passed. Material pricing is also “pretty positive,” but with nonresidential construction hovering near 1 percent, labor shortages are dampening construction growth.
A shared view
Presented at Greenbuild 2015 on Nov. 19, 2015, in Washington, D.C., CMD’s “Construction 2016: How Sustainable is the Construction Economic Recovery?” offered findings in line with Dodge’s research.
Alex Carrick, chief economist for CMD, said the country’s independence from foreign energy puts the United States in a great position.
“The 206,000 on-average job gains month-to-month is the best it’s been since the ’70s,” he said.
Kermit Baker, chief economist for the American Institute for Architecture (AIA) found all major construction sectors are pulling together and showing growth.
“We are seeing healthy fundamental numbers,” he said. “In fact, many of our projections for 2015 were surpassed, and while the recovery has been painfully slow, most of the commercial and industrial markets are back. Institutional finally began its recovery earlier this year.”
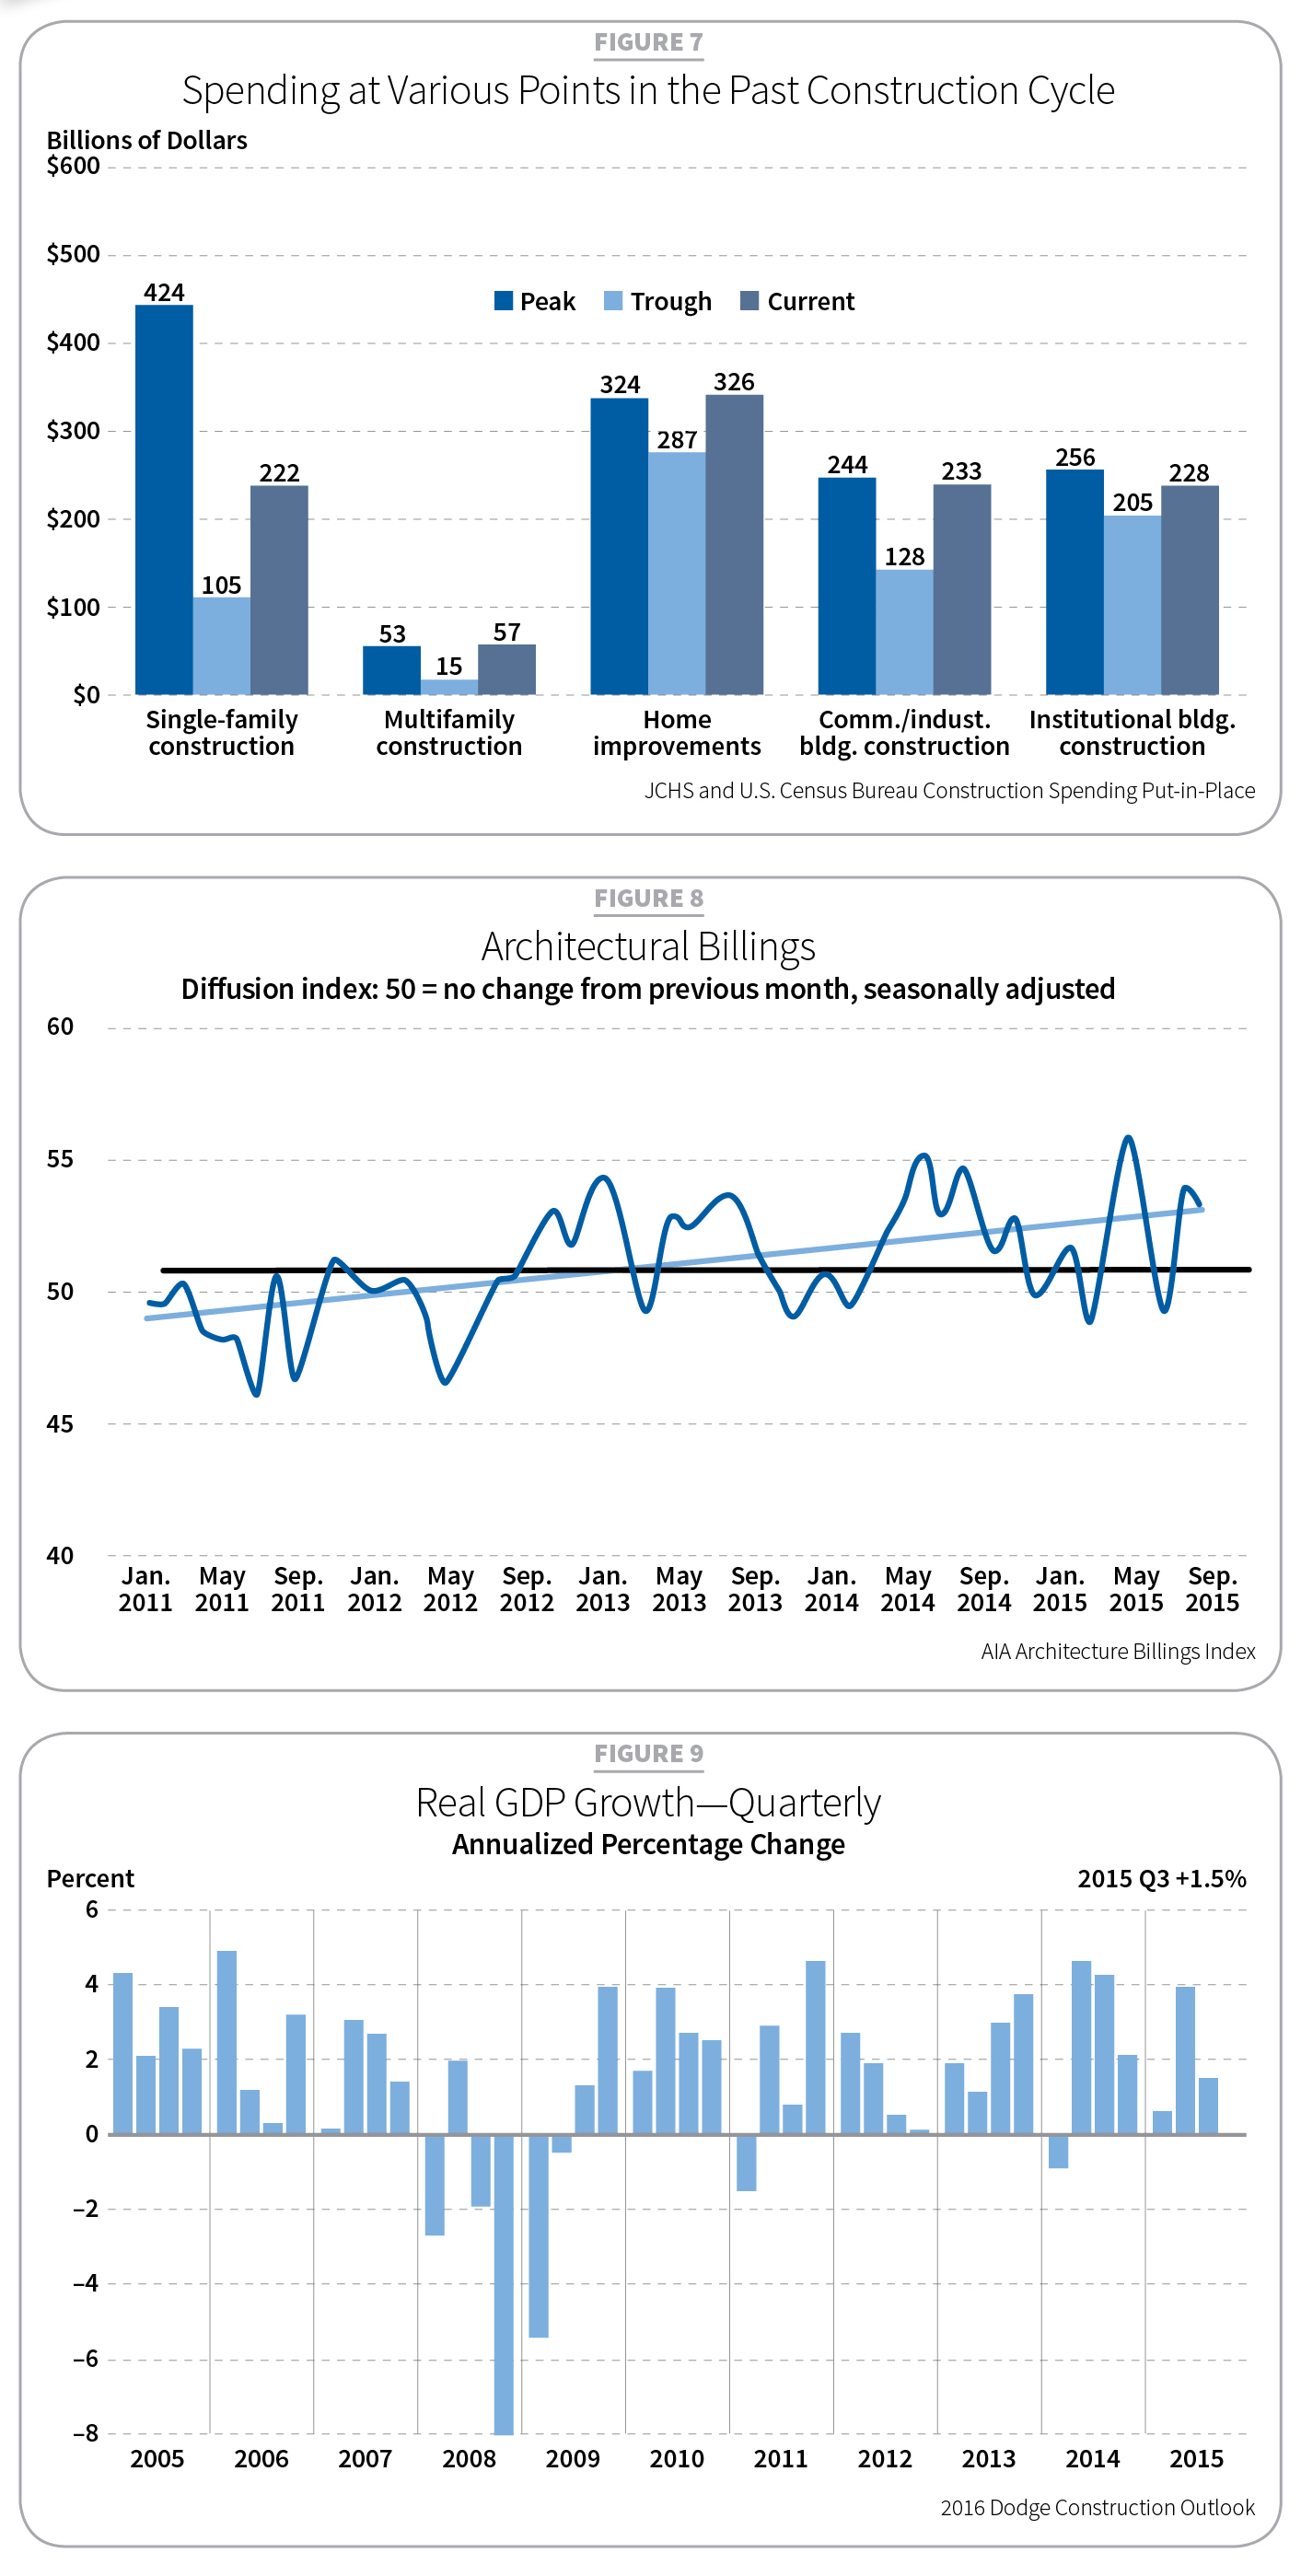
Residential construction spending has been another indication of this economy’s strengthening (see Figure 7).
“Though far from its peak, residential construction spending has also been coming back steadily since 2011, accelerating 14.9 percent 2013 through 2015,” said Ken Simonson, chief economist for the Associated General Contractors (AGC) of America. “Multifamily year-to-year in September (2014–2015) grew by 20 percent, and that healthy number represents the smallest of increases in four years.”
As an additional leading indicator, architectural billings continue to trend up, more often showing an increase of billings from previous months (see Figure 8).
Breaking the cycle and a few headwinds
If every forecast shows good news, why is the recovery considered “half-fast”?
“Between 2007 to mid-2009, consumers lost 20 years of savings, triggering ‘spend less/save more,’” Bovino said. “The middle class lost 40 percent of their wealth. An estimated $1.2 trillion in student-loan debt is another factor. All of this has made the recovery the slowest in 50 years at nearly half the rate of the usual 4 percent seen in historic recoveries.”
Can we break this sluggish cycle?
“While the gross domestic product [GDP] rate is slow, our economy is really big, with 85 percent of it being domestically driven,” she said. “The rebound of domestic portfolios and subsequent consumer spending give this economy a resilient strength.”
GDP grew 2.1 percent (revised from 1.5) in the third quarter of 2015, and it showed a strong 3.9 percent in the second quarter after a weak first quarter of 0.7 percent. A negative trade imbalance (falling exports/rising imports) was a major contributor. Housing strength helped feed GDP growth as fixed investment grew 9.3 percent in 2015’s second quarter. Nonresidential investment grew 4.1 percent, a little less than 2014’s growth of 4.5 percent (see Figure 9).
Bovino does see headwinds, including slowdowns in the energy sector and China, ongoing weakness in the Eurozone and Japan, weak exports due to a strong U.S. dollar, inflation below the Fed’s 2 percent target, and a historically low labor participation rate despite falling unemployment numbers.
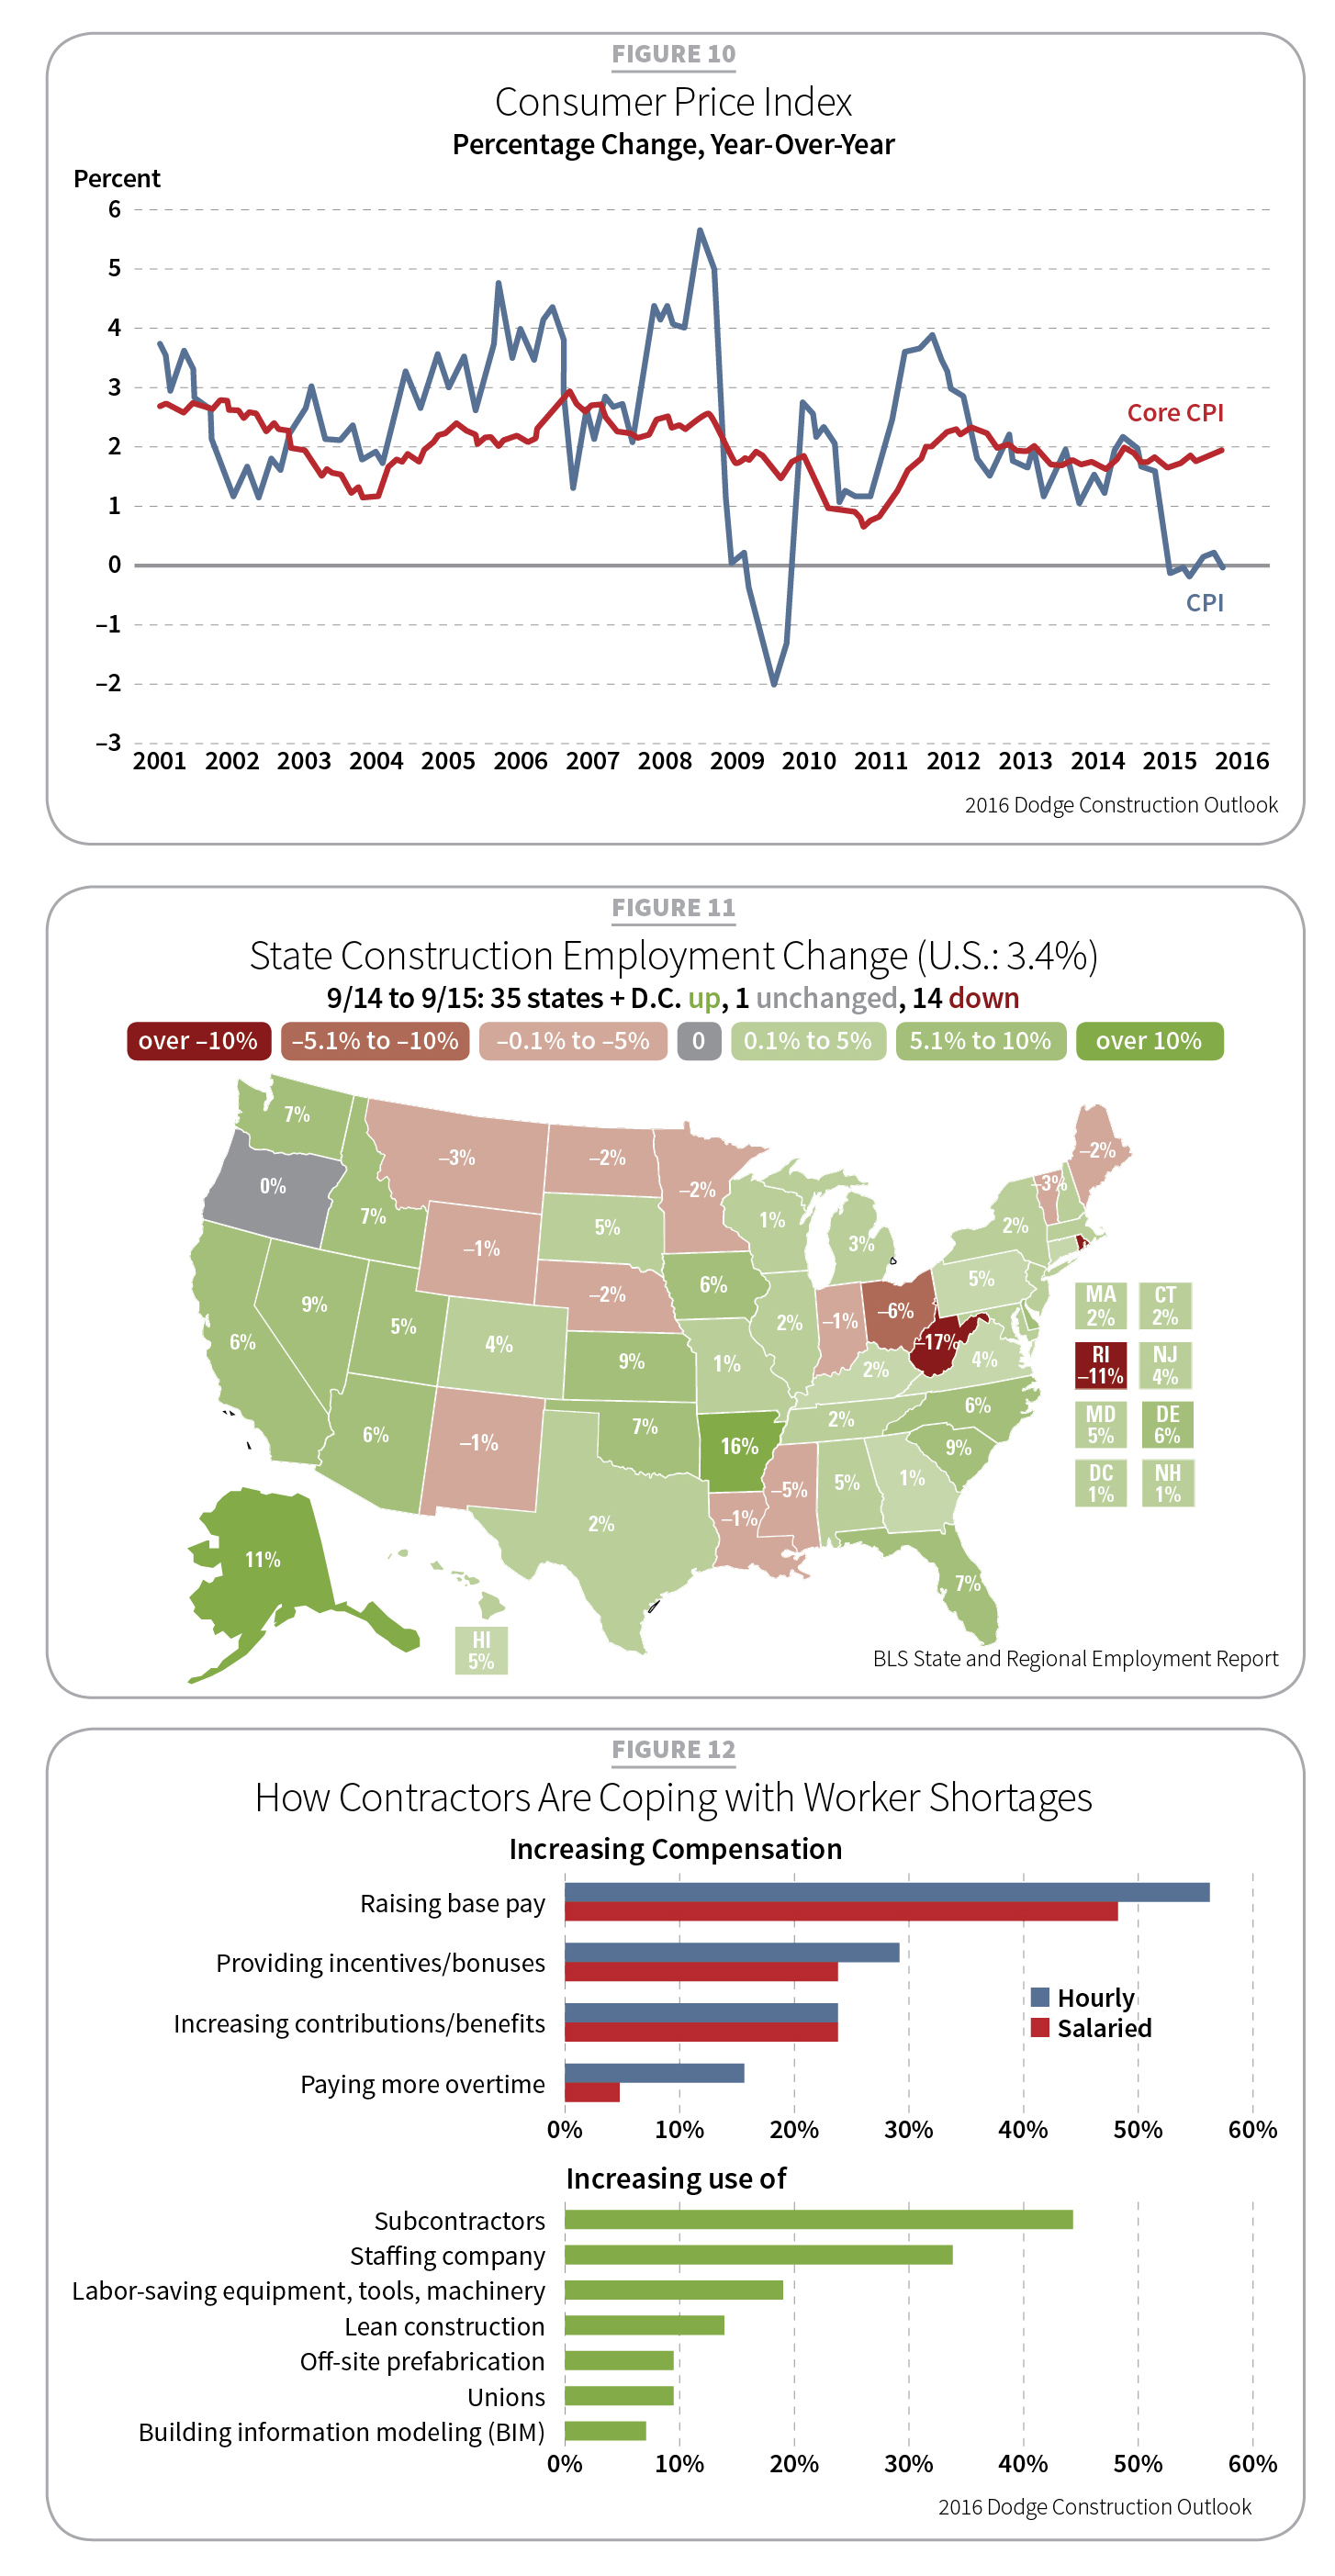
While the Fed has kept rates at 0–0.25 percent since December 2008, the first rate hike of 0.25 percent occurred on Dec. 16, 2015, and more are coming—likely 1.5 percent in the first quarter of 2016. Dodge and CMD expect the recovery to handle modest, gradual hikes. Inflation is expected to remain low. The consumer price index might increase 1–2 percent (see Figure 10). The 10-year Treasury bill rates are expected to rise 3 percent. Finally, the 30-year-fixed mortgage rate may move up to 4.5 percent.
A shortfall of qualified workers
While unemployment has improved, worker participation is at a 30-year low (see Figure 11). A lack of skilled workers threatens growth in the construction industry.
“We are close to 15-year lows for skilled construction labor,” Simonson said. “Positions are hard to fill from carpenters to electricians. Apprentice programs have fallen by half.”
He said contractors are offering pay raises, incentives, bonuses and improved benefits in the short term. They are also increasing the use of subcontractors and staffing companies, investing in labor-saving equipment, and applying lean construction practices (see Figure 12).
Baker asked whether this lack of skilled labor could sink the construction recovery.
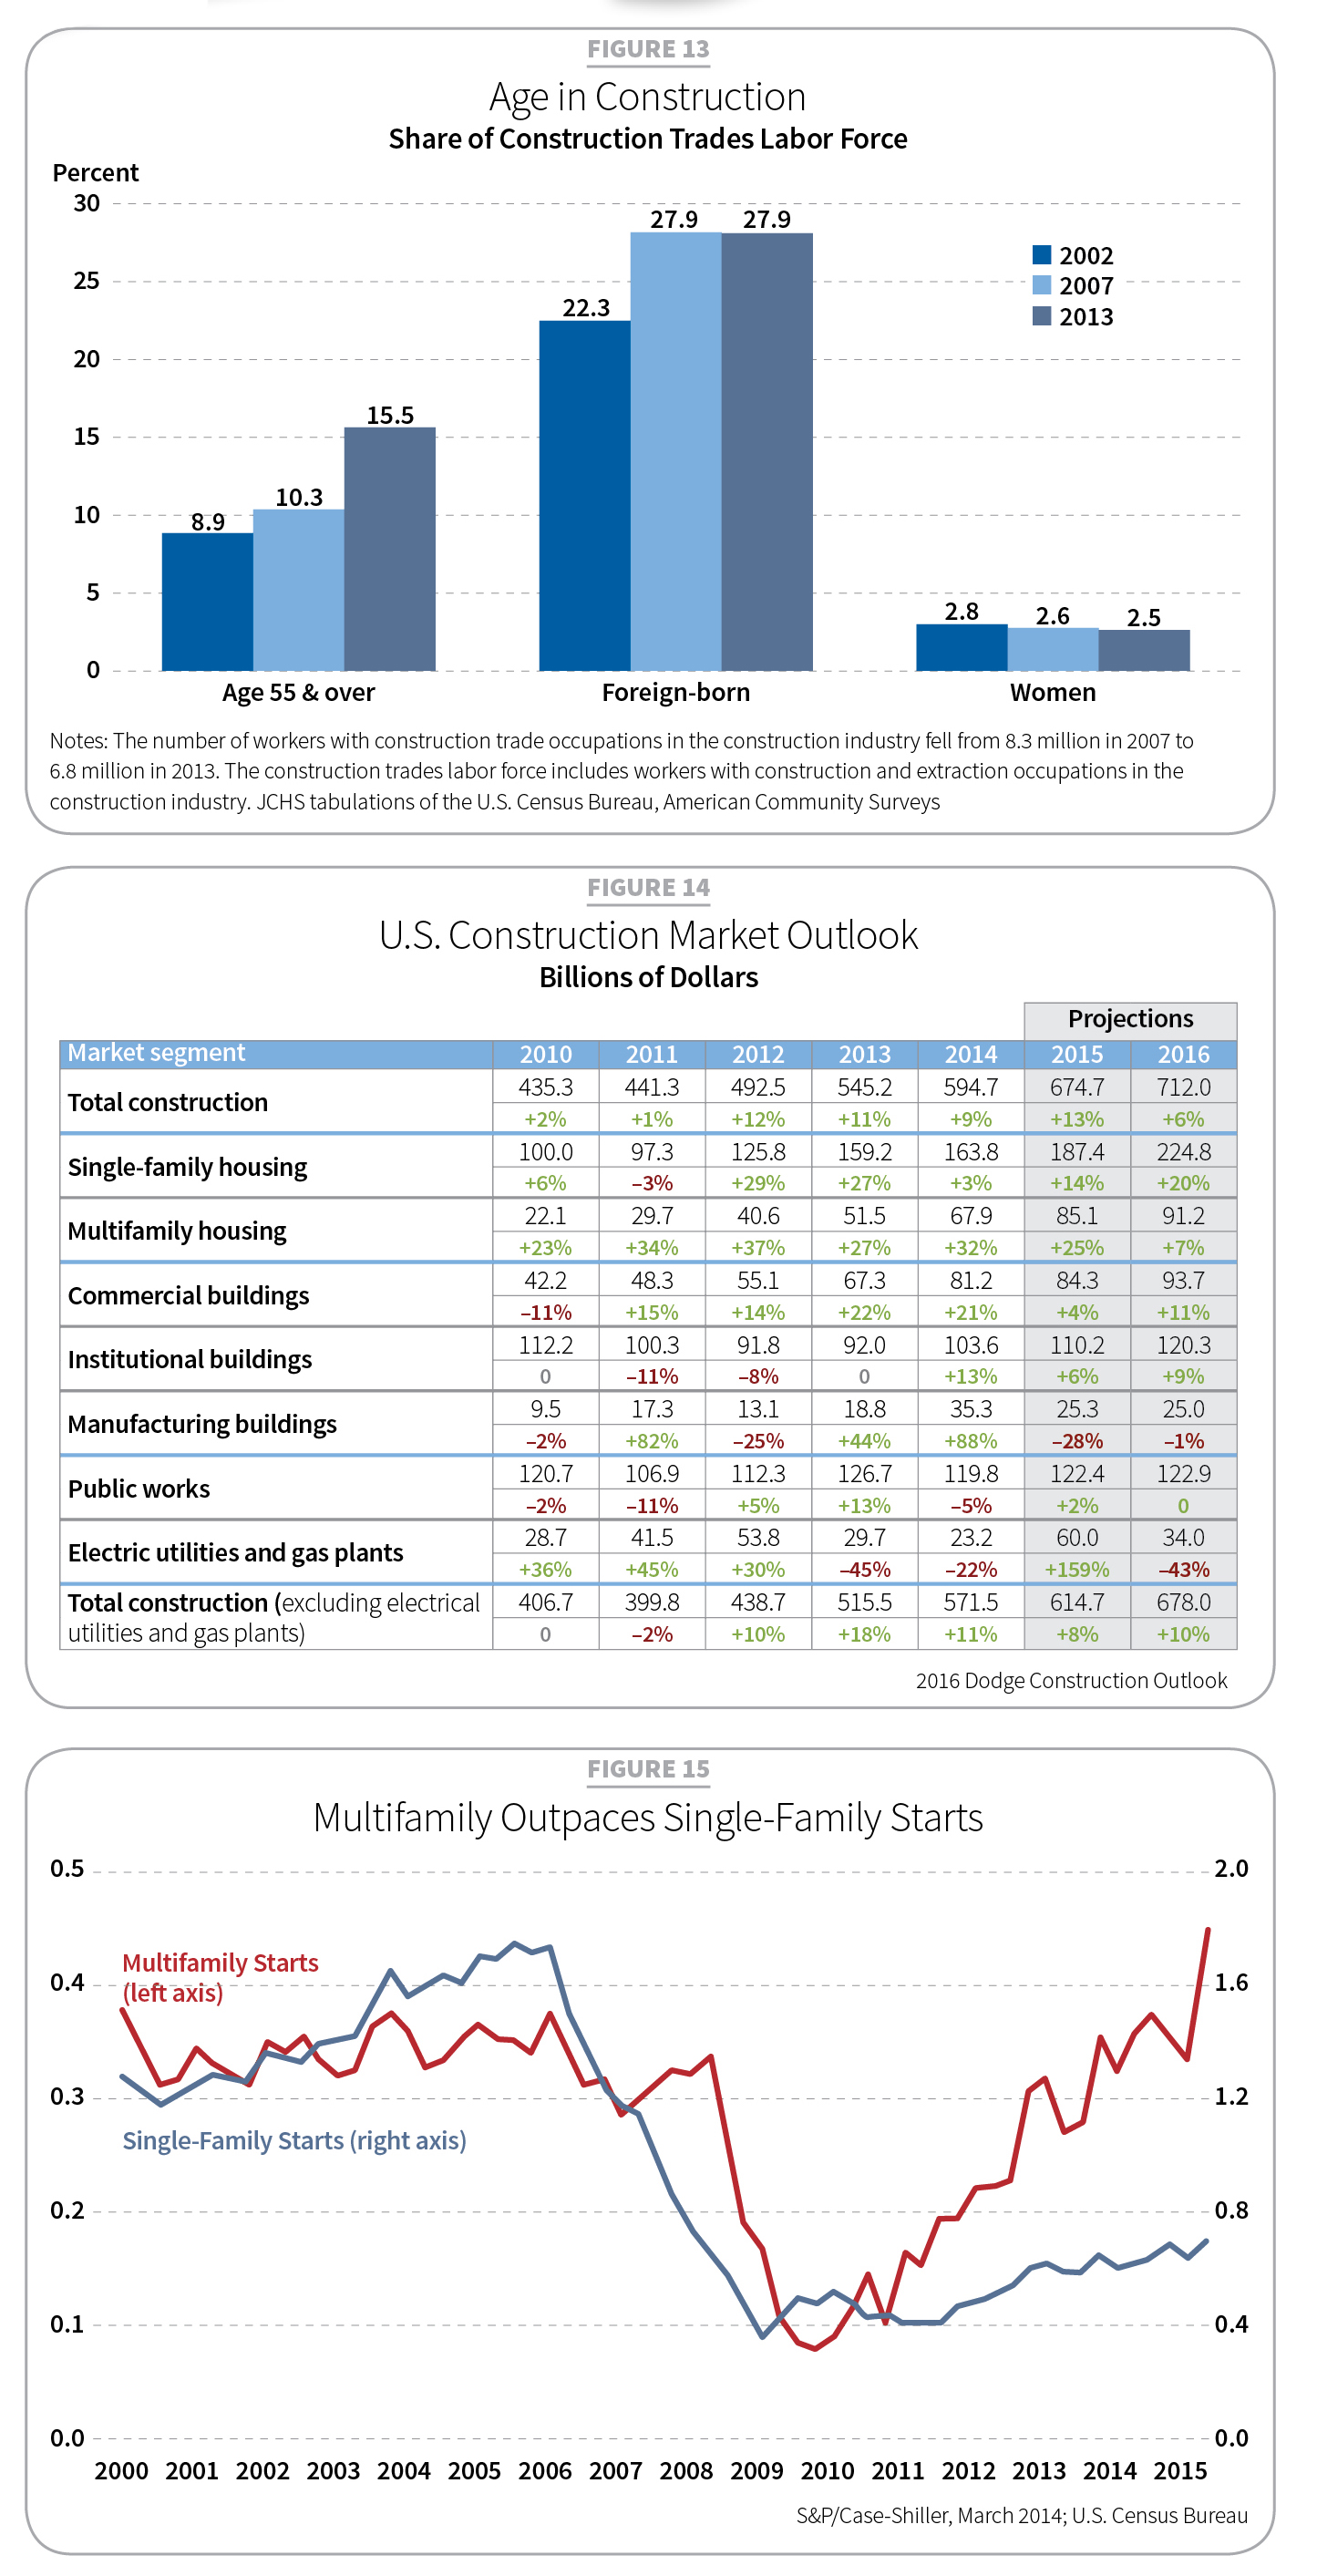
“Not a lot of quick answers to these issues,” he said. “Long-term strategies are needed. The construction workforce has gotten much older with ages 55-plus making up a growing share—double the number from 25 years ago [see Figure 13]. There are fewer immigrant workers [historically strong] and fewer women.”
PERFORMANCE AND FORECASTS
Unless otherwise noted, the following forecasts are derived from the 2016 Dodge Construction Outlook. Overall, most markets will see positive growth (see Figure 14).
Residential—Single-family steps up as multifamily matures
While there’s plenty of room for improvement, single-family housing continues to improve as it did in 2015. In 2016, expect single-family growth to compete more readily with multifamily (see Figure 15). Last year, total housing starts (single- and multifamily) rose 12 percent (1.145 million units). That was double the level from 2009. Such growth was also seen in 2014. This year, starts are expected to climb another 12 percent (1.285 million units).
Housing starts
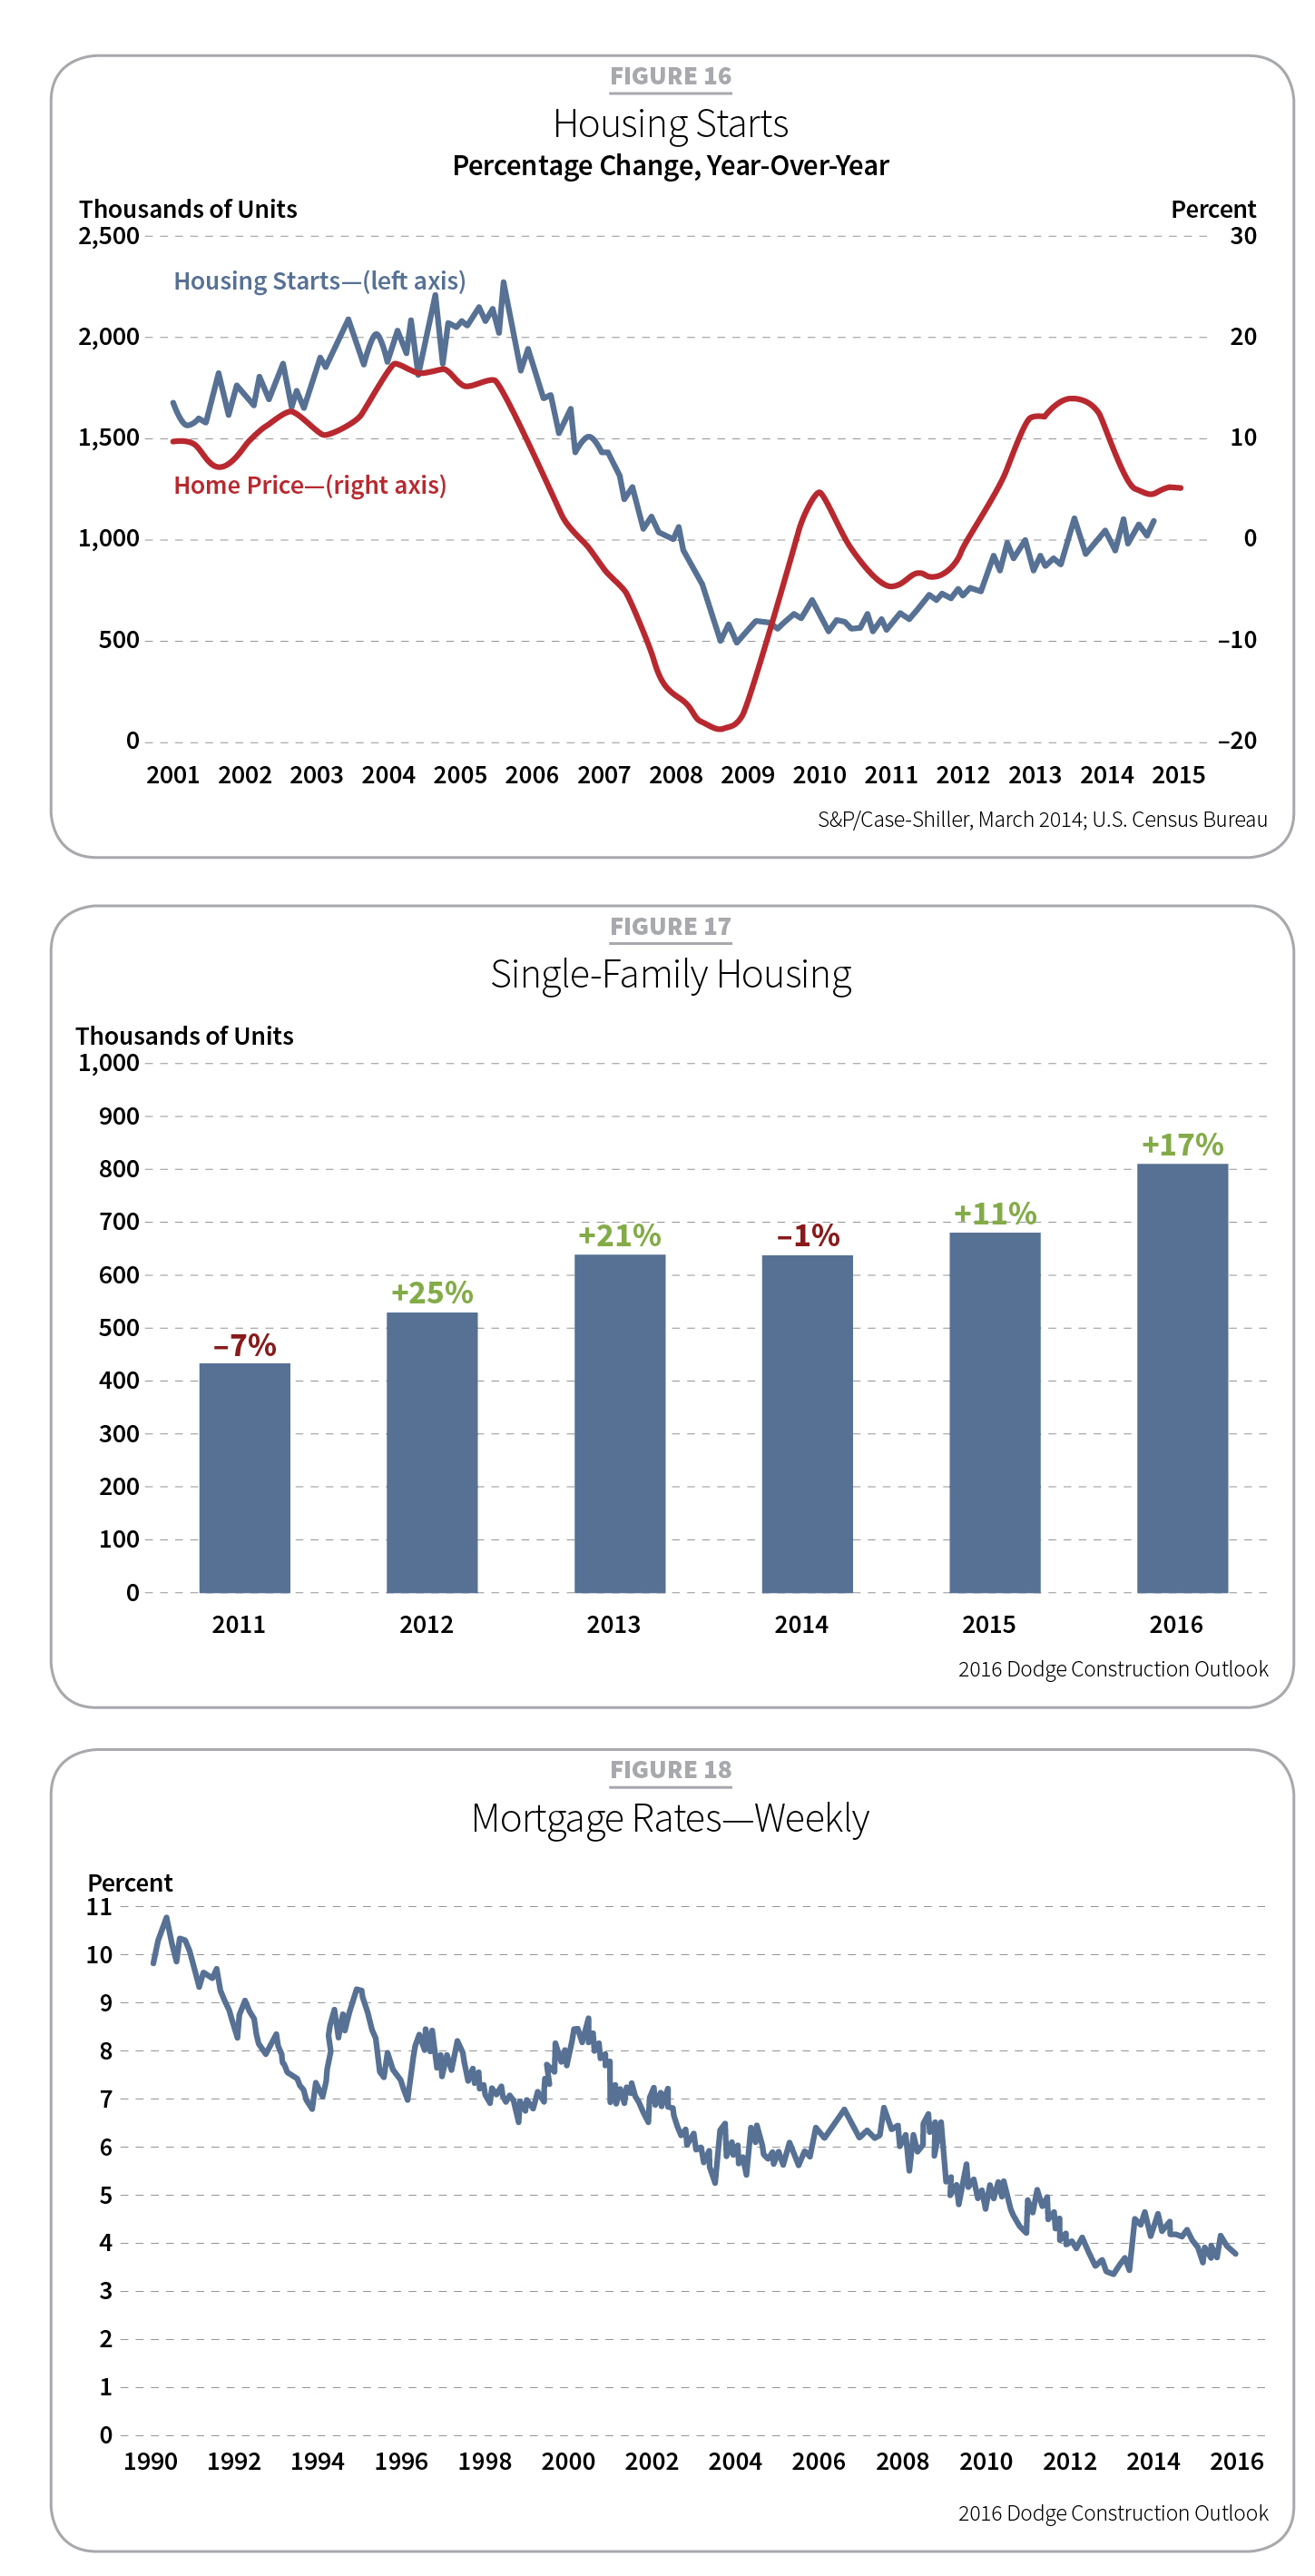
Housing starts in 2015 increased 11 percent (690,000 units) (see Figure 16). This year should see a climb of 17 percent (805,000), the highest number since 2007. The NAHB places 2015 numbers even higher (719,000 units), up 11 percent, and sees increases of 27 percent in 2016 (914,000 units). Starts have grown throughout the country. The NAHB also cited residential remodeling increasing 6.8 percent last year and growing 6.1 percent in 2016.
Single-family
Though single-family is climbing out of a deep hole (58 percent below 2005 numbers), the last two years and projections for 2016 show confidence (see Figure 17).
Healthy job growth in 2014–2015 contributed to the improvements in single-family housing. With more confidence in the economy comes less hesitation in home purchasing. Home prices have increased as well, though with some volatility. The S&P/Case-Shiller Home Price Index, which tracks 20 metro areas, revealed prices have increased for 39 consecutive months, which may push homeowners to act.
U.S. foreclosures (default, auction or bank-owned) continued to fall, standing at 906,809 properties in October 2015, a year-to-year reduction of 14 percent.
This year may see greater mortgage availability. In a Fed survey, many bank lenders signaled an easing of residential lending standards. The cost of financing remains low, too. The Federal Housing Administration (FHA), which backs 20 percent of all loan originations, lowered mortgage insurance premiums, relaxed credit standards and raised the cap on all FHA loans. Fannie Mae and Freddie Mac offered loans as low as 3 percent down. A 30-year fixed mortgage averaged 3.80 percent for the first nine months of 2015 and fell to 3.76 percent in October (see Figure 18).
Multifamily
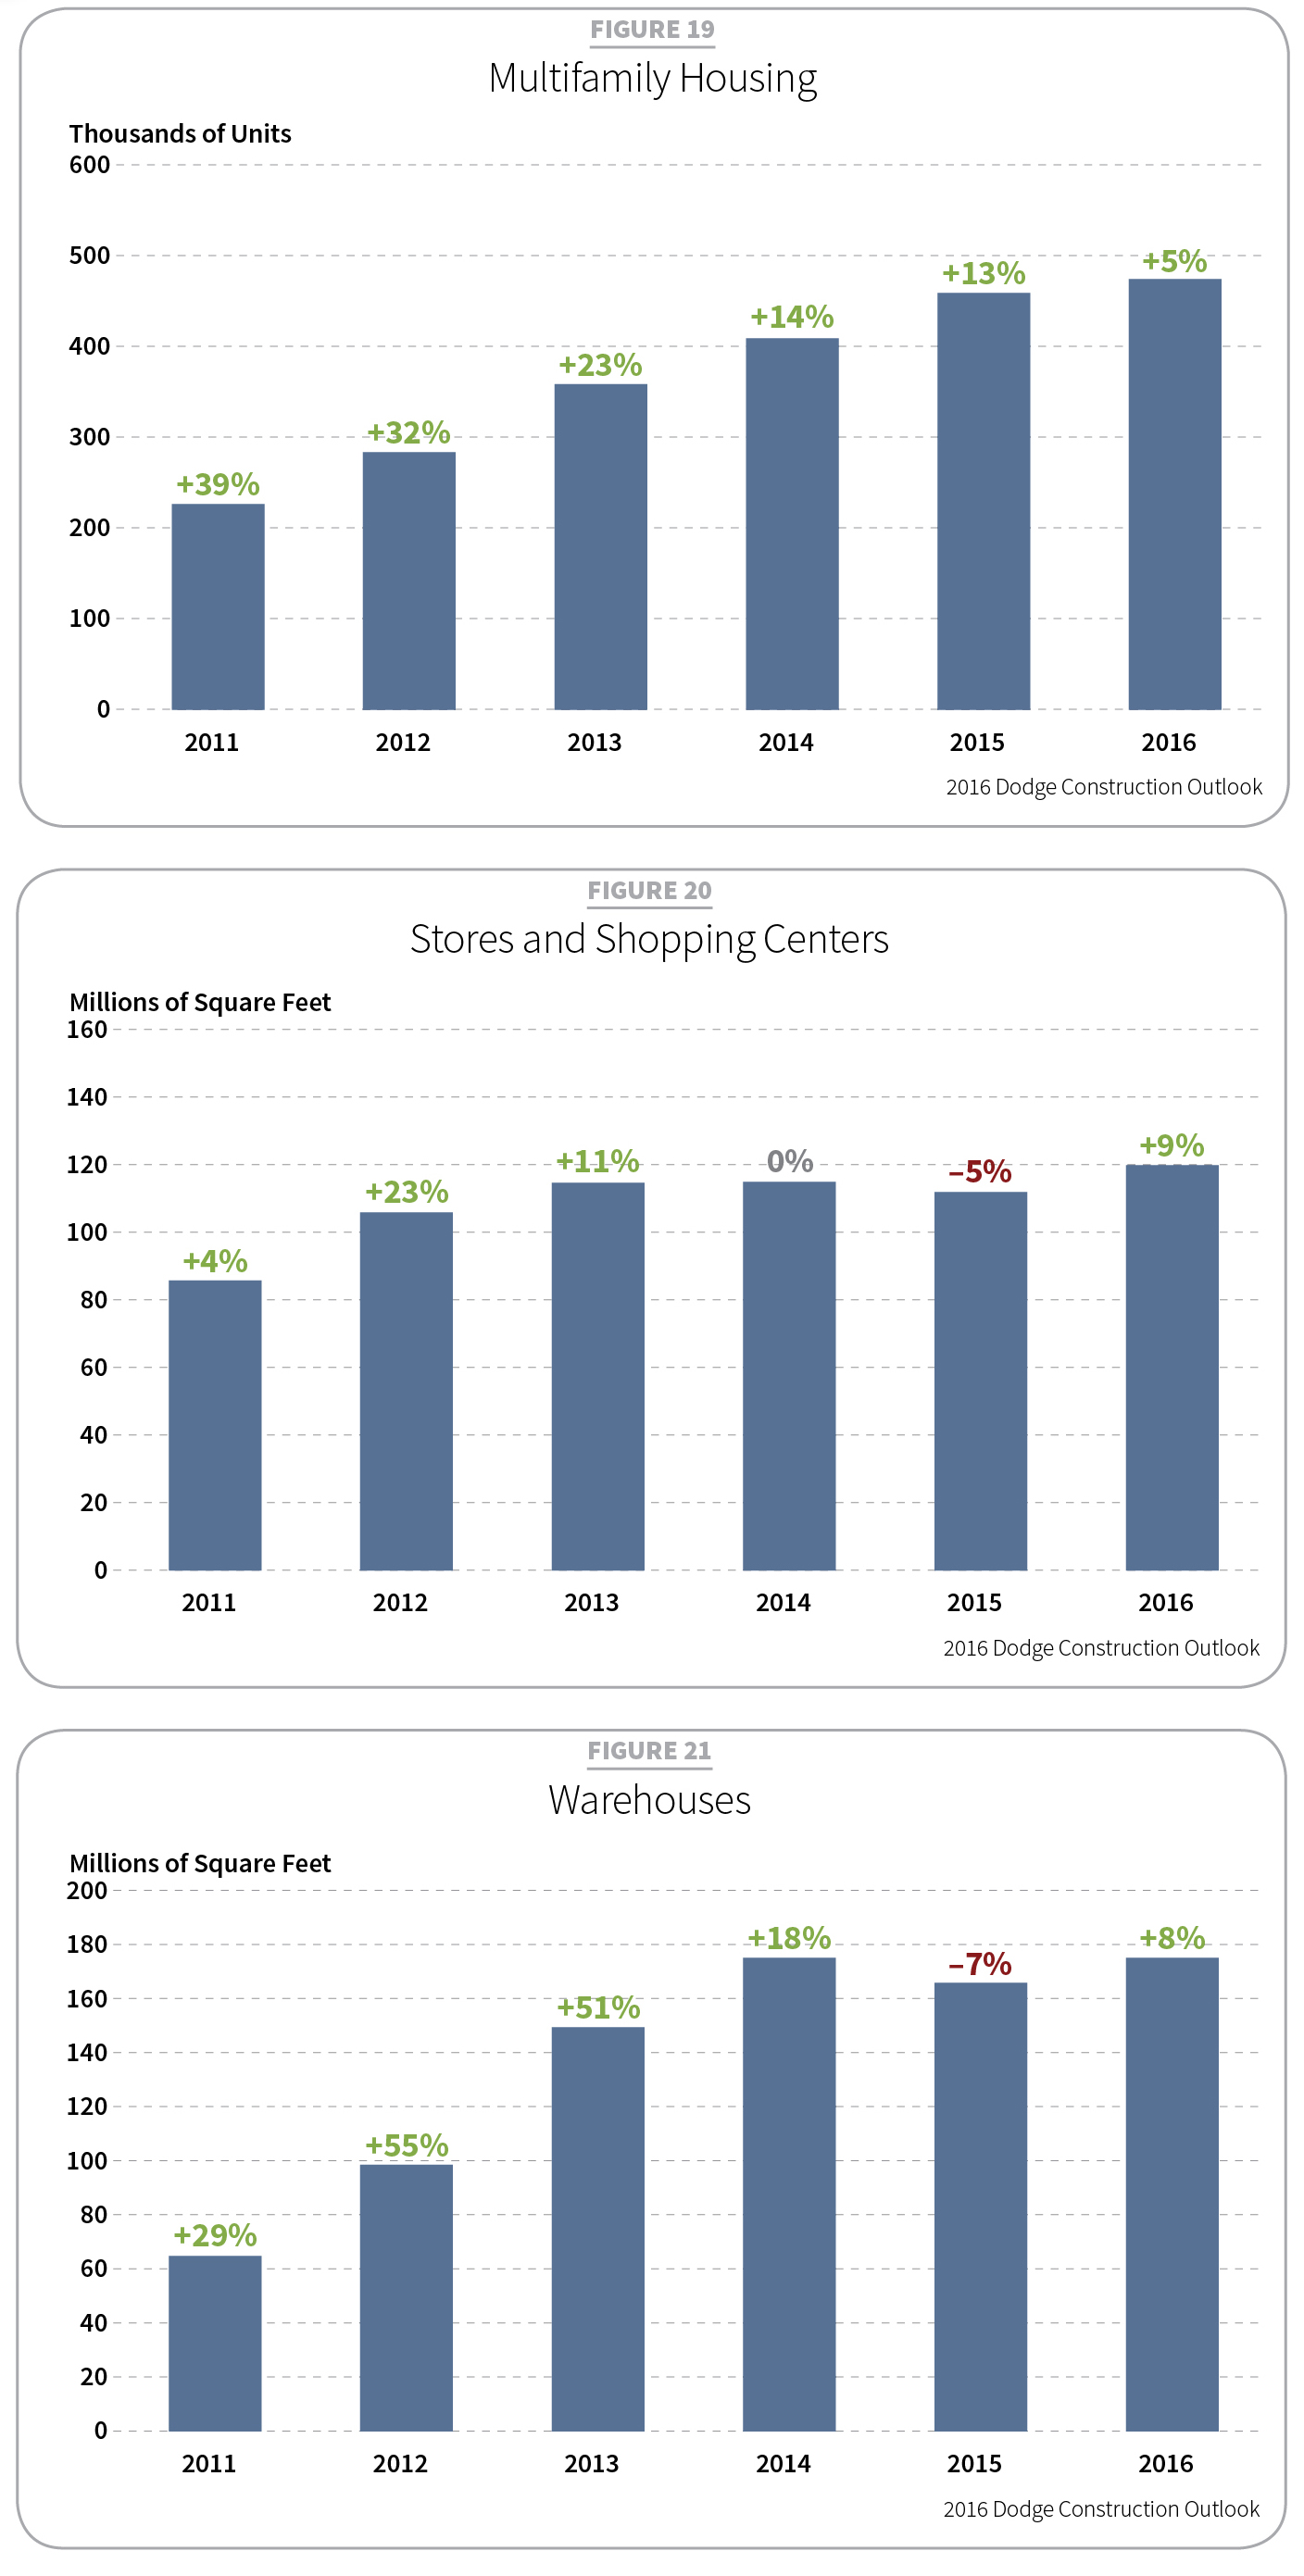
Multifamily housing remains a shining star. From 2010 to 2014, starts reflected double-digit growth from a low of 136,000 units in 2009 to 404,000 units in 2014. Starts in 2015 stand at 13 percent (455,000), up 13 percent from 2014 and the sixth straight year of growth (see Figure 19). Dollar values increased 25 percent ($85.1 billion) driven by large urban projects. In 2016, expect a rise of 5 percent (480,000 multifamily units), just 9 percent shy of construction numbers seen in 2005. After a seven-year expansion, economists see this market’s recovery reaching maturity.
Though moderating its growth, multifamily will continue to be driven by older millennials and others comfortable with renting. Renter households rose 2 million in 2015, one-third of which were under the age of 35. College debt, delaying marriage and children, more freedom to relocate, and simple costs have kept this demographic a generation of renters.
Dropping vacancy rates are indicative of multifamily housing’s continued strength, even though rents are rising. The Census Bureau reports, after a historic high of 12 percent in 2009, rates dropped to 6.8 percent in the second quarter of 2015, a level not seen since 1985.
The New York metropolitan area remains a star player for multifamily projects, though its dominance may weaken after 2016, once major developments play out. Still, projects were up 67 percent in 2015, including 15 valued at $300 million or more. The top two projects in 2015 were New York-based: 15 Hudson Yards (a $575 million mix of rental and condominiums and part of the $20 billion Hudson Yards development) and 1800 Park Avenue (a $563 million, 670-rental-unit project allocating 20 percent for affordable housing). The second phase of the Los Angeles-based, $530 million Metropolis, representing 1,249 condominiums, was the third largest multifamily project of 2015.
Commercial—Stalled but fundamentally strong
Commercial starts in 2013 grew 26 percent, expanded 8 percent the following year, but then retreated in 2015, increasing only 4 percent. That may rise as news broke of nonresidential starts unexpectedly spiking 32 percent ($200.7 billion) in October. In 2016, starts are projected to rise 9 percent.
Dodge economists are somewhat puzzled by the commercial sector’s erratic performance. Many fundamentals remain strong, including vacancy rates, property values and bank lending. Economists posit that 2015 numbers may not fully reveal market health because some approved large projects didn’t break as planned. As such, 2015’s 4 percent growth represented 585 million square feet (msf) and $84.3 billion. This year’s 9 percent advance (640 msf) represents an 11 percent ($93.7 billion) gain.
Retail
A slowdown in housing starts in 2015 negatively affected the retail sector. So did slower consumer spending and chains (e.g., McDonald’s, Office Depot/OfficeMax, Radio Shack and Walgreens) closing stores or announcing plans. Starts declined 5 percent (110 msf) (see Figure 20). Dollars, however, climbed 2 percent ($18.2 billion). Retail profits were also up $1.6 billion. October revisions may help brighten this picture as it showed a healthy 56 percent rise in retail construction.
Though Walmart represented the largest amount of chain construction (11.0 msf/$1.37 billion) in 2015, it contracted from 2014 (16.5 msf/$1.8 billion). Instead of more superstores, the chain has been pursuing its smaller Walmart Neighborhood Markets and new Express Stores. However, five retail projects broke ground in the first nine months of 2015, representing $1.2 billion. Some retail outlets, including grocers Aldi, Costco, Kroger and Whole Foods, also increased their space. Further, store renovation helped support this sector in 2015.
Expectations for 2016 retail construction include 9 percent growth (120 msf) and an added 10 percent in value ($20 billion).
The largest 2015 retail construction project was the $600 million portion of the Hudson Yards project on Manhattan’s West Side. The $210 million Ka Makana Ali’i Shopping Mall on Oahu was the second, followed by the $200 million South Street Seaport Pier project back in New York City.
Commercial warehouses
From 2011 to 2014, warehouse starts enjoyed year-to-year double-digit growth, cumulating in an impressive 258 percent increase (176 msf). E-commerce has largely driven this growth. In 2015, starts fell back 7 percent (163 msf) and 2 percent in dollars ($11.6 billion). The pullback is attributed to a decline in the construction of massive warehouses. On the plus side, CB Richard Ellis Econometric Advisors (CBRE-EA) reported vacancy rates fell 9.6 percent in the third quarter of 2015. Drops have been underway for five years. Starts in 2016 will show a small bounce reaching 8 percent (177 msf) and 10 percent in dollars ($12.8 billion) (see Figure 21).
The two biggest projects in 2015 included the 1.2 msf Trade Center 83 distribution facility in Manchester, Pa., and the 1.1 msf Alliance California Gateway South warehouse in San Bernardino, Calif.
Offices
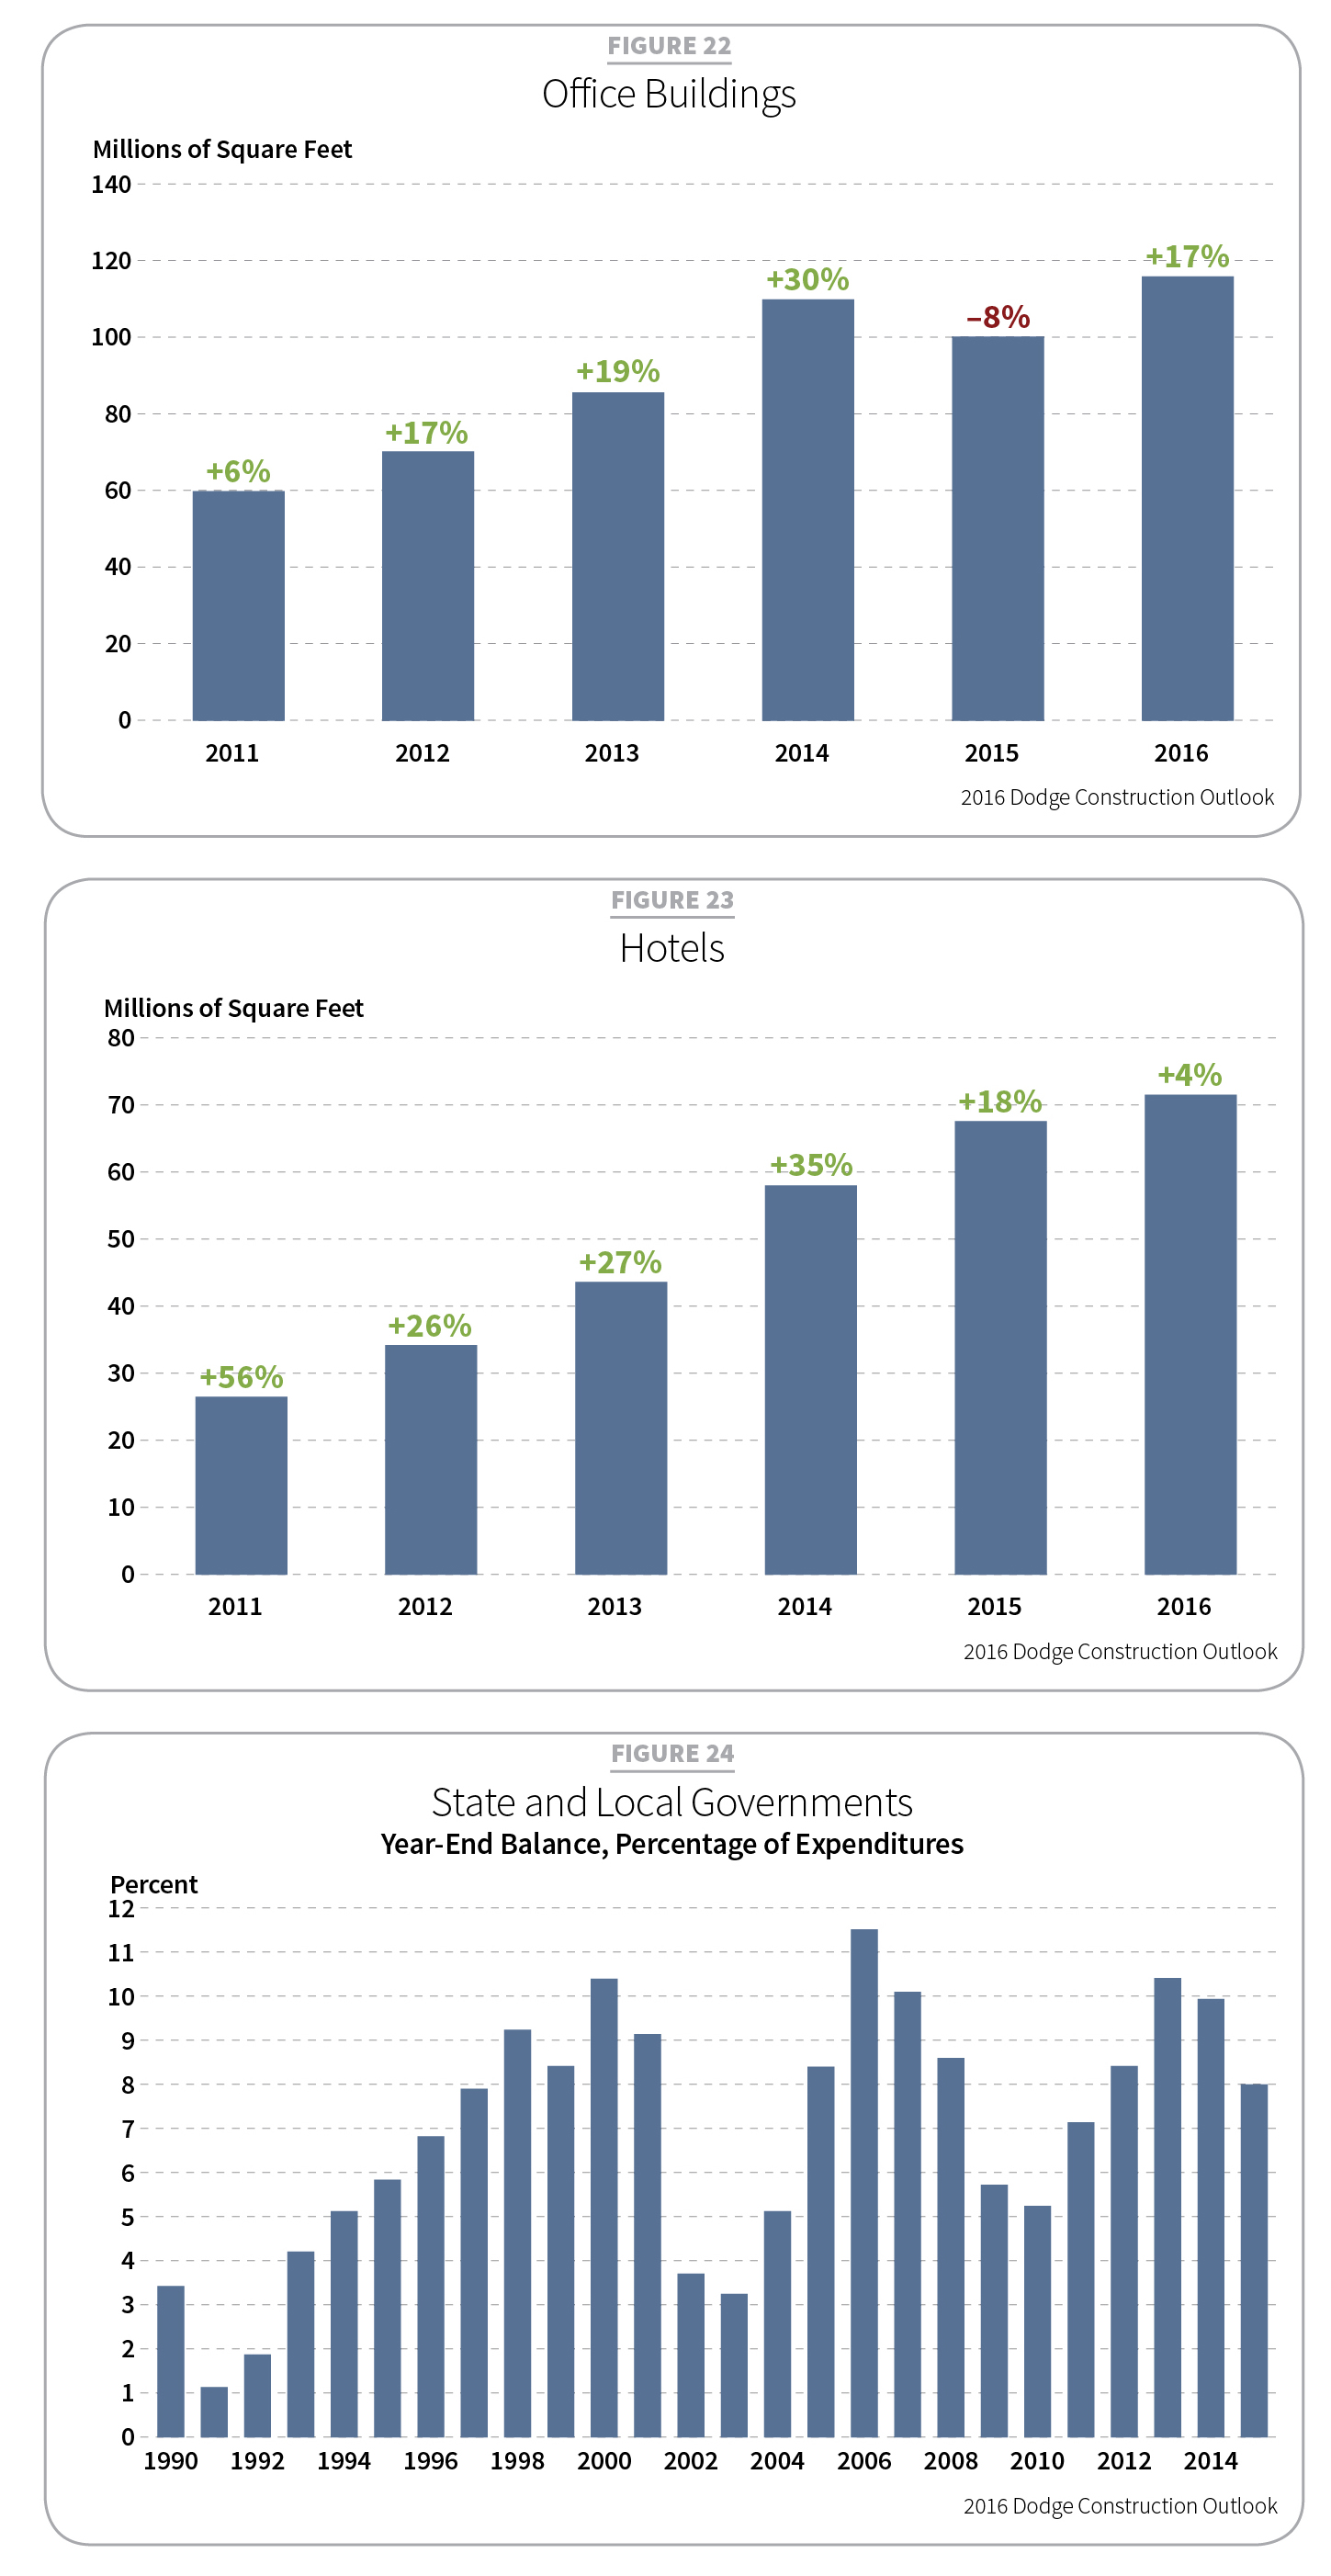
After a 2010 nadir, office starts rebounded 91 percent in 2014 (109 msf), though they still remained 50 percent below prerecession starts in 2007. Last year’s gains dropped 8 percent (100 msf), though they still represented healthy growth with the addition of a 1 percent dollar uptick ($29.1 billion). In 2016, expect a 17 percent increase (117 msf) and a 14 percent rise ($33.3 billion) (see Figure 22).
With its data centers, the tech industry has dominated office growth in recent times. Two large centers broke ground in 2015 for SUPERNAP and Google. Amazon.com, Apple, Facebook, Microsoft and Yahoo are all big players. Corporate head office growth continued in 2015. Nike began a 1.3 msf, $235 million expansion in Beaverton, Ore. Capital One expanded its Fairfax, Va., headquarters, adding 941,000 square feet at a cost of $280 million. Toyota began building a new 1.5 msf head office in Plano, Texas.
According to CBRE-EA, vacancy rates fell to 13.4 percent during the third quarter of 2015 in downtown and suburban markets. Vacancy rates haven’t fallen to this level since the mid-2008. Also, 807,000 new office jobs were created last year, accounting for nearly 29 percent of all nonfarm jobs.
Hotels
Hitting bottom in 2010, hotel construction rebounded 240 percent (58 msf) through 2014. In the first nine months of 2015, starts rose another 13 percent with value gains of 17 percent. By year’s end, growth should stand at 18 percent (6 msf) and 22 percent in dollars ($13.9 billion). Growth in 2016 is forecast at 4 percent (71 msf) and 6 percent ($14.7 billion) as business and leisure travel is projected to sustain this sector’s moderated momentum. This slower growth is indicative of another maturing market after five years of consecutive gains (see Figure 23).
Eleven projects (at least $100 million each) broke ground in the first nine months of 2015. They represented a total of $2.1 billion, an increase of 47 percent from 2014. In dollar value, the year’s largest project was the $400 million expansion of the Westin Ka’anapali Ocean Resort Villas in Lahaina, Hawaii. The $342 million Resorts World Hotel in Las Vegas was second.
Institutional—A new day takes shape
Last year saw the continued return of public-sector financing. Nearly two-thirds of financing comes from federal, state and local governments (see Figure 24). In a recovery begun in 2014, institutional building pulled positive in 2015 for the first time in seven years. In 2014, starts grew 7 percent (305 msf) and 13 percent in dollars ($104 billion). Last year, starts grew an additional 2 percent (312 msf) and 6 percent ($110 billion). In 2016, positives will reach 8 percent (327 msf) and advance 9 percent ($120 billion).
Education
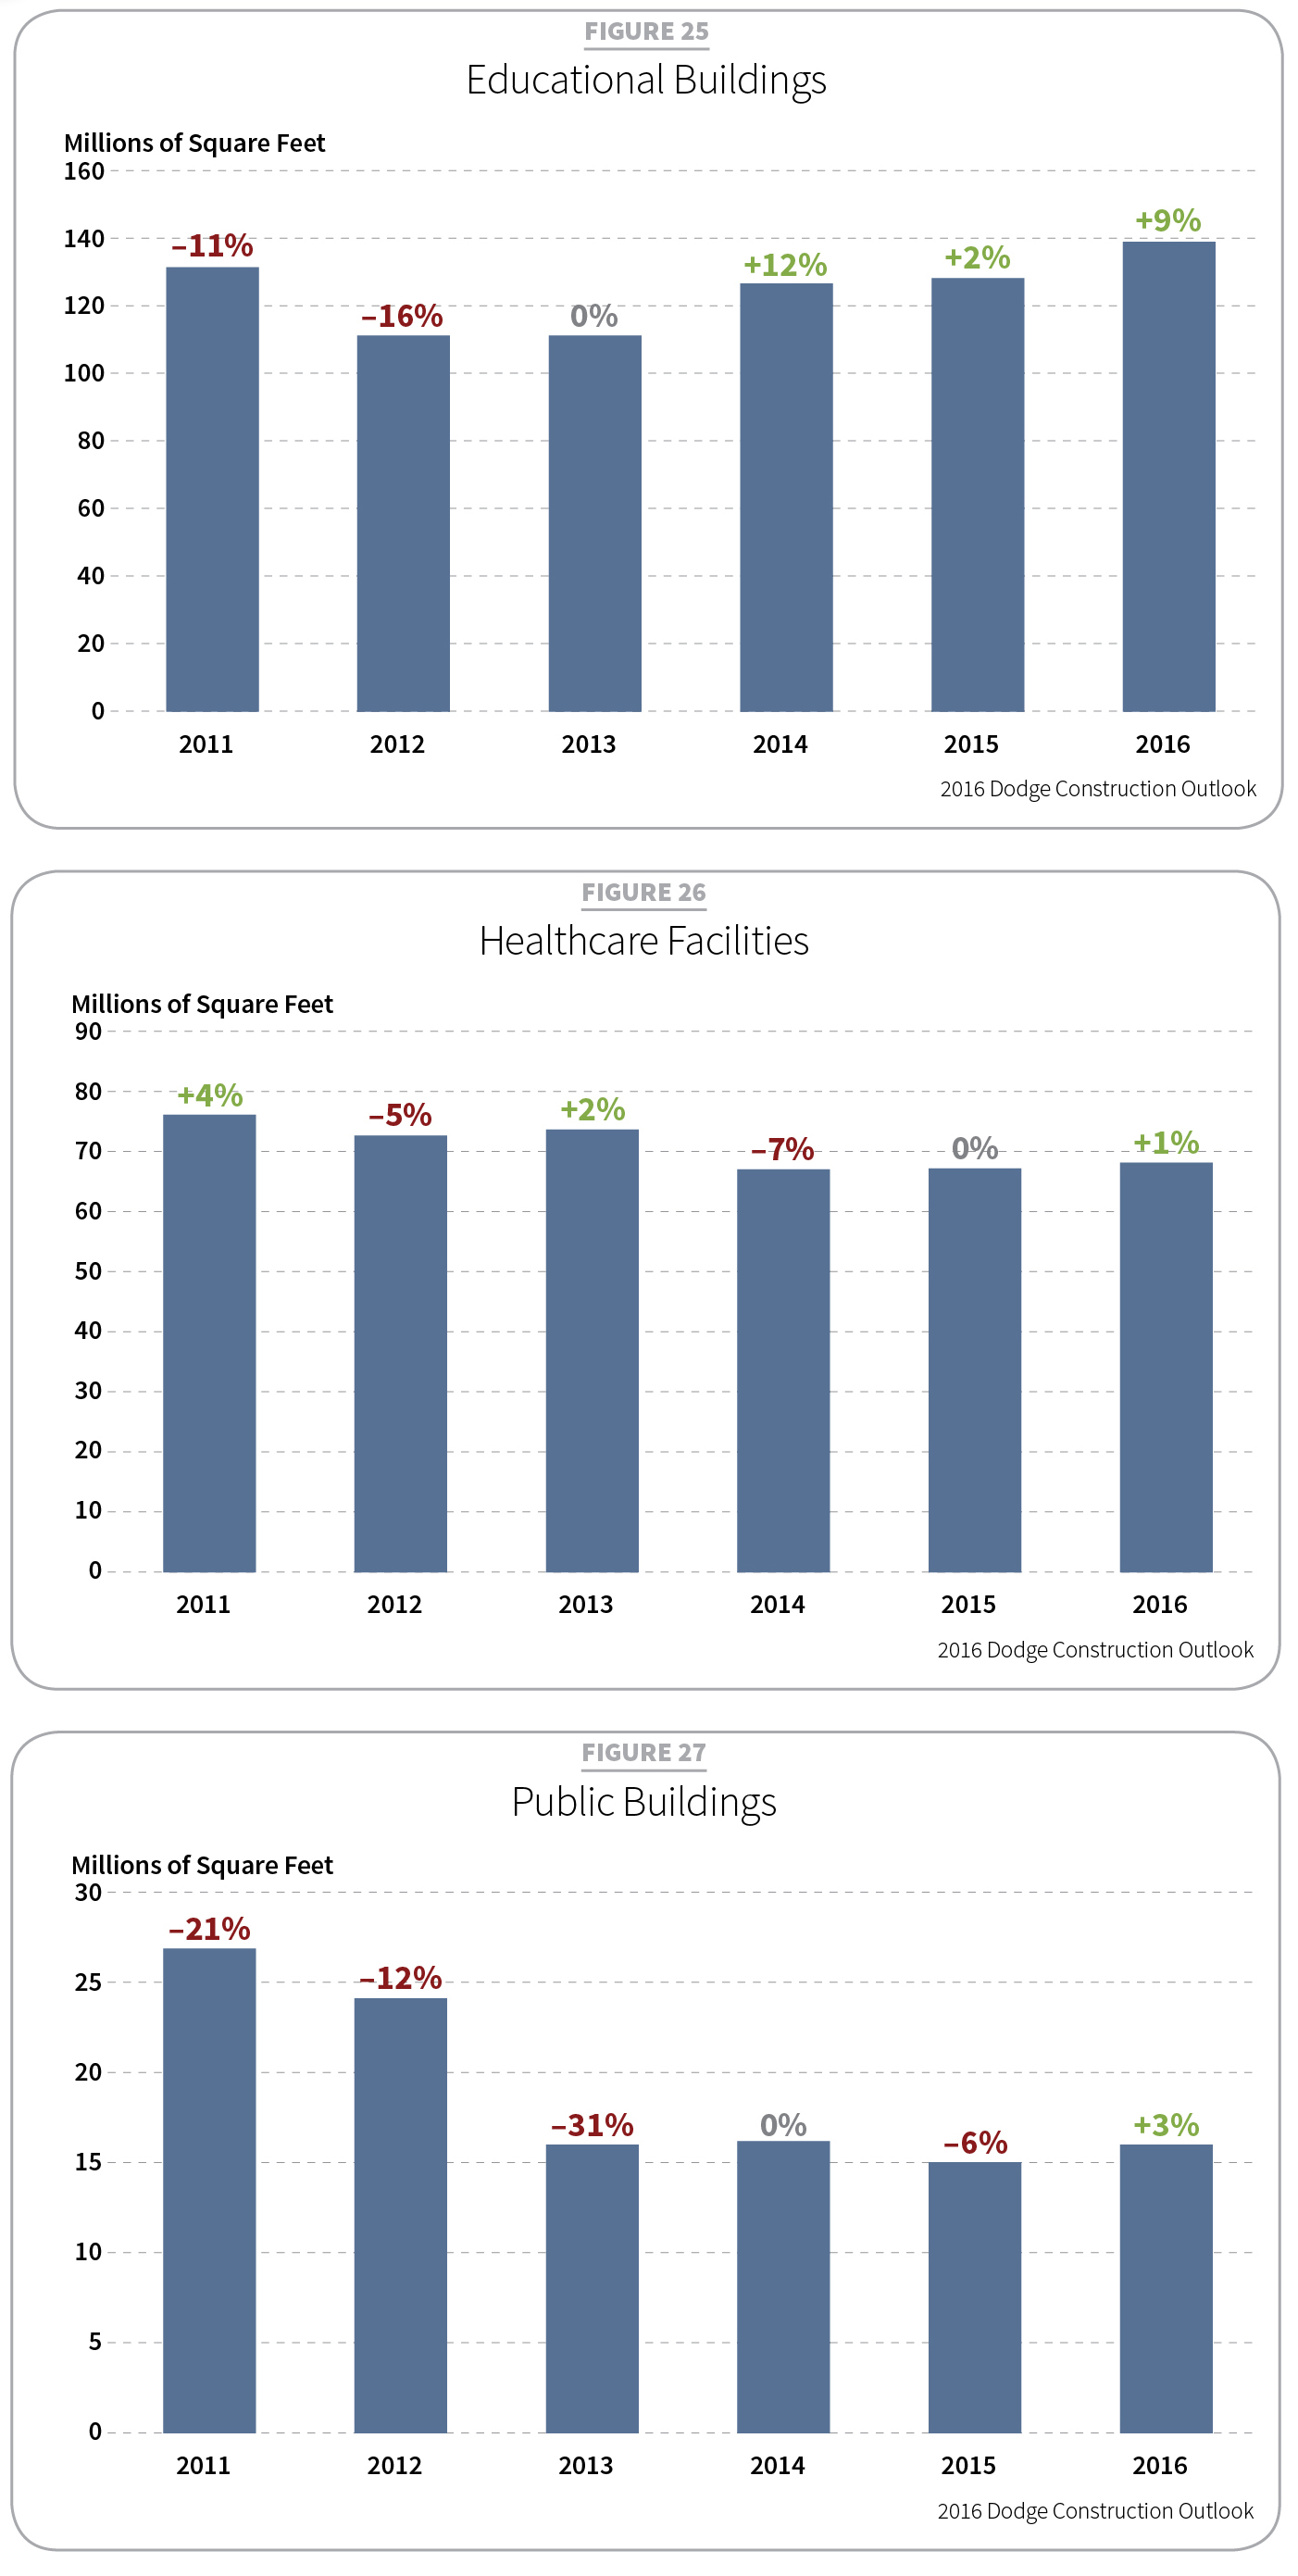
When the effects of the recession really hit in 2009, public financing dropped off. Steep declines in educational building starts continued through 2013, an especially rough year. At that time, starts were 59 percent lower from 2001’s peak. Flat school enrollment also played a role. In 2014, a rebound began as starts rose 12 percent. Last year, they rose 2 percent (127 msf) and 8 percent in dollar value ($47.8 billion). This year, expect increases of 9 percent (138 msf) and 10 percent in dollar value ($52.4 billion) (see Figure 25).
According to the National Center for Education, enrollments will see some growth after 2016 based on higher birthrates among older millennials. K–12 school construction came back 3 percent in 2015. Projections from the National Center for Education Statistics see K–12 enrollments growing by 2.9 million (5.3 percent) over the next decade and reaching 57.9 million by 2024. The increase mostly will affect elementary and middle schools. Correspondingly, grades 9–12 will advance by 271,000 (1.7 percent). An estimated 2.9 million students in the coming decade will register for colleges and universities, growing enrollment by 14.2 percent. Higher enrollments will influence construction beyond 2016.
In higher education, construction starts for four-year colleges dropped 17 percent in square footage. However, community colleges grew 6 percent. Though strong in 2014, college laboratory and research and development building starts fell 24 percent. Library starts fell 4 percent and vocational schools dropped 27 percent. Museums were up an impressive 64 percent. Noteworthy projects included the $345 million development of to the Museum of the Bible in Washington, D.C., and the $300 million Academy Museum of Motion Picture Arts and Sciences in Los Angeles.
Thanks to rising revenues and improved financials, voter confidence in local projects helped pass a number of bond measures in 2015. The largest was a $498.1 million bond package in the Kline Independent School District in Texas. A $415 million bond passed in Tulsa, Okla., as did a $410 million package for Spokane, Wash., and surrounding communities. A number of measures passed in California last November totaling nearly $1.5 billion. That same month, Dallas voters approved a $1.6 billion school bond package.
Hospitals/healthcare
Ongoing hesitancy continues to rule the day in healthcare construction. The Affordable Care Act (ACA) is one continuing headwind. Perhaps the industry is awaiting some clarity on what types of construction will be most needed. Eighteen $100+ million projects broke ground in 2015, largely mirroring 2014 (17). Total starts remained flat (68 msf), but dollars rose 2 percent ($23.3 billion). Market conditions should improve slightly in 2016 as private financing becomes more readily available and the ACA has another year under its belt. Expect a 1 percent gain (69 msf) and 4 percent rise in dollar value ($24.3 billion) (see Figure 26).
The big projects for 2015 included the $750 million Memorial Sloan Kettering Cancer Center in New York and the $540 million Methodist Hospital North Campus Tower in Houston.
Public and religious
Construction of capitols, courthouses, police, fire, detention and other public facilities continued their decline in 2015 for an eighth consecutive year. In 2014, dollar values climbed 15 percent, but in 2015, momentum slid back as square footage starts fell to 15.4 msf. A modest 3 percent increase (15.9 msf) and growth of 6 percent in dollars ($8.1 billion) is expected this year (see Figure 27). Five projects valued at $100 million or more broke ground in 2015. The top two included the $275 million East County Detention Center in Indio, Calif., and the $221 million Wyoming Capitol Square in Cheyenne.
A decline in church membership and religious service attendance has weighed heavily on religious building construction over the past 13 years. Things didn’t get much better in 2015. Starts slid 5 percent (9.3 msf), though dollars grew 5 percent ($1.8 billion). A 5.6 percent rise in donations ($482 billion) has helped this sector. In 2016, expect a 3 percent gain (9.6 msf) and 5 percent added dollar value ($1.9 billion).
Amusement and recreation
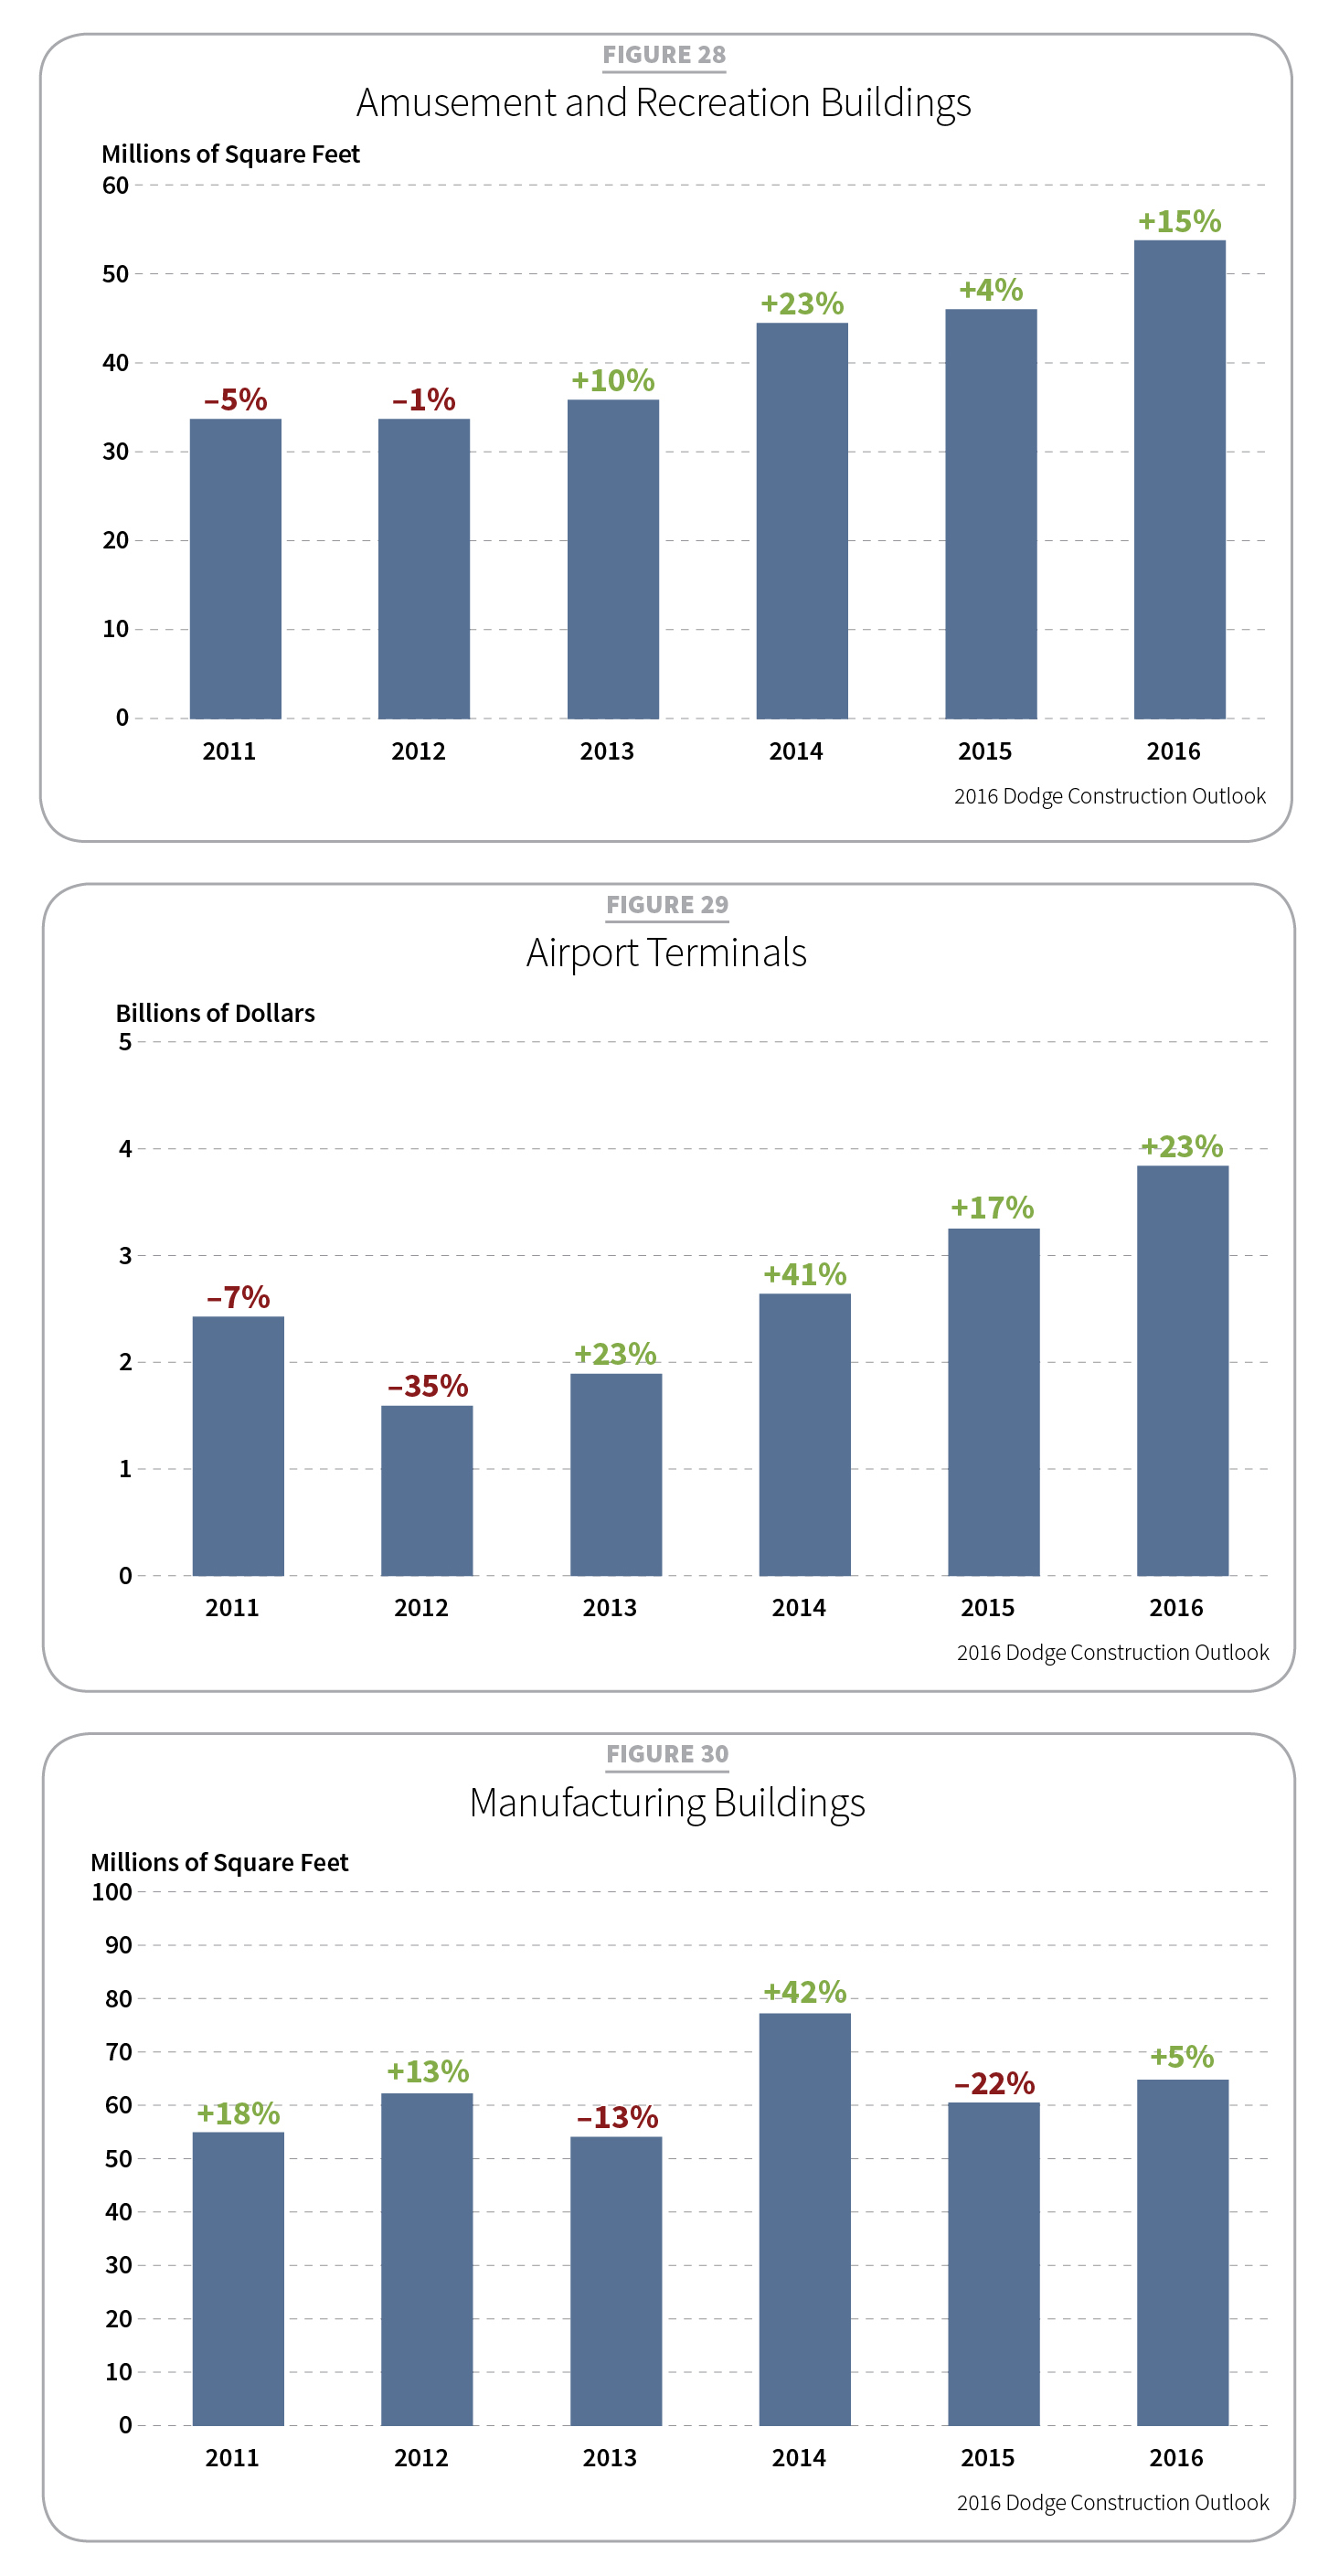
Showing growth over the past two years, amusement and recreation construction starts grew at a slower rate in 2015, showing 4 percent growth (45.9 msf) and dollar value gains of 5 percent ($14.3 billion) (see Figure 28). A number of larger projects were conversely smaller in size than those in 2014. This year’s starts are expected to advance 15 percent (52.7 msf) and 16 percent ($16.5 billion). Noteworthy 2015 projects included the $650 million MGM resort in Springfield, Mass., and the $500 million renovation and expansion of the Miami Beach Convention Center.
Transportation
The transportation sector had a mixed year in 2015. Some subsectors declined while others advanced, notably airline and freight terminals. Starts were expected to end the year up 5 percent (21.2 msf) with a 14 percent increase in dollar value ($8.7 billion). Airport terminal starts in 2015 are projected to grow 17 percent in dollars (24.8 msf). Numbers are predicated on the start of the $4 billion “master plan” for LaGuardia Airport in New York (see Figure 29).
Public-private partnerships may also help. Larger 2015 projects included $405 million in renovations for Grand Central Station in New York and the $403 million automated people-mover complex at Orlando International Airport.
Manufacturing—holding its ground
Last year showed a pullback for plant construction from 2014. The previous two years were hard acts to follow, featuring $3 billion Gulf Coast petrochemical plant projects by the likes of Chevron Phillips and Exxon. These represented two of 34 manufacturing factory projects valued at $100 million or more, including the $2.5 billion Tesla Motors Gigafactory battery plant in Nevada. Plant starts soared 42 percent in 2014 (77 msf), raising dollar values a staggering 88 percent ($35.3 billion) (see Figure 30).
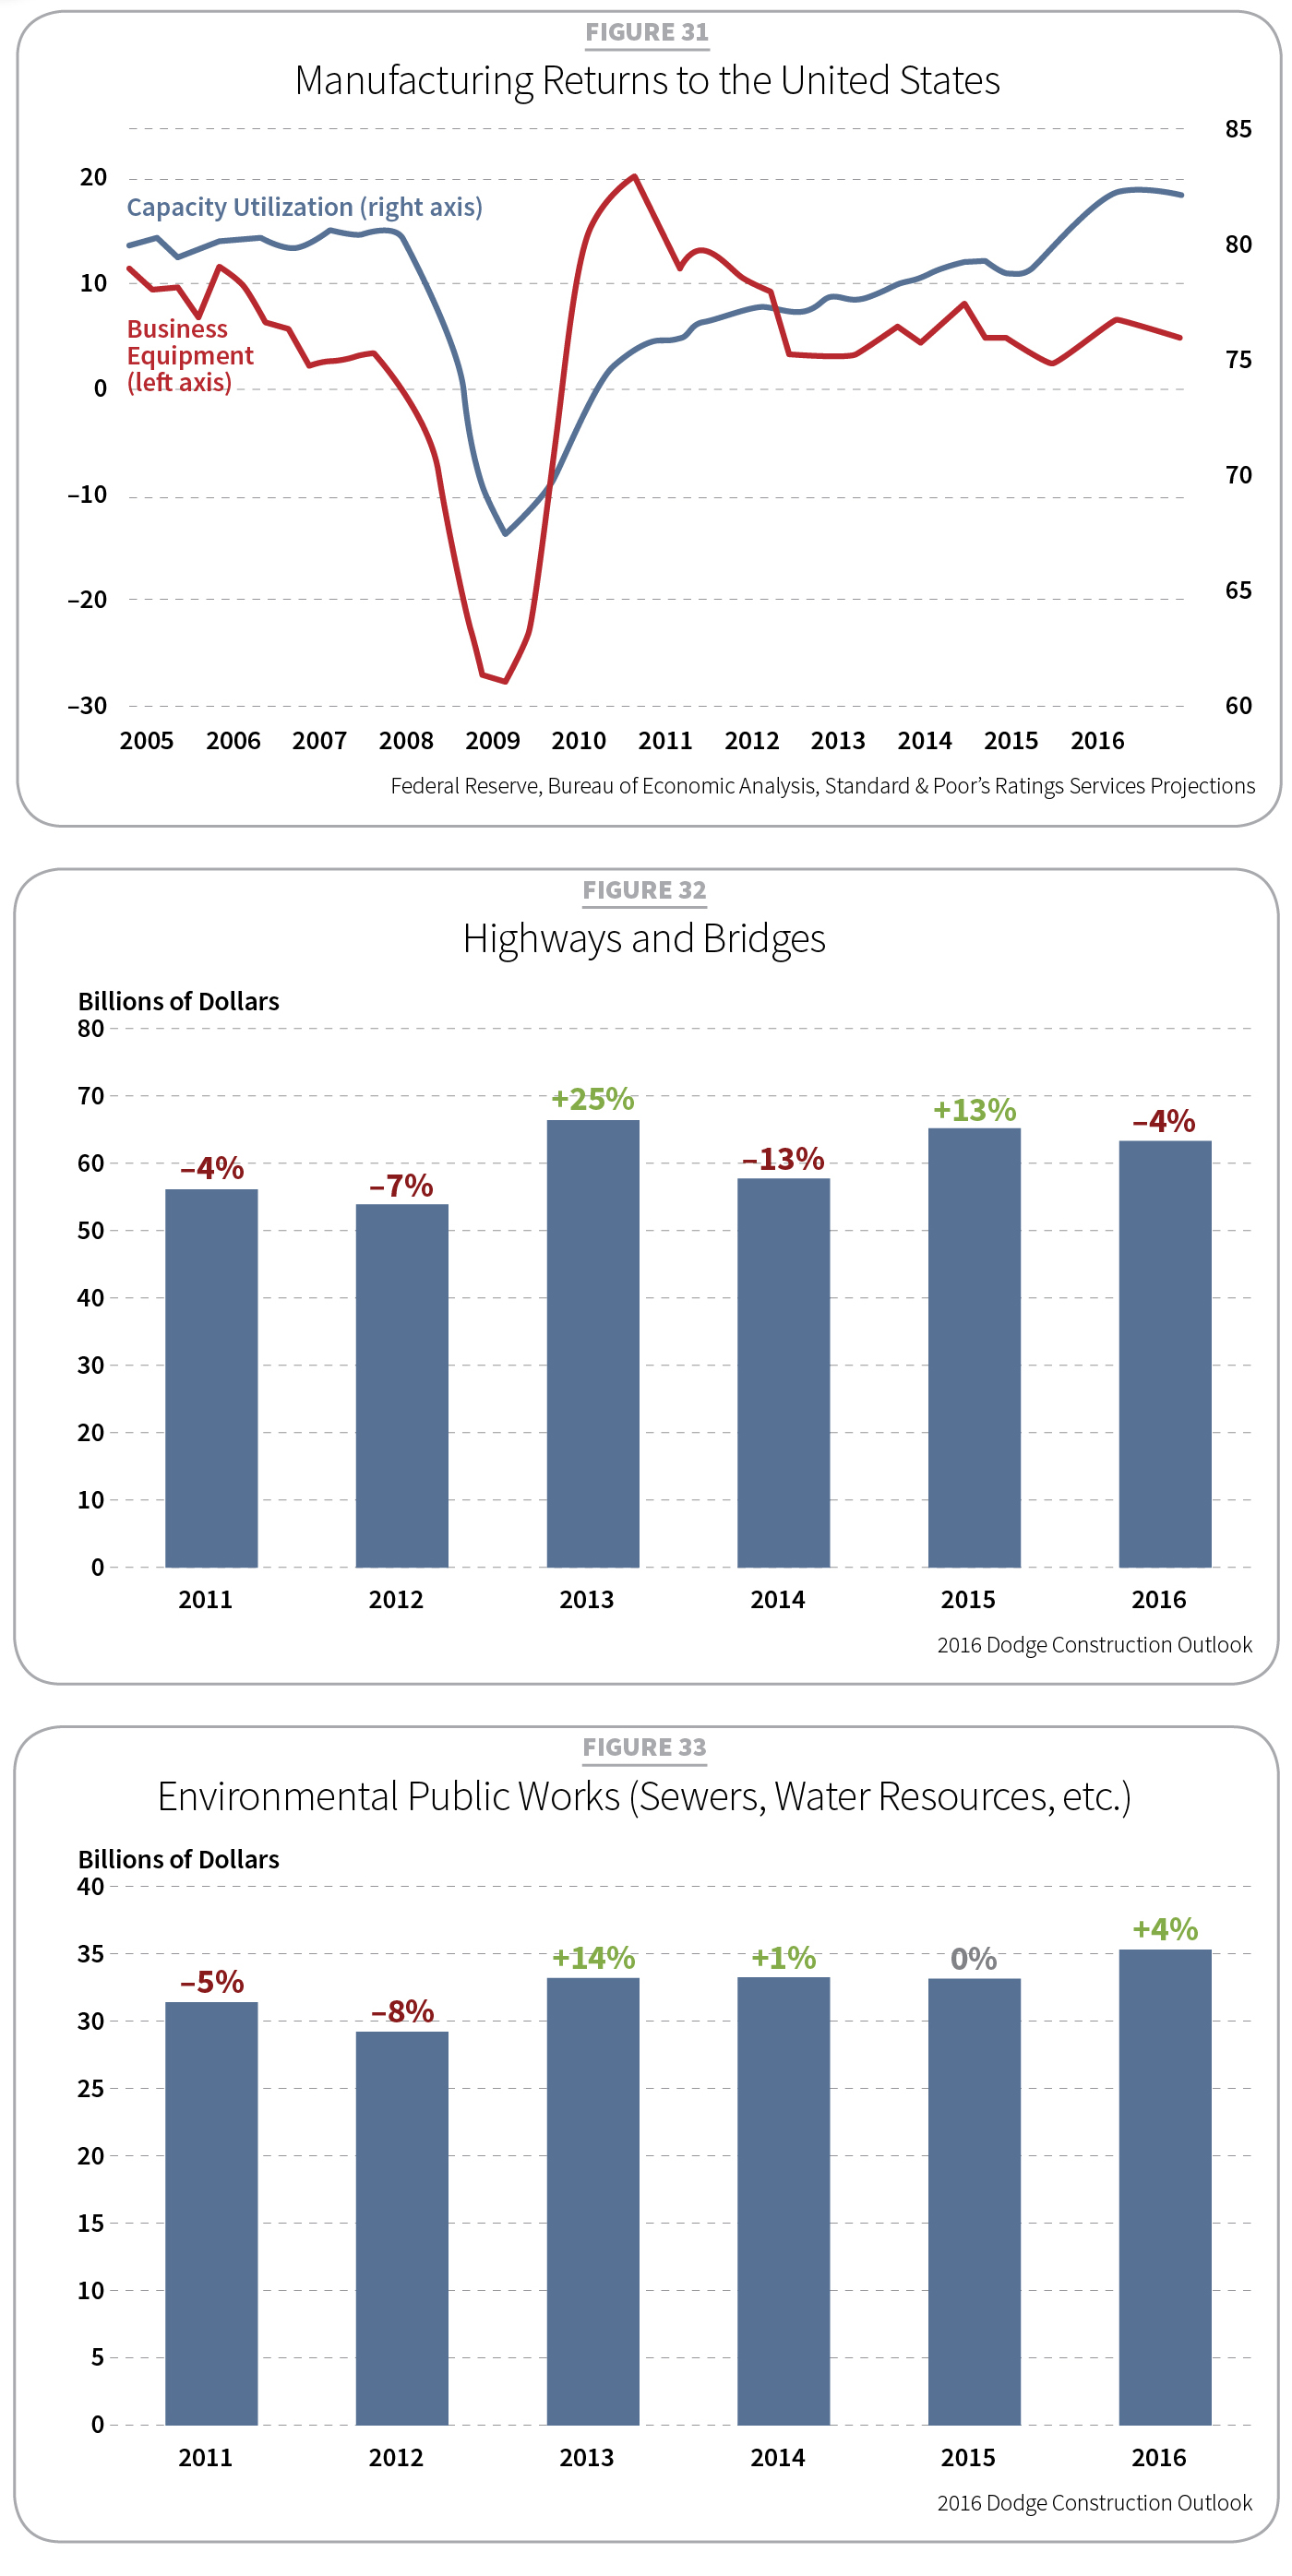
Set against a steep drop in oil prices and a trade imbalance, 2015 saw a 22 percent decline over 2014 in plant construction (60 msf) and a 28 percent slide in dollars ($25.3 billion). Both economic factors are expected to stabilize this year. Capacity utilization also saw a small decline, dropping to 76.6 percent in September. Projections for 2016 show a 5 percent rise (63 msf) and a 1 percent contraction in dollars.
Noteworthy projects in 2015 included the $8.1 billion Sasol ethylene cracker and derivative complex in Louisiana and the $3.0 billion Formosa ethane cracker and propane dehydrogenation plant in Texas. Other major manufacturing construction included a $384 million tire plant in Tennessee and a $300 million ammonia production plant in Wyoming.
In other good news, since the economic downturn, more products now bear the “made in the USA” trademark as manufacturing has returned to the United States (see Figure 31).
Public works and electric utilities—unsustainable rebounds
In 2015, public works projects strengthened while electric and gas utility work broke out in a big way. Starting with public works, the first half of 2015 saw a number of large highway and bridge projects begin. A 2014 decline in dollars (5 percent) reversed into a modest gain (2 percent) representing $122.4 billion. This year, it will settle in at $122 billion. Meanwhile, construction starts for electric utilities and gas plants soared in 2015 (159 percent) resting at $60 billion. That victory will not be sustainable, falling 43 percent to $34 billion in 2016.
Highways and bridges
In December 2015, the House and Senate agreed to a five-year, $305 billion reauthorization of the Highway Trust Fund, which is meant to address the nation’s aging and congested surface transportation systems. With the multiyear surface transportation bill details finalized, 2016 could be a good year. Highway and bridge construction experienced a strong 2013, a retreat in 2014 and a modest rebound in 2015 with starts advancing 13 percent ($65.5 billion) (see Figure 32).
Big project starts in 2015 included the $2.3 billion Interstate 4 upgrade in central Florida and the $550 million Border Highway West project outside El Paso, Texas. Expect a contraction of 4 percent in 2016.
Environmental
Last year, environmental public works projects remained flat ($33.7 billion), holding to 2014 progress. This year should see a 4 percent increase ($35.1 billion) (see Figure 33).
The $215 million Tunnel Dewatering Pump Station in Washington, D.C., was the largest start of its type in 2015. A $134 million dredging project and $100 million harbor expansion work in Savannah, Ga., followed to accommodate increased container ship traffic expected with the Panama Canal upgrade.
Sewer construction grew at 4 percent, following an 11 percent gain in 2014. Its largest project was the $225 million Stickney water reclamation plant in Cicero, Ill. Water supply construction slipped 2 percent after a 4 percent decline in 2014. One large project included the $180 million water treatment plant outside of San Jose, Calif.
Other public works
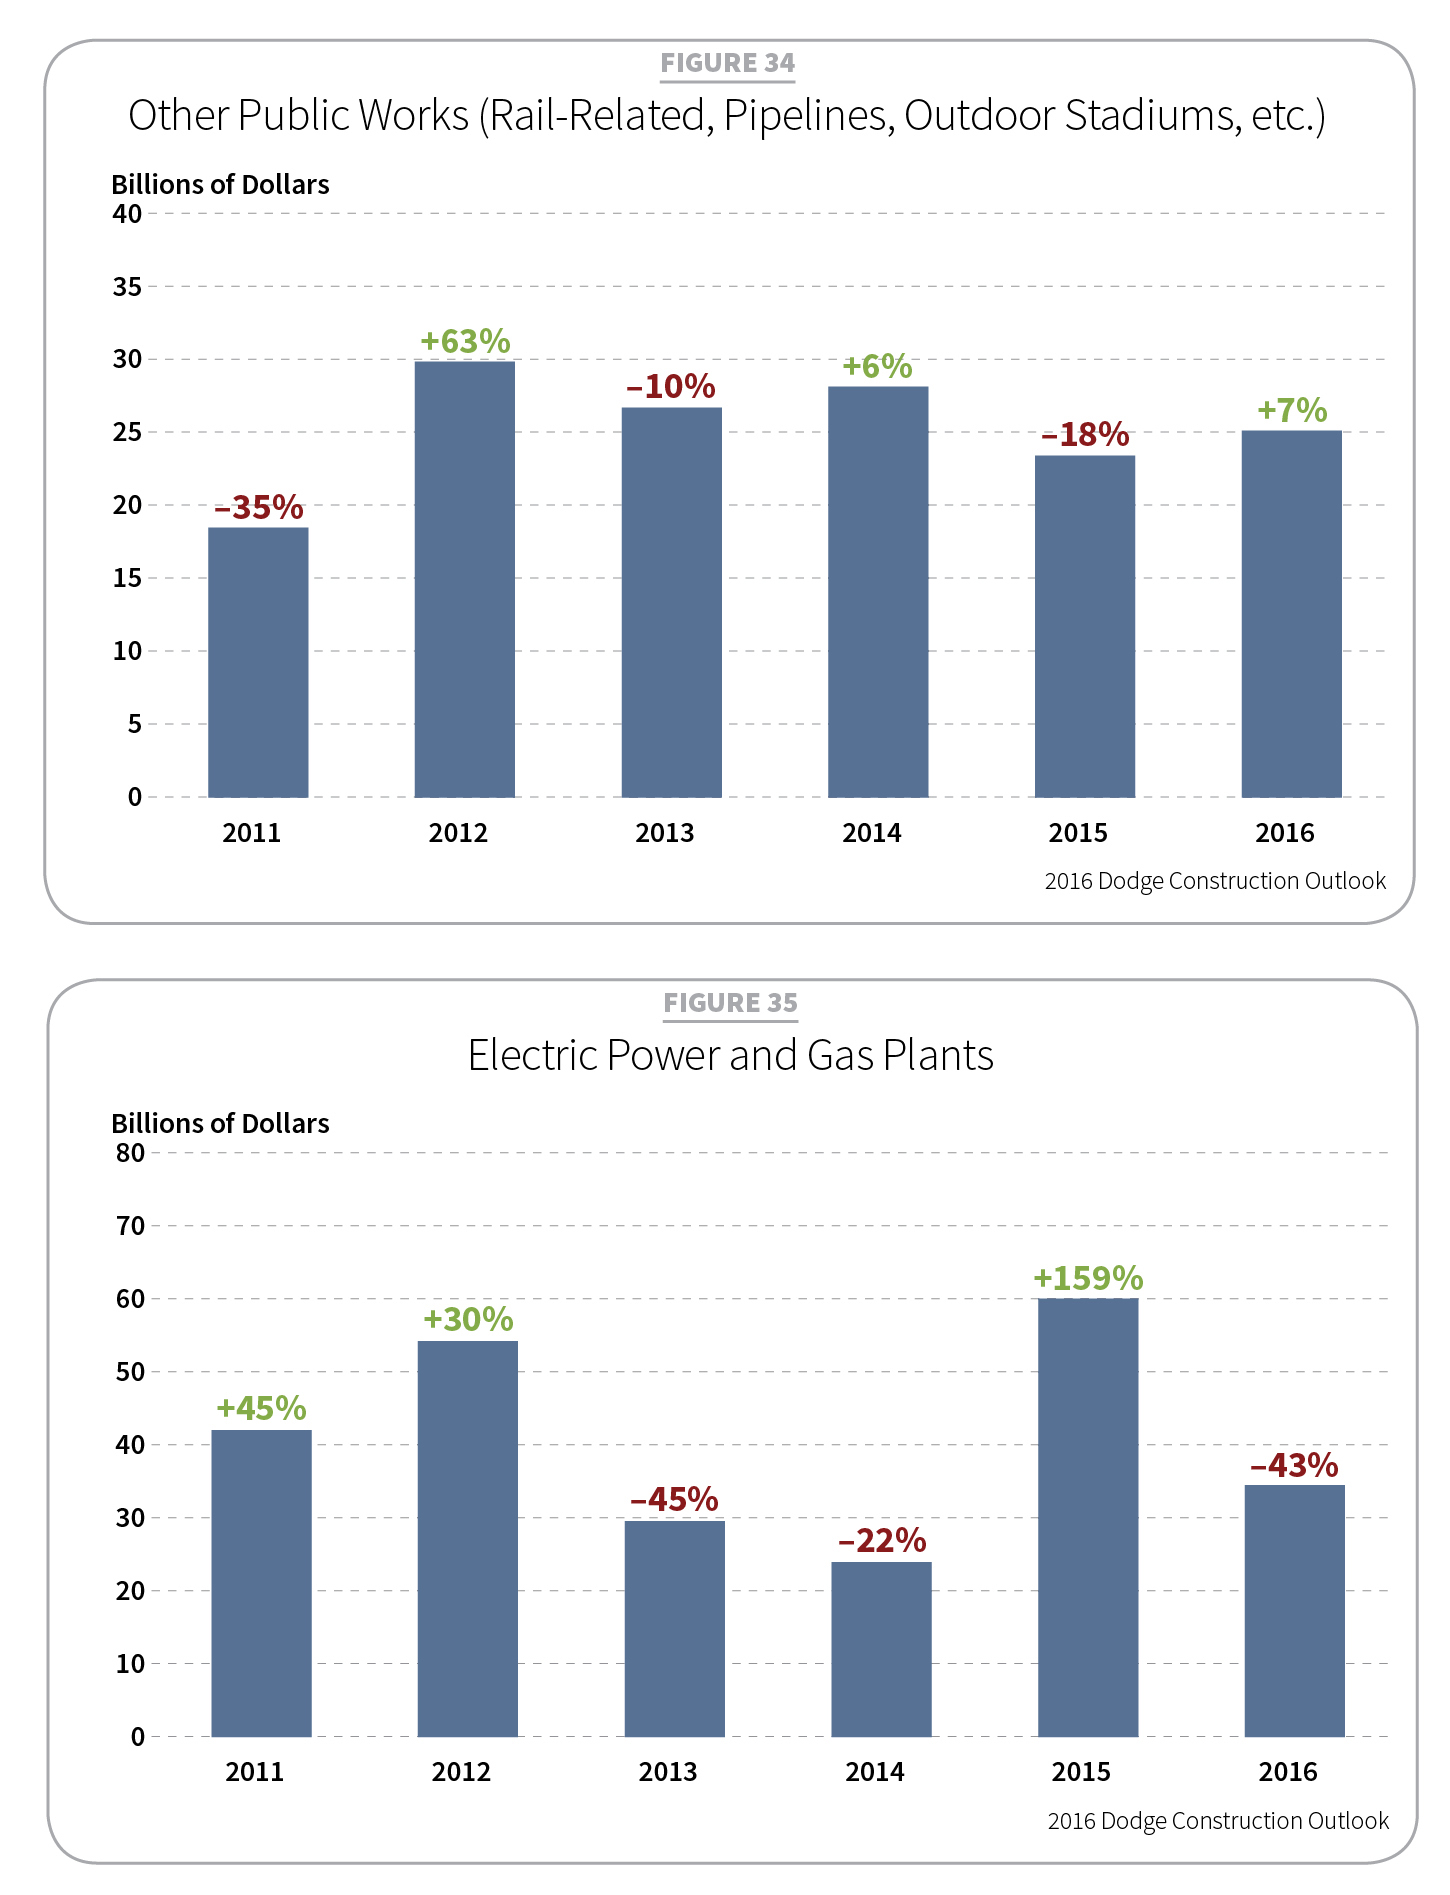
“Other” is an encompassing term capturing rail and mass transit, airport runways/taxiways, and oil and gas pipelines. One segment’s performance can affect the whole. Such was the case in 2015. After a 6 percent recovery in 2014 due to strong rail-related work, rail projects declined in 2015, bringing an 18 percent drop to “other public works.” A rebound is expected this year averaging 7 percent (see Figure 34).
In 2015, the California High Speed Rail Authority’s $690 million Madera-to-Fresno package No. 1 began construction. Meanwhile, airport runway/taxiway construction has remained fairly stable with 2015 construction starts estimated at $2.5 billion.
Pipeline construction fell 37 percent ($3.2 billion) in 2014. In the first nine months of 2015, it recovered by 10 percent. CMD found total growth to be 5 percent for 2015 with uncertain growth for 2016. One of the largest projects was the $630 million expansion to the Creole Trail liquefied natural gas (LNG) terminal and pipeline in Louisiana.
Electric utilities and gas plants
The first nine months of 2015 saw something rather remarkable within the electric utilities sector. After a 56 percent retreat in 2013 and a 3 percent drop in 2014, electric power construction rose 63 percent last year. Several huge natural gas plant projects began, as well. The electric power and gas plant sector surged 159 percent to $60 billion (natural gas—$31 billion, electric—$29 billion) (see Figure 35). In 2016, electric power projects will drop a bit to $29 billion, but gas plant projects will drop significantly, showing only 8 percent growth due to a loss in LNG export terminal work.
Noteworthy projects in 2015 included two separate LNG terminal projects in Texas, totaling $17.4 billion. On the power side, six solar farms in California, including a $1.2 billion project in San Bernardino County, broke ground. Two $800 million natural gas-fired power plant projects began in Ohio and Massachusetts.
WHAT TO EXPECT
These past few years have represented an era of tempered economic expectations for construction. Expect 2016 to continue a sustained recovery strong enough to ward off uncertainty with greater contributions from housing, commercial and institutional.
Half-fast is still moving in the right direction. It just takes longer.
About The Author

GAVIN, Gavo Communications, is a LEED Green Associate providing marketing services for the energy, construction and urban planning industries. He can be reached at [email protected].