You're reading an older article from ELECTRICAL CONTRACTOR. Some content, such as code-related information, may be outdated. Visit our homepage to view the most up-to-date articles.
Enough pauses. We are finally in the midst of a sustained recovery. Fundamentals are strong. Growth is ever steady, and momentum assuredly recovers when unexpected events such as severe weather hit. While the pace of the recovery can be frustrating, last year marked the first year where all but one of the major construction markets made gains or stayed positive. As in 2014, some sectors may cool in 2015 while others heat up.
Industry confidence continued in 2014. In the third quarter, according to Engineering News-Record’s Construction Industry Confidence Index survey, 52 percent of subcontractors surveyed reported an improving market with confidence growing throughout the year. That number jumps to as high as 64 percent when looking out the next 12 months (see Figure 1).
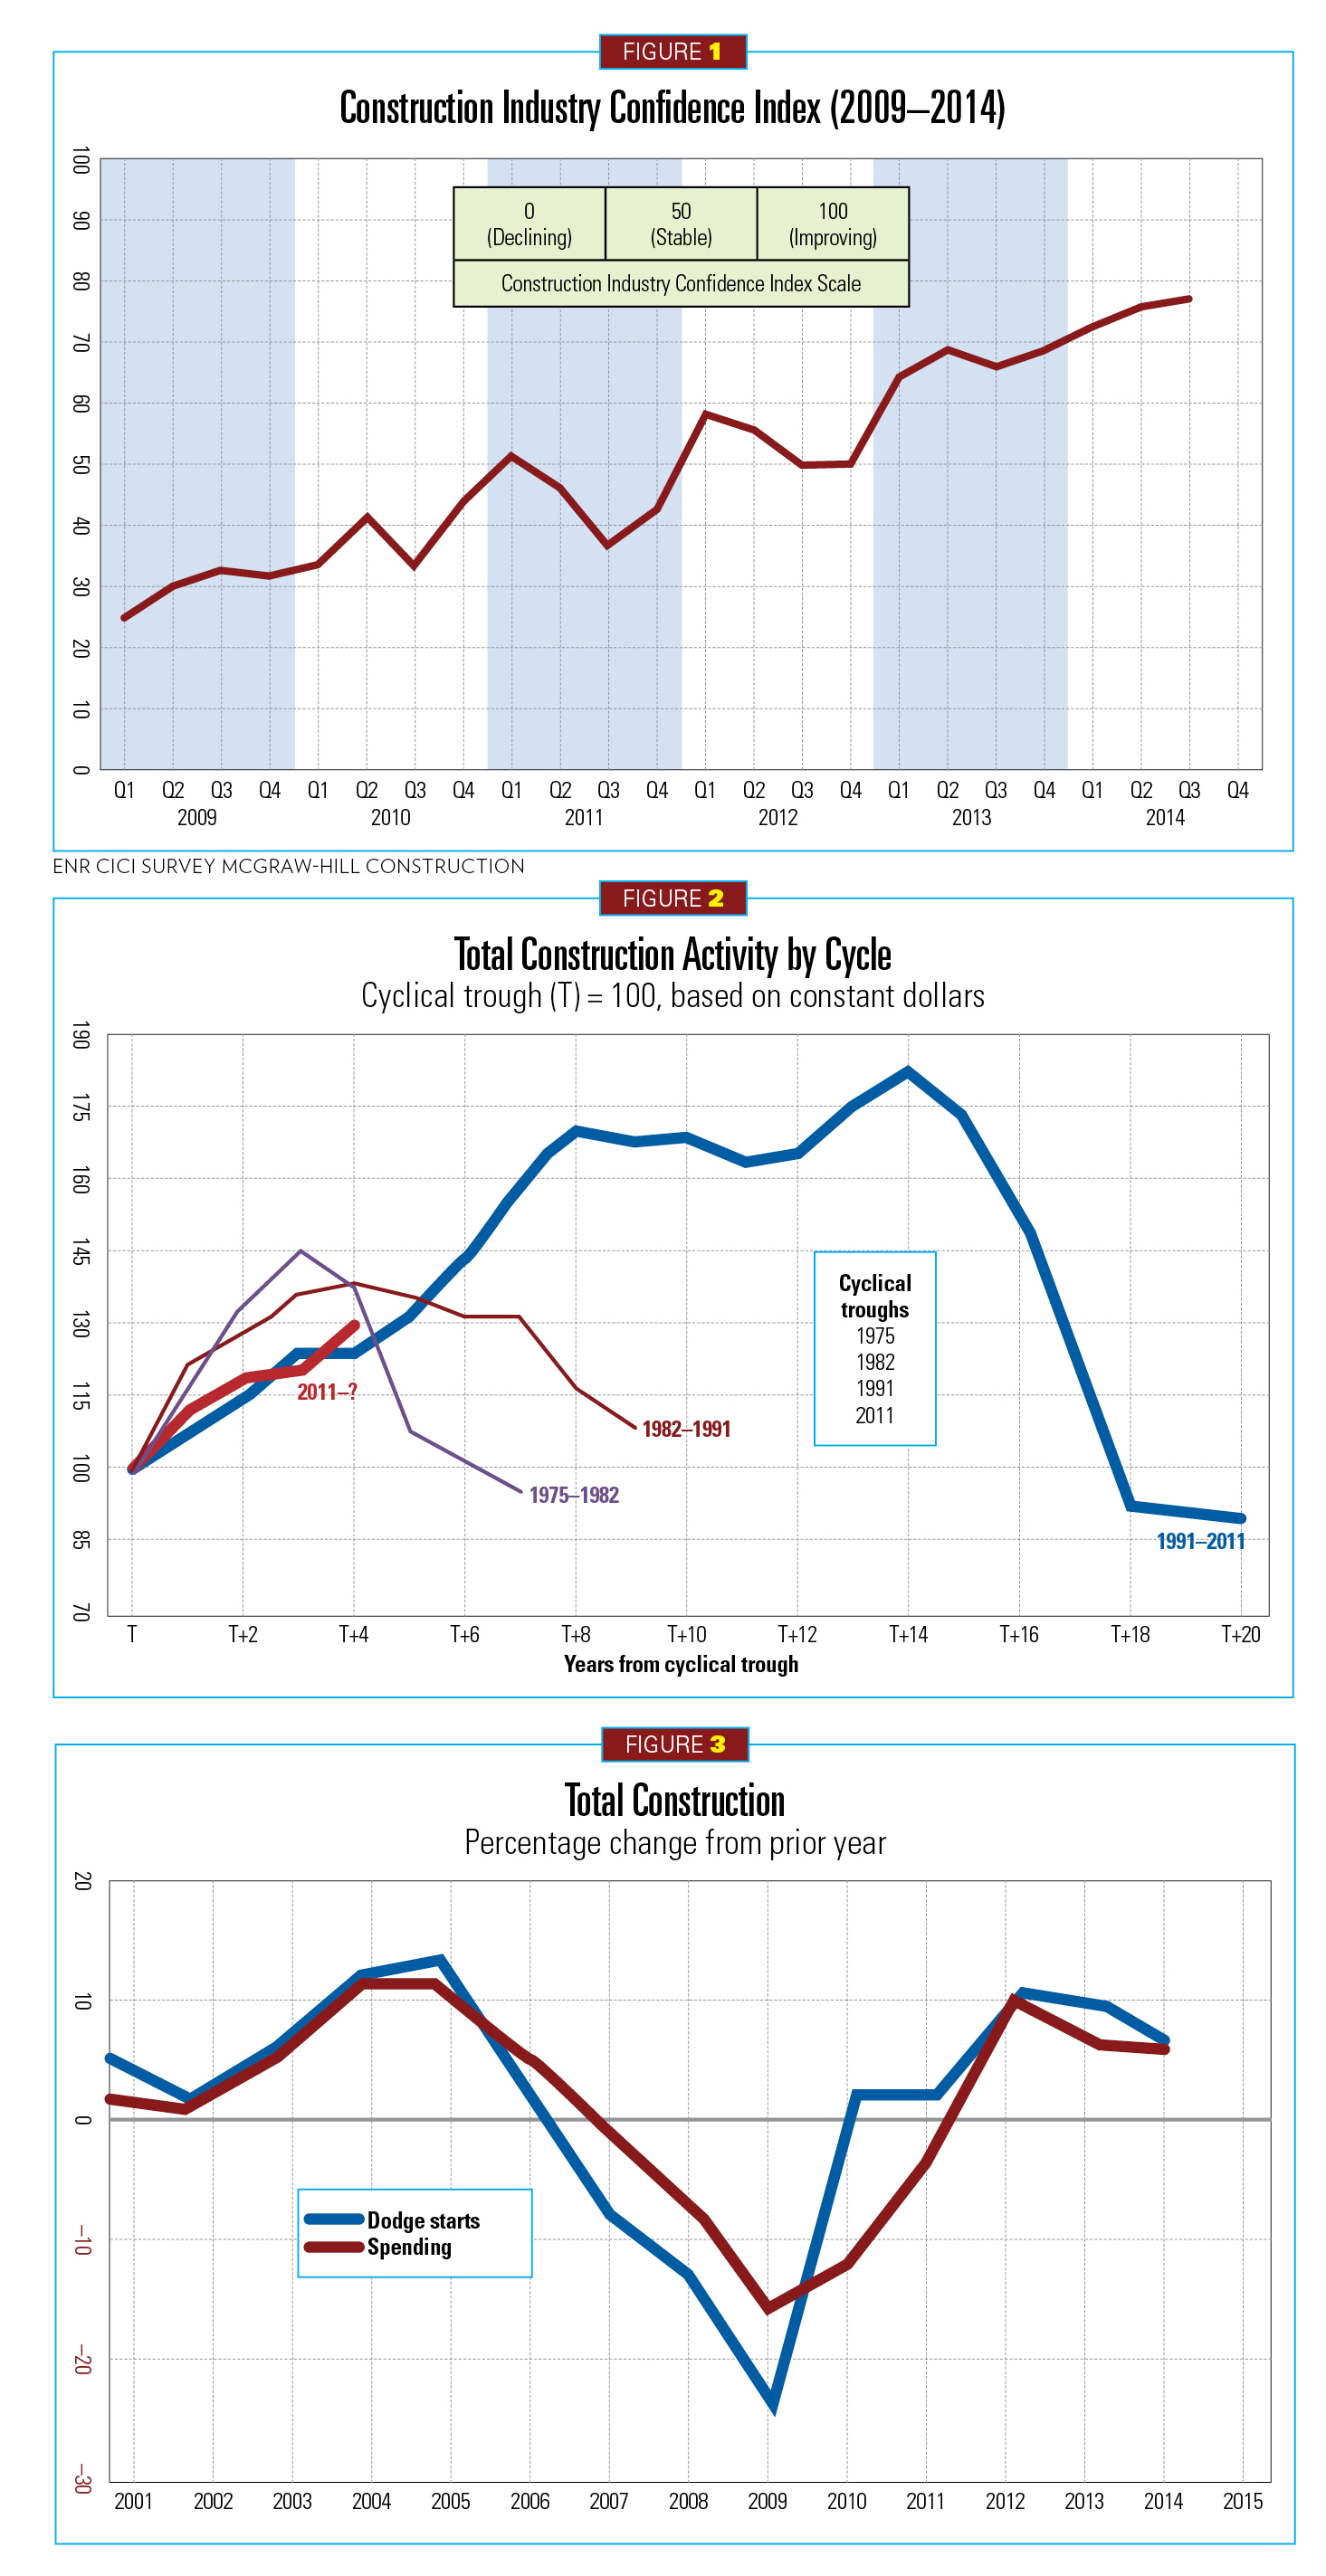
“[2014] marks the first year where the institutional sector is no longer pulling down the other construction sectors,” said Robert Murray, chief economist and vice president, Dodge Data & Analytics (DDA) [formerly McGraw-Hill Construction (MHC)]. “In fact, the recovery in nonresidential is now established. It’s clear we are in broad-based and recognized recovery that is cyclical and reminiscent of 1990s, which led to a 20-year period of stability and growth” (see Figure 2).
Murray and others presented at the McGraw-Hill Construction Outlook 2015 Executive Conference, held Nov. 6, 2014, in Washington, D.C. The bulk of this forecast was derived from the 2015 Dodge Construction Outlook.
CMD Group, formerly Reed Construction Data, also presented its forecast through a webinar, “Is the Pace of Construction Investment Set to Quicken?” on Nov. 20, 2014. CMD’s findings were largely in alignment with those from DDA.
“This is a recovery being driven by the energy sector, high-tech and resurgent manufacturing,” said Alex Carrick, chief economist for CMD Group.
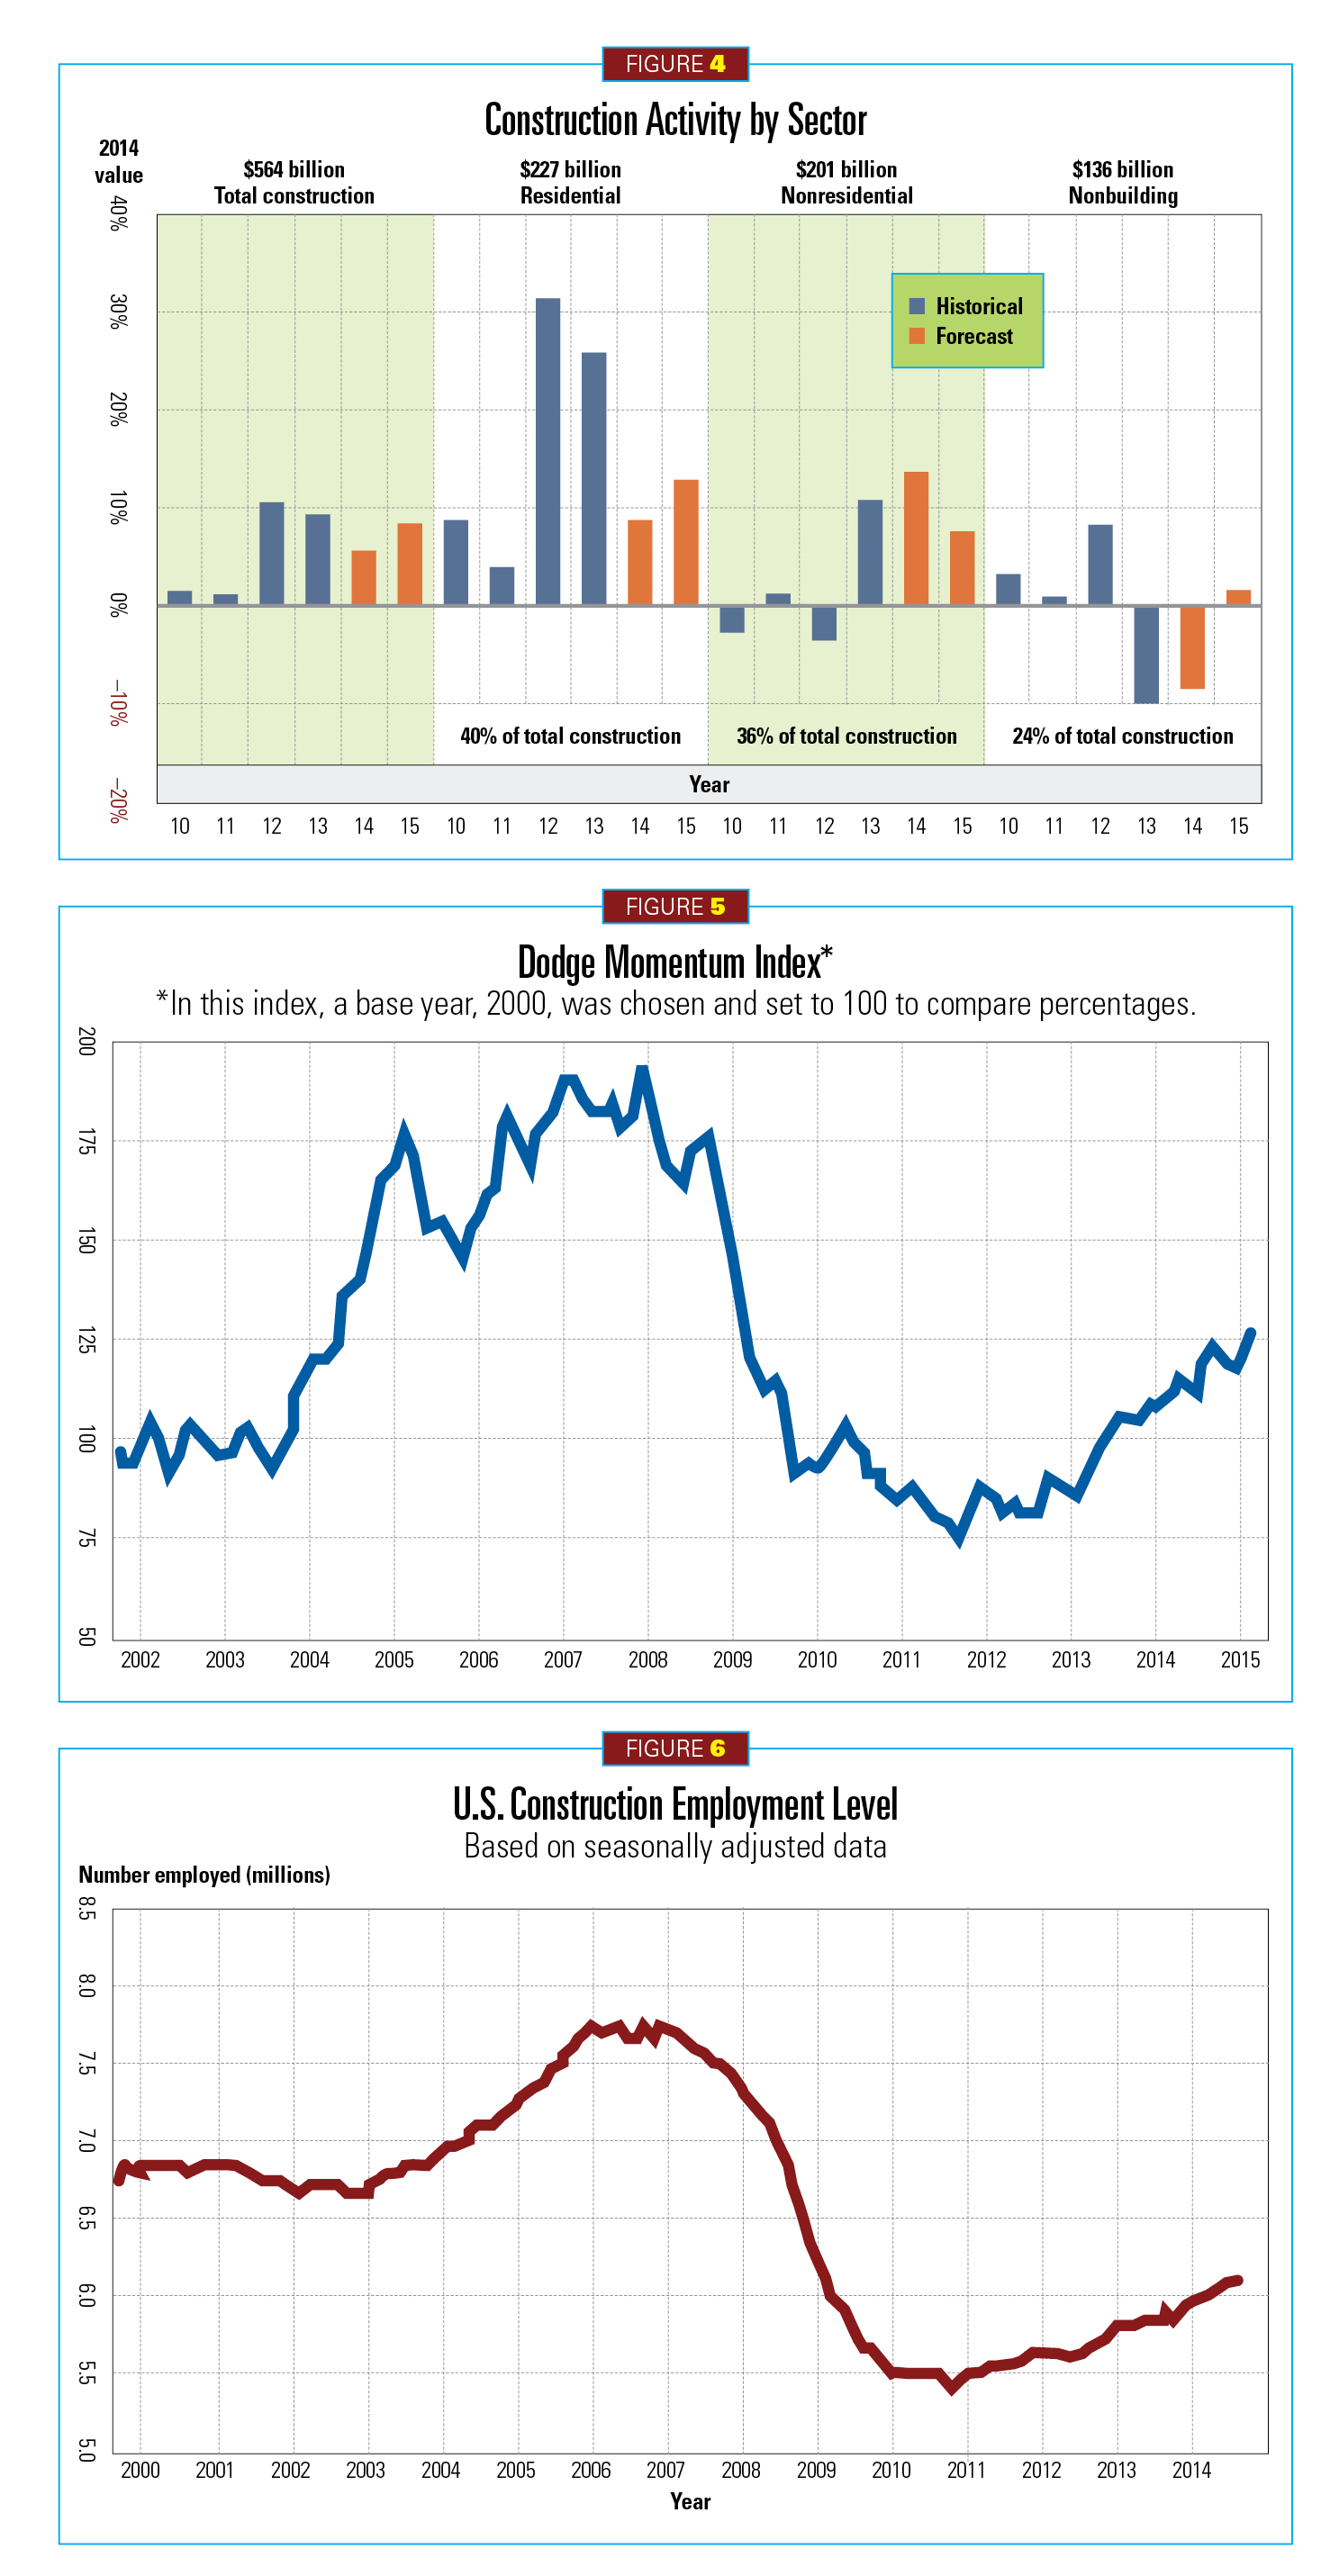
Though 2014 fourth-quarter numbers were not known as of this writing, gross domestic product (GDP) growth for the year was expected to settle around 2.2 percent. That translated to total construction starts that rose approximately 5 percent ($564 billion) (see Figures 3 and 4). A 3.3 percent GDP is estimated for 2015, driving total starts to 9 percent. That breaks down to projected gains in nonresidential building (8 percent), residential (13 percent) and nonbuilding construction (3 percent) (see Figure 4).
Murray said that 2015 GDP could be higher, possibly 3.5 percent. While the adjectives “slow and steady” remain prominent, headwinds are dropping to help fill the sails of this recovery. Construction activity currently represents 5.5 percent of GDP.
Speaking at the conference, Paul Sheard described a difference in this expansion from others. He serves as the executive managing director, chief global economist and head of Global Economic & Research for Standard & Poor’s.
“This growth follows the worst depression since the [Great] Depression,” he said. “It’s up and down, but we’re in pretty good shape with moderate growth. There are plenty of positives due to the right policy moves during the crisis. TARP [Troubled Asset Relief Program], the stimulus [The American Recovery and Reinvestment Act, or ARRA], and Fed rate cuts (0–0.25 percent) all helped us avert another Great Depression. Our economy is doing well, and that should continue.”
Momentum is finally on the upswing (see Figure 5).
Influences to support economic growth
When you compare and contrast where our economy stood prior to the 2008–2009 crisis, you realize how far we have come and how far we still need to go. GDP was just shy of 8 percent before the crisis.
“We’ve lost seven years,” said Ken Simonson, chief economist for the Associated General Contractors of America (AGC). “We have a lot to catch up.”
However, important economic progress continues to be made. Sheard reported that banks largely grew or expanded by 2.2 percent on average since mid-2009. Household spending and fixed investments by businesses have strengthened.
“Speaking as an economist, quantitative easing has also been a tailwind for the economy,” Sheard said. “I see the unwinding of assets back to the private sector over the next five to seven years.”
CMD Group’s Carrick cited other favorable factors, including the drop in the price of gasoline, which he said will affect consumer spending in a similar fashion to a tax cut. Additionally, the trade deficit is now cut by one-third; the federal deficit has dropped from more than $1 trillion per year to $564 billion (projected through September 2015) based largely on domestic energy consumption; and inflation remains low.
The drop in unemployment numbers is good news as well. Today’s rate is 5.8 percent with roughly 230,000 jobs added monthly when averaged throughout 2014. Looking through the lens of the construction market, AGC reported 12,000 new jobs created in October 2014. Since then, Carrick said construction unemployment has fallen to 6.9 percent (see Figure 6).
“Everything changed in May, when U.S. unemployment reached numbers reflective of a pre-recession level,” Carrick said.
Both CMD Group and Dodge raised the specter of a labor shortfall (CMD projects 1.5 million) because workers left the industry during the depths of the recession, many retraining and unlikely to return. The more work in the construction industry, the bigger its challenge when filling needed jobs with trained individuals (see Figure 7).
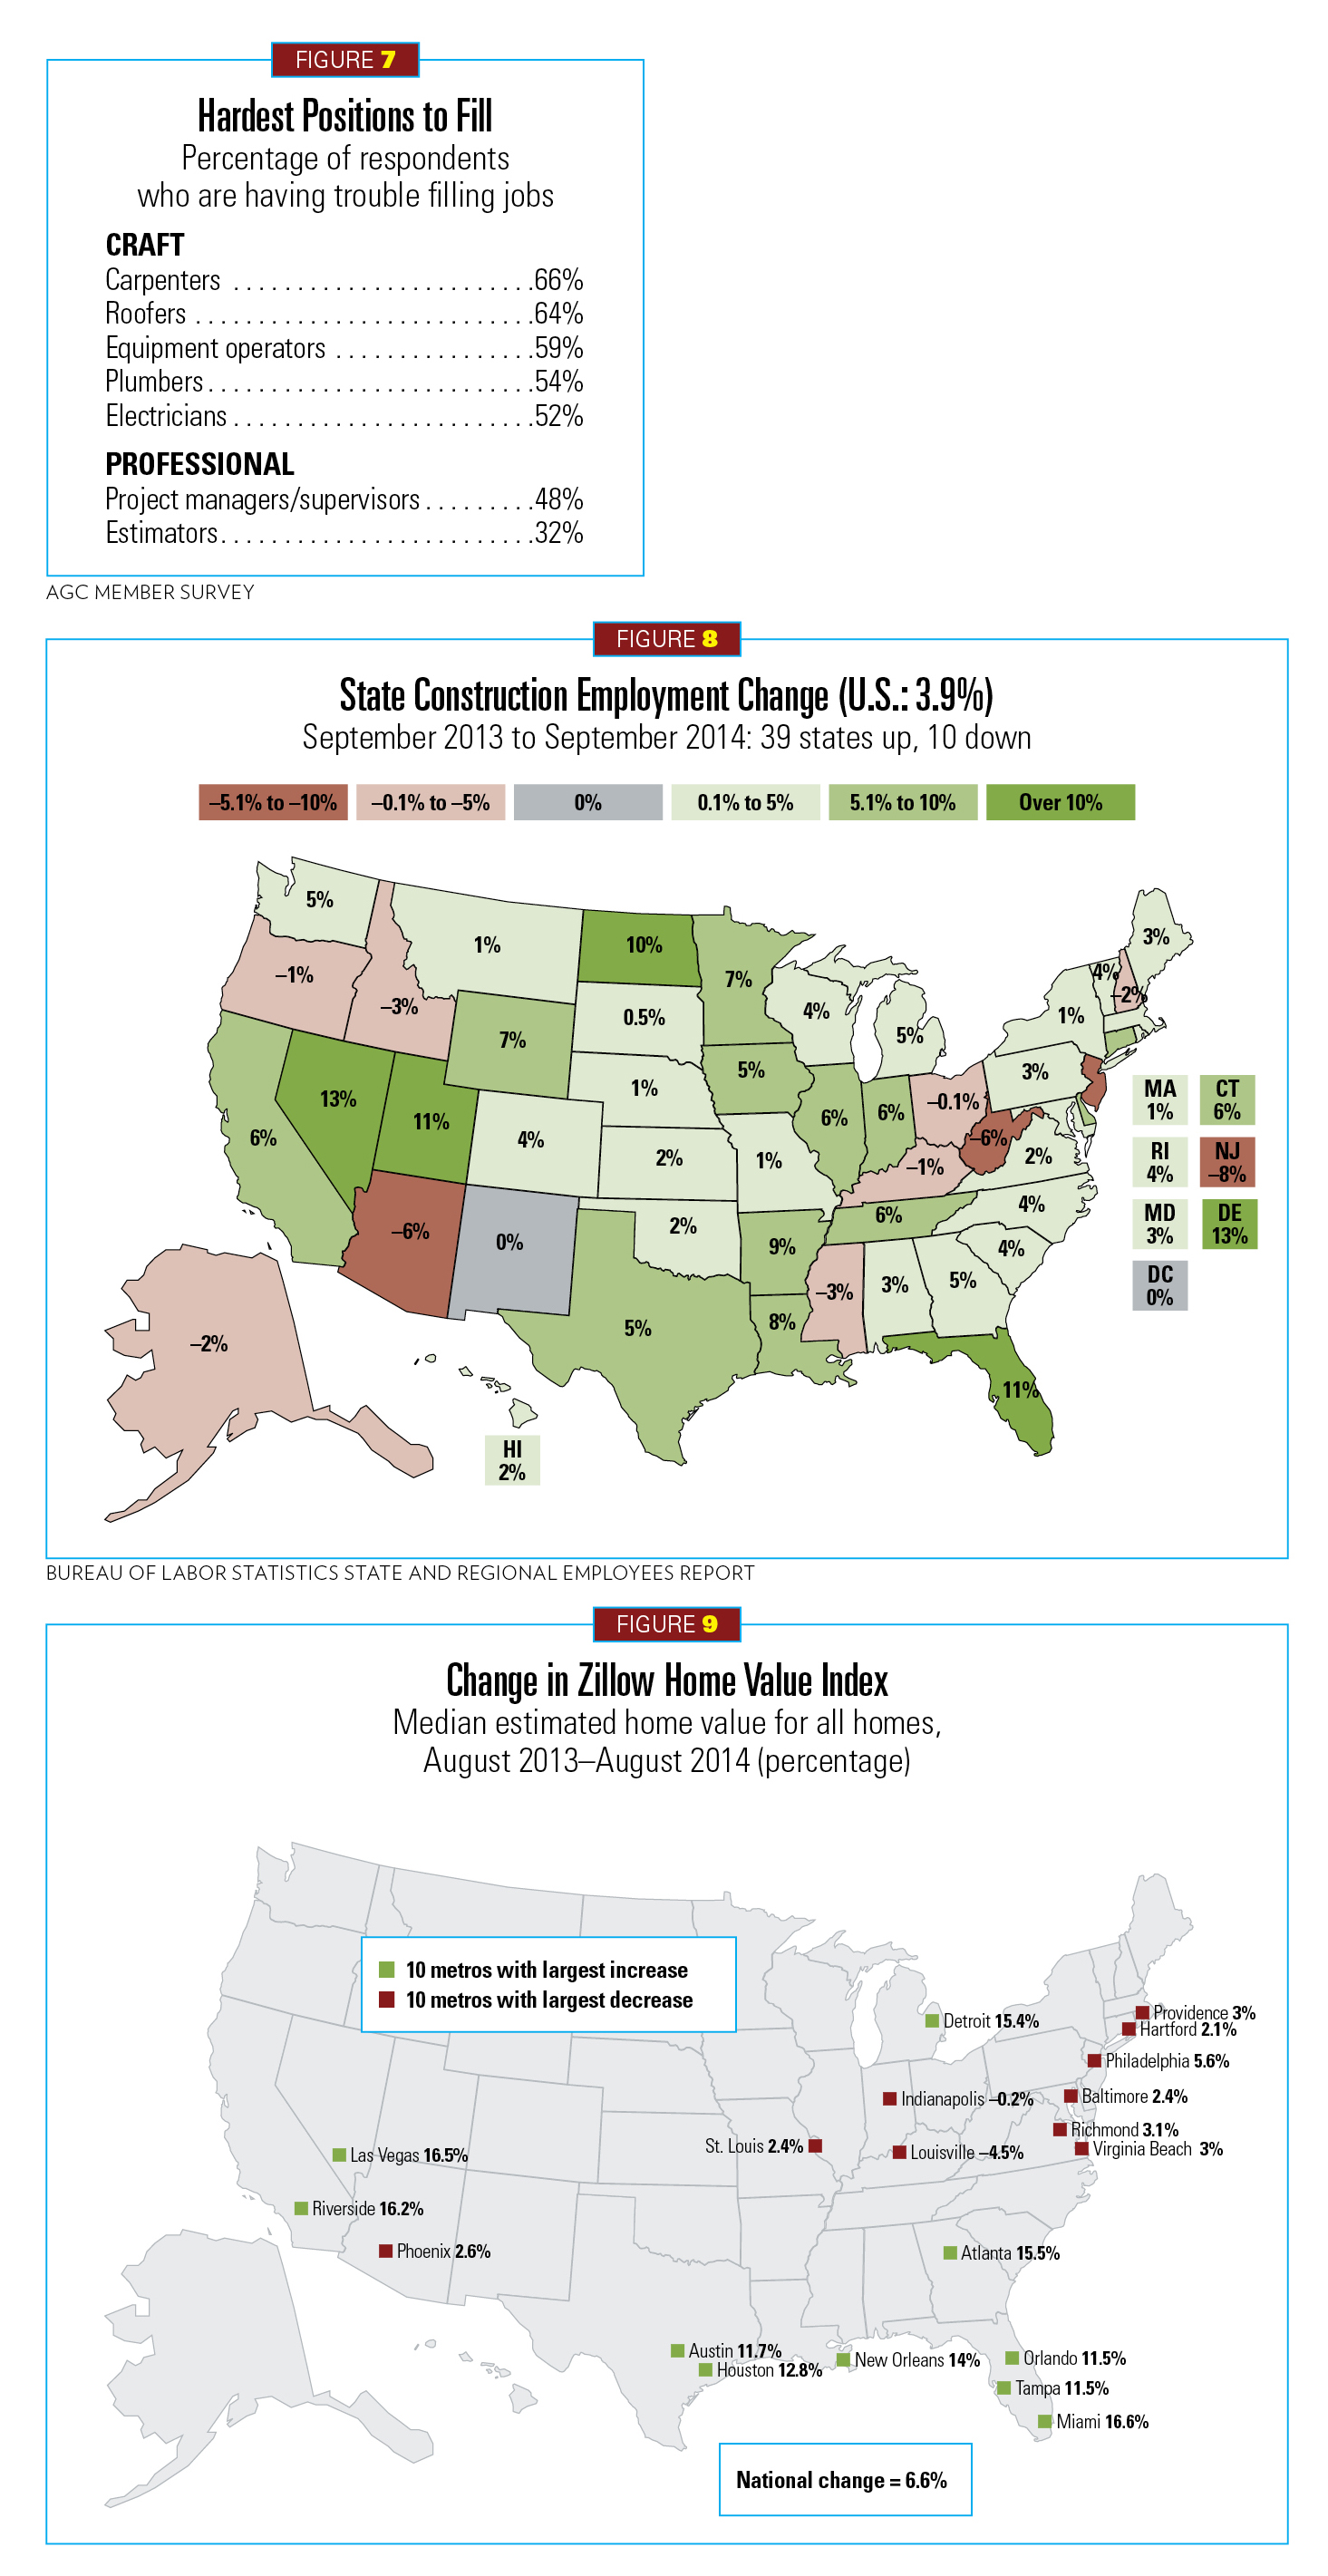
The employment bounceback depends on where you are in the country. Most areas have rebounded nicely, but other states still face high construction unemployment (see Figure 8).
Another encouraging economic statistic is housing investment-to-GDP inching up to 3.2 percent. The National Association of Home Builders (NAHB) reported in November 2014 that “markets in 59 of the approximately 350 metro areas nationwide returned to or exceeded their last normal levels of economic and housing activity in the third quarter of 2014.” Meanwhile, 66 percent of markets have shown an improvement year-over-year. Consumer confidence is also translating to homebuilder confidence with a strength not seen in nine years, according to November 2014’s Wells Fargo Housing Market Index (HMI). The Zillow Home Price Expectations Survey expects the housing recovery to take maybe three to five more years (see Figure 9).
Finally, the American Institute of Architect’s “The Business of Architecture: 2014 AIA Firm Survey Report” finds design activity at architecture firms has recovered to pre-recession levels.
Sheard said the world’s economic health also is either on the mend or finally taking prescriptive action that mirrors successful actions taken by the United States.
“I feel it would take a catastrophic world event to derail the American economy, and I don’t see that happening,” he said.
The new Congress will certainly affect industry progress. If gridlock can be avoided, several important gains can be made, including passage of a multiyear highway-transit bill, a six-year surface transportation bill and other infrastructure legislation.
The energy gale
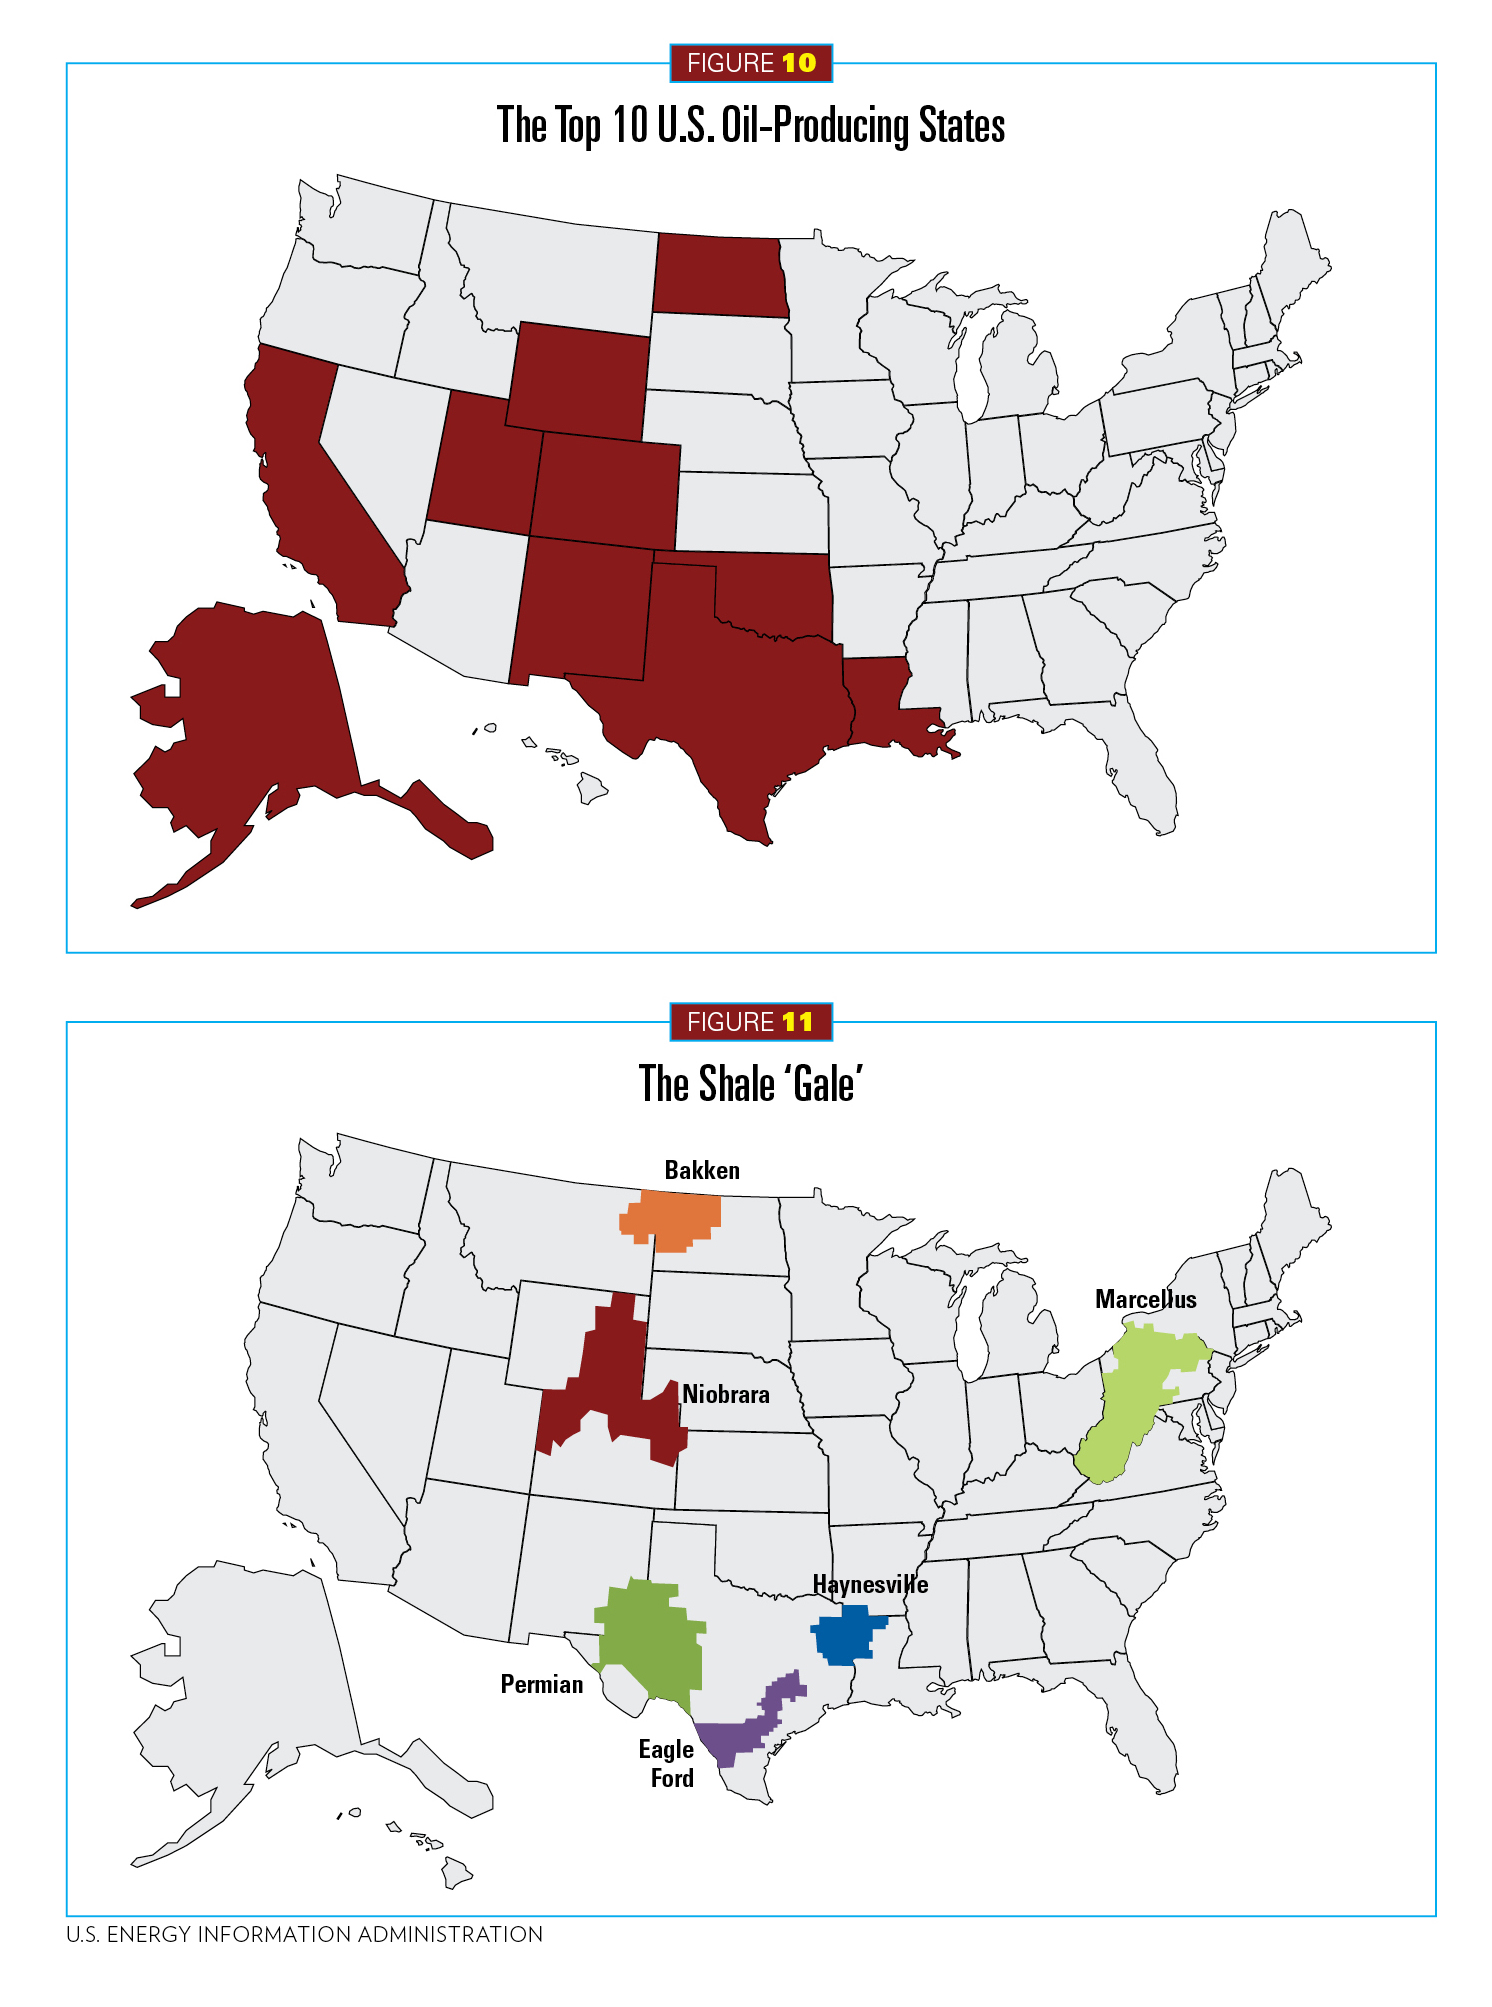
New opportunities in rising sectors will continue to drive U.S. construction in 2015 and beyond. The growth in U.S. oil and natural gas exploration and processing is one such sector.
“I think oil and gas infrastructure will be a huge construction opportunity,” said Branko Terzic, president and CEO, Branko D. Terzic & Associates, who was part of a McGraw-Hill panel looking at the influence of domestic energy creation on the U.S. construction market.
“Over the next 10 years, $275 billion in gas and oil distribution upgrades will be needed; $23 billion for natural gas storage facilities; and $32 billion for gas processing; an estimated $20 billion for crude oil pipeline; and $9 billion for rail investment,” Terzic said. “These and other infrastructure investment will total some $505 billion.”
Obviously, oil and gas production is located near where the oil and natural gas resources are, so it will affect some regional contractors more than others (see Figures 10 and 11).
Energy efficiency and alternative energy will also continue to be important.
“Better building design and retrofits, distributed generation project roll-outs, smart-grid development and renewable-power investments are all energy drivers that are and will impact the construction market going forward,” said Bill Loveless, editorial director, U.S. Energy Policy. “When it comes to energy generation, certainly the use of natural gas and ... ‘renewables’ will continue to increase.”
Robert Perciasepe, president, Center for Climate and Energy Solutions, added that the demand for energy efficiency for buildings or power delivery is a natural opportunity for contractors.
“It’s a train you should be on,” he said. “This is an amazing time as technologies are proven out. You are in the lead with this energy-reduction market.”
The power of trends
Harvey M. Bernstein, vice president, Industry Insights & Alliances, DDA, said renewable power is expected to grow over the next three years as customer demand goes up. Projecting to 2016, renewables for single-family housing will represent solar photovoltaic panels (51 percent), ground-source heat exchange (52 percent), solar thermal (46 percent) and wind (15 percent). Multifamily projections are even greater (see Figure 12).
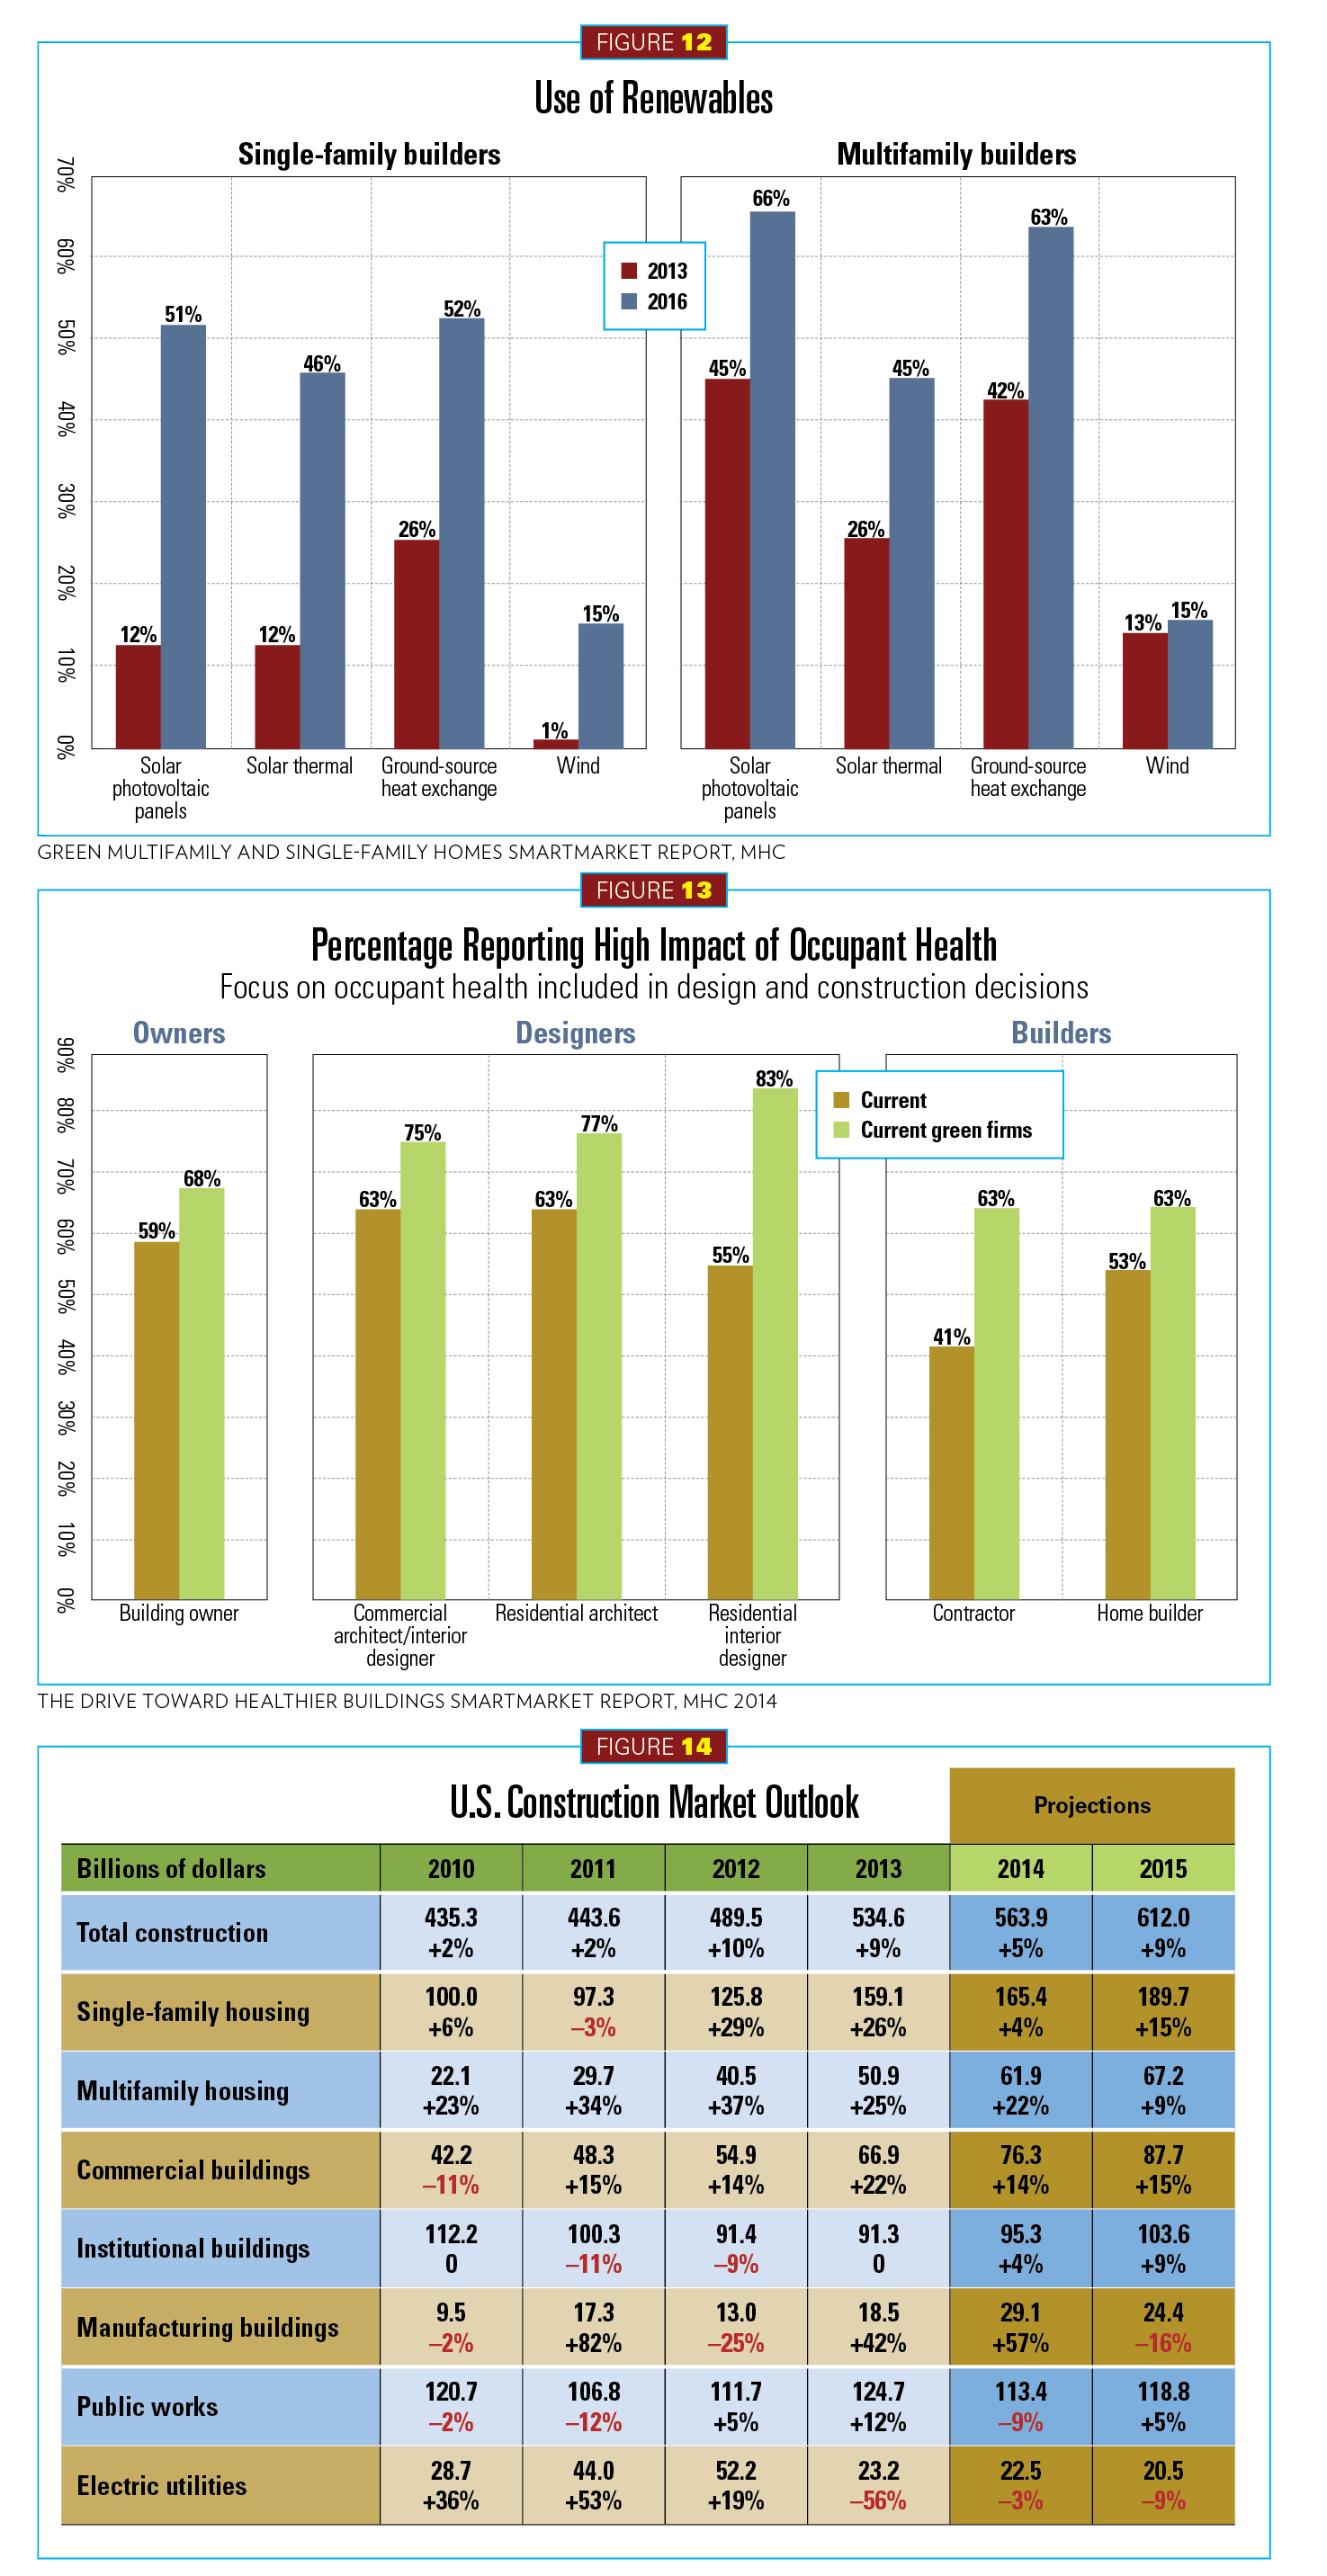
“There’s also significant attention being made to the health impacts and possible benefits of green buildings on its occupants,” Bernstein said. “This has now become a major factor in building design. In fact, as the green market matures [$81 billion in 2014 and almost 50 percent of all construction and growing], several industry sectors may get a new push due to the emphasis on healthy buildings.”
In a 2014 McGraw-Hill study, owners were surveyed on the impact of specific design/construction decisions factoring in occupant health. Though all agreed there needed to be a standard measure created to track effects more assuredly, 47 percent of owners reported healthcare cost reductions ranging from 1–5 percent; 21 percent believed occupant productivity was raised; 66 percent reported improved employee engagement, and 56 percent saw a reduction in absenteeism.
The buy-in from business owners’ human resources executives was especially acute. Some 91 percent believed healthier buildings resulted in better worker productivity.
Electrical Contractor has previously reported on how lighting is just one factor in promoting a healthy environment from offices to hospital buildings. An estimated 64 percent of residential and nonresidential contractors agreed that design considerations for achieving healthier buildings was important to their customers (see Figure 13).
SECTOR FORECASTS
As usual, you may first want to glance at the overall U.S. Construction Market Outlook in Figure 14 before we dive into each individual sector. The following forecasts are derived from the 2015 Dodge Construction Outlook unless otherwise noted.
Residential building— A bounce back to modest 2015 gains
In 2014, total housing starts reached an estimated 1.01 million, a 3 percent gain. While a net positive, it was disappointing compared to 2012’s 27 percent rise and 2013’s 21 percent. This year, the residential sector is expected to climb back to 9 percent (1.1 million units).
Some familiar drags continue to slow growth in this sector. Financing remains tight for single-family homes with banks generally asking for hefty credit scores of 780 or more. Underwater homes, though fewer in number, still dampen this market. Interestingly, demographics are playing a role too. The U.S. Census Bureau indicates that since the end of the great recession, fewer than 600,000 households have formed each year (2010–2013). Generation X, smaller than the baby boomer generation, aren’t forming households to any great degree. They are carrying high student loan debt and struggling to find well-paying jobs. They are often delaying marriage, children, and, yes, home buying.
Single-family housing
Dodge reports single-family housing rose just 1 percent to 630,000 units in 2014. Interestingly, the NAHB estimate is higher. It set single-family housing starts at 991,000, up 6.6 percent from 2013. According to Dodge, single-family housing is expected to return to 11 percent (700,000 units) in 2015 (see Figure 15). The NAHB forecasts higher at 802,000 units and expects production to reach 1.1 million homes in 2016. One emerging factor holding back this market is the lack of interest or inability for millennials to purchase a home. It’s hoped that an improving economy will reverse this dynamic.
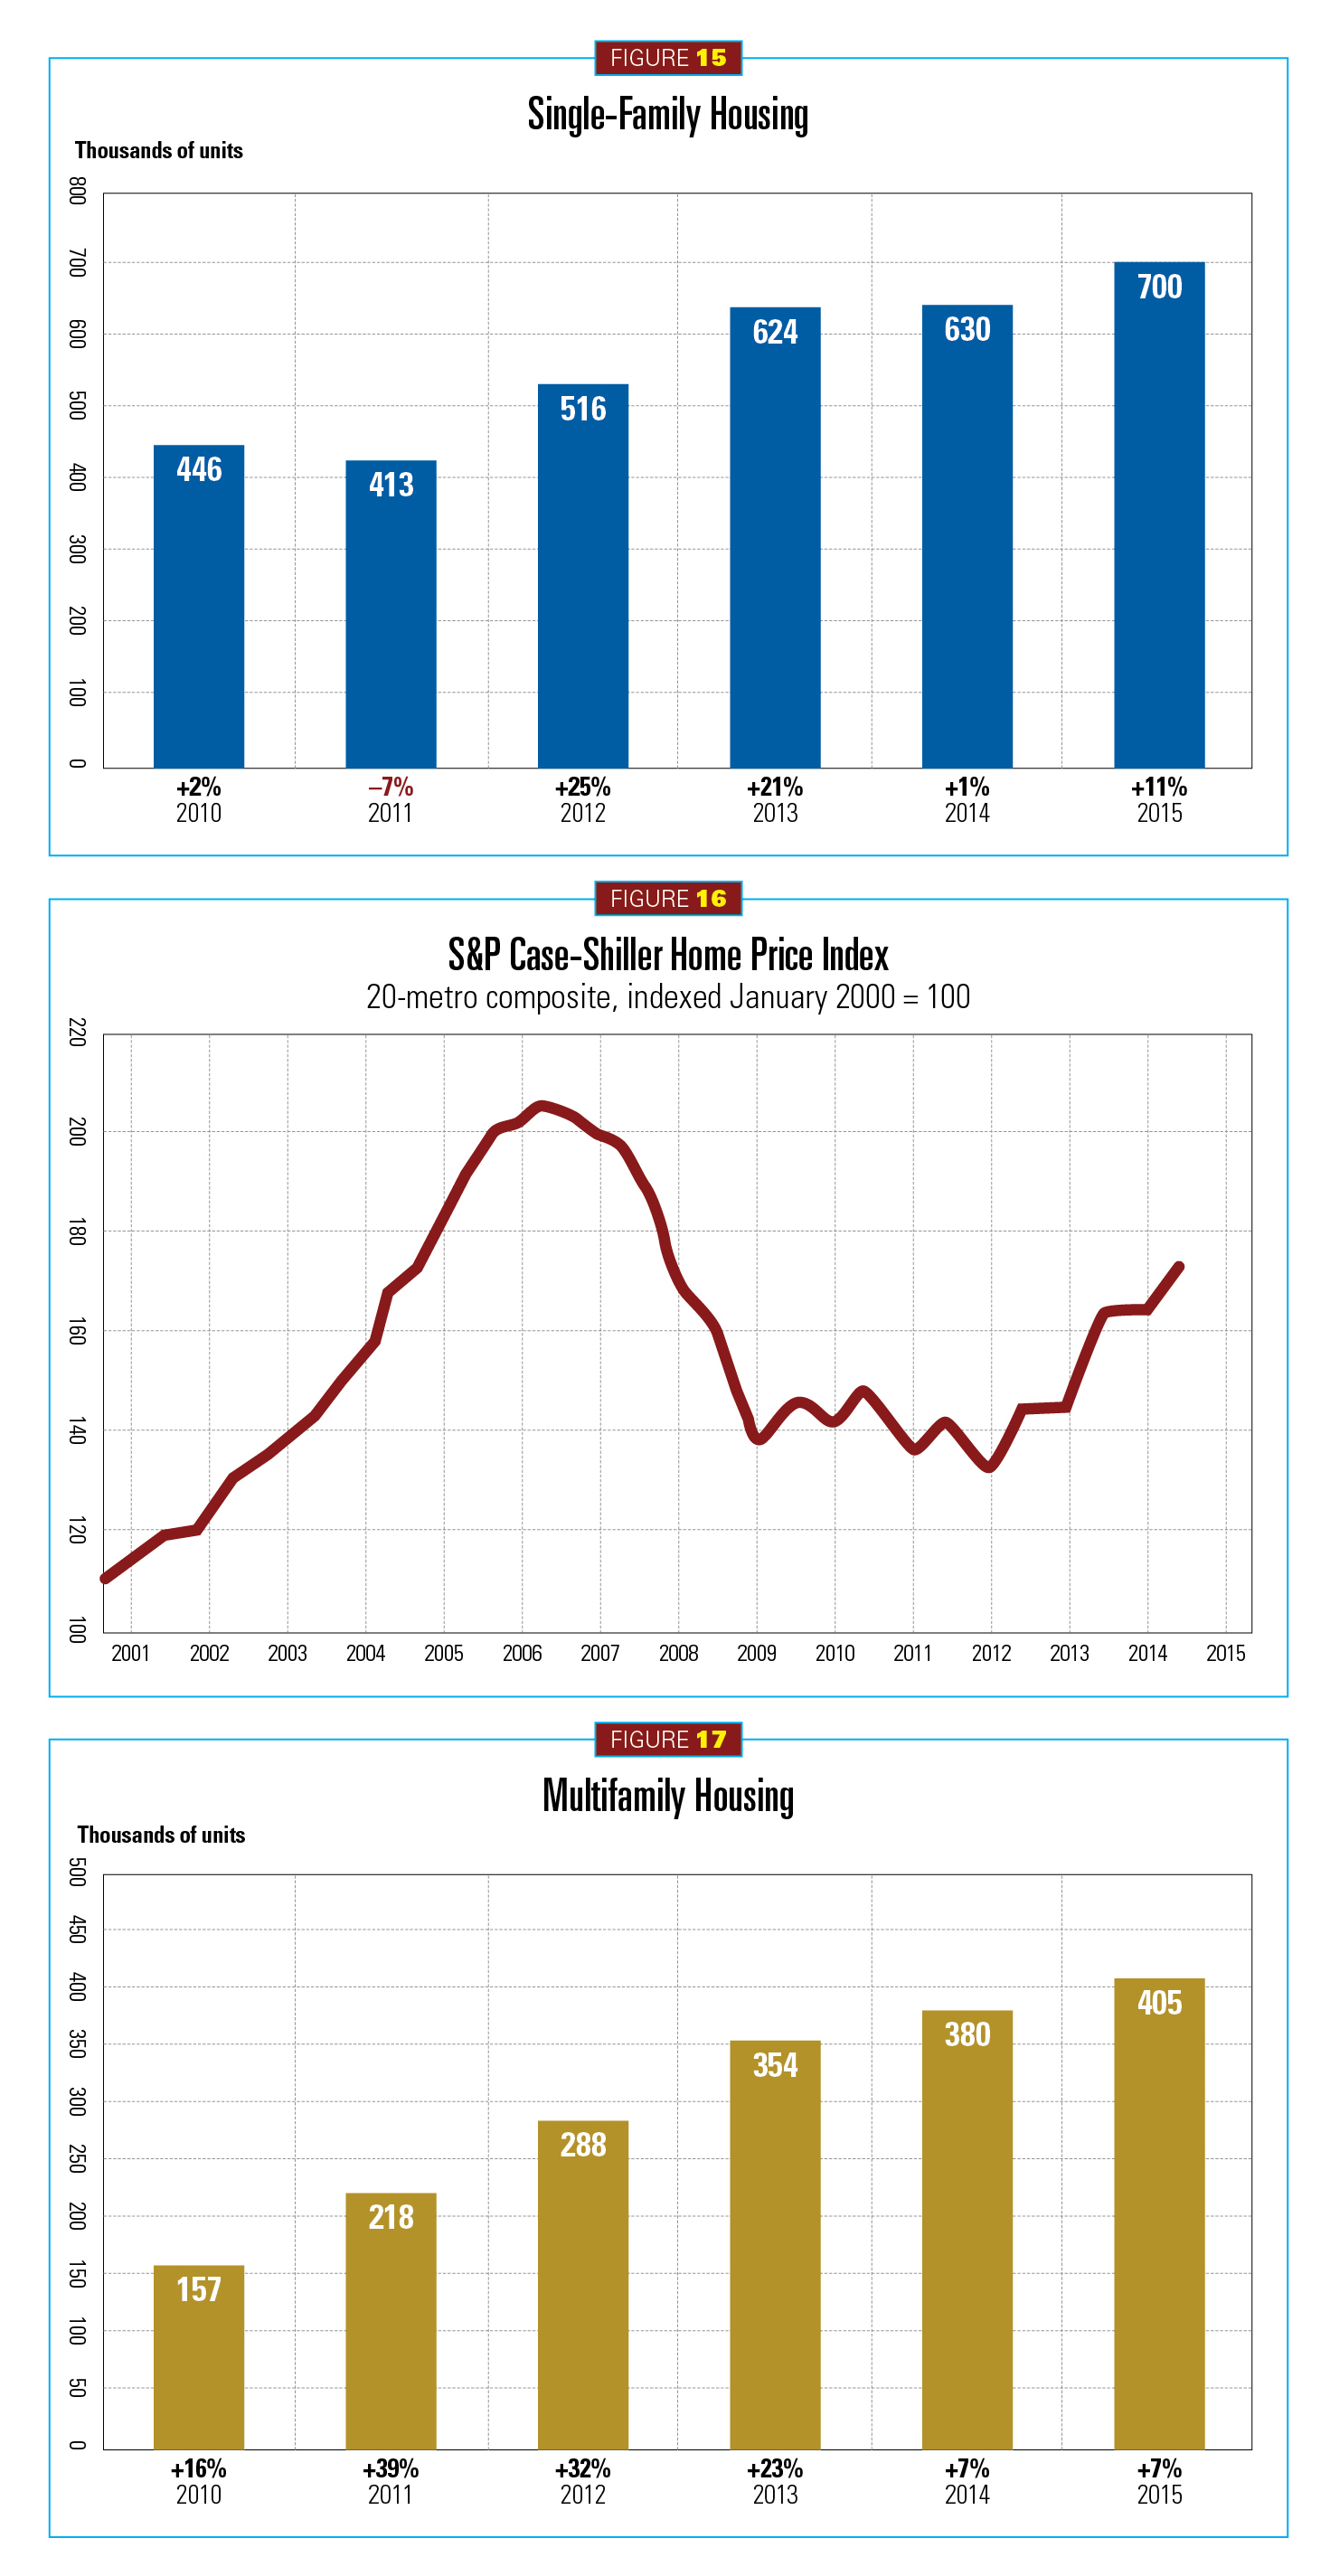
Enforcing growth is a lower inventory of new-homes-for-sale holding to a five-month supply, a 49 percent sales gain from 2010, and a 29 percent rise in homes prices since 2012 (S&P, Case-Shiller index) (see Figure 16). Foreclosures have also dropped 61 percent since September 2010, representing the lowest number since November 2007. Mortgage rates remain low (4 percent in October 2014) but financing remains tight. There is hope that Fannie Mae and Freddie Mac and other lenders will close a deal to expand credit for residential mortgages.
As of 2015, starts have grown 70 percent, with the West region leading (93 percent), followed by the South-Atlantic (82 percent). In succession are the Midwest (66 percent), South-Central (57 percent) and the Northeast (50 percent).
Multifamily
In all things housing, multifamily has been the star performer during this recovery. In 2014, starts reached 7 percent (380,000 units). This climb represented a 179 percent total-sector gain since 2009. Dodge, CMD and NAHB believe starts in 2015 will cool but still grow, representing about 405,000 units (7 percent) (see Figure 17).
While foreclosures have been a bane to single-family sector growth, they have fed the multifamily sector’s rental market. Freddie Mac economists estimate apartment demand will average 440,000 units per year over the next decade.
This past year marked some noteworthy multifamily construction projects. New York City led with eight of the 10 largest projects, including a $710 million residential portion of the Nordstrom Tower. Second was a $424 million project along the East River. Third was Larry Silverstein’s $420 million One West Avenue. New York racked up nearly $9.6 billion in multifamily housing starts, up 51 percent from 2013. Washington, D.C., came in second with starts totaling $2.6 billion, followed by Miami at $2.4 billion.
The commercial sector—Office construction continues to lead
Progress continues in the commercial building sector, but it slowed. Down from the strong 26 percent growth in 2013, this market expanded 8 percent (572 million square feet) and 14 percent in spending/construction put in place ($76.3 billion) in 2014. Last year’s square footage gains were at the highest level since 2008. Office and hotel construction led in 2014, followed by warehouses. Store construction decreased. The harsh 2014 winter deferred some projects, affecting first-quarter momentum. Some losses could not be recouped. For 2015, expect an increase of 12 percent (640 million square feet) and 15 percent ($87.7 billion).
This year’s starts in dollar value will be 81 percent higher than 2010. Helping sustain the recovery are some strong economic market fundamentals such as higher occupancies and rent, some easing of bank lending and commercial real estate lending. Easing occurred in 18 consecutive quarters.
Offices
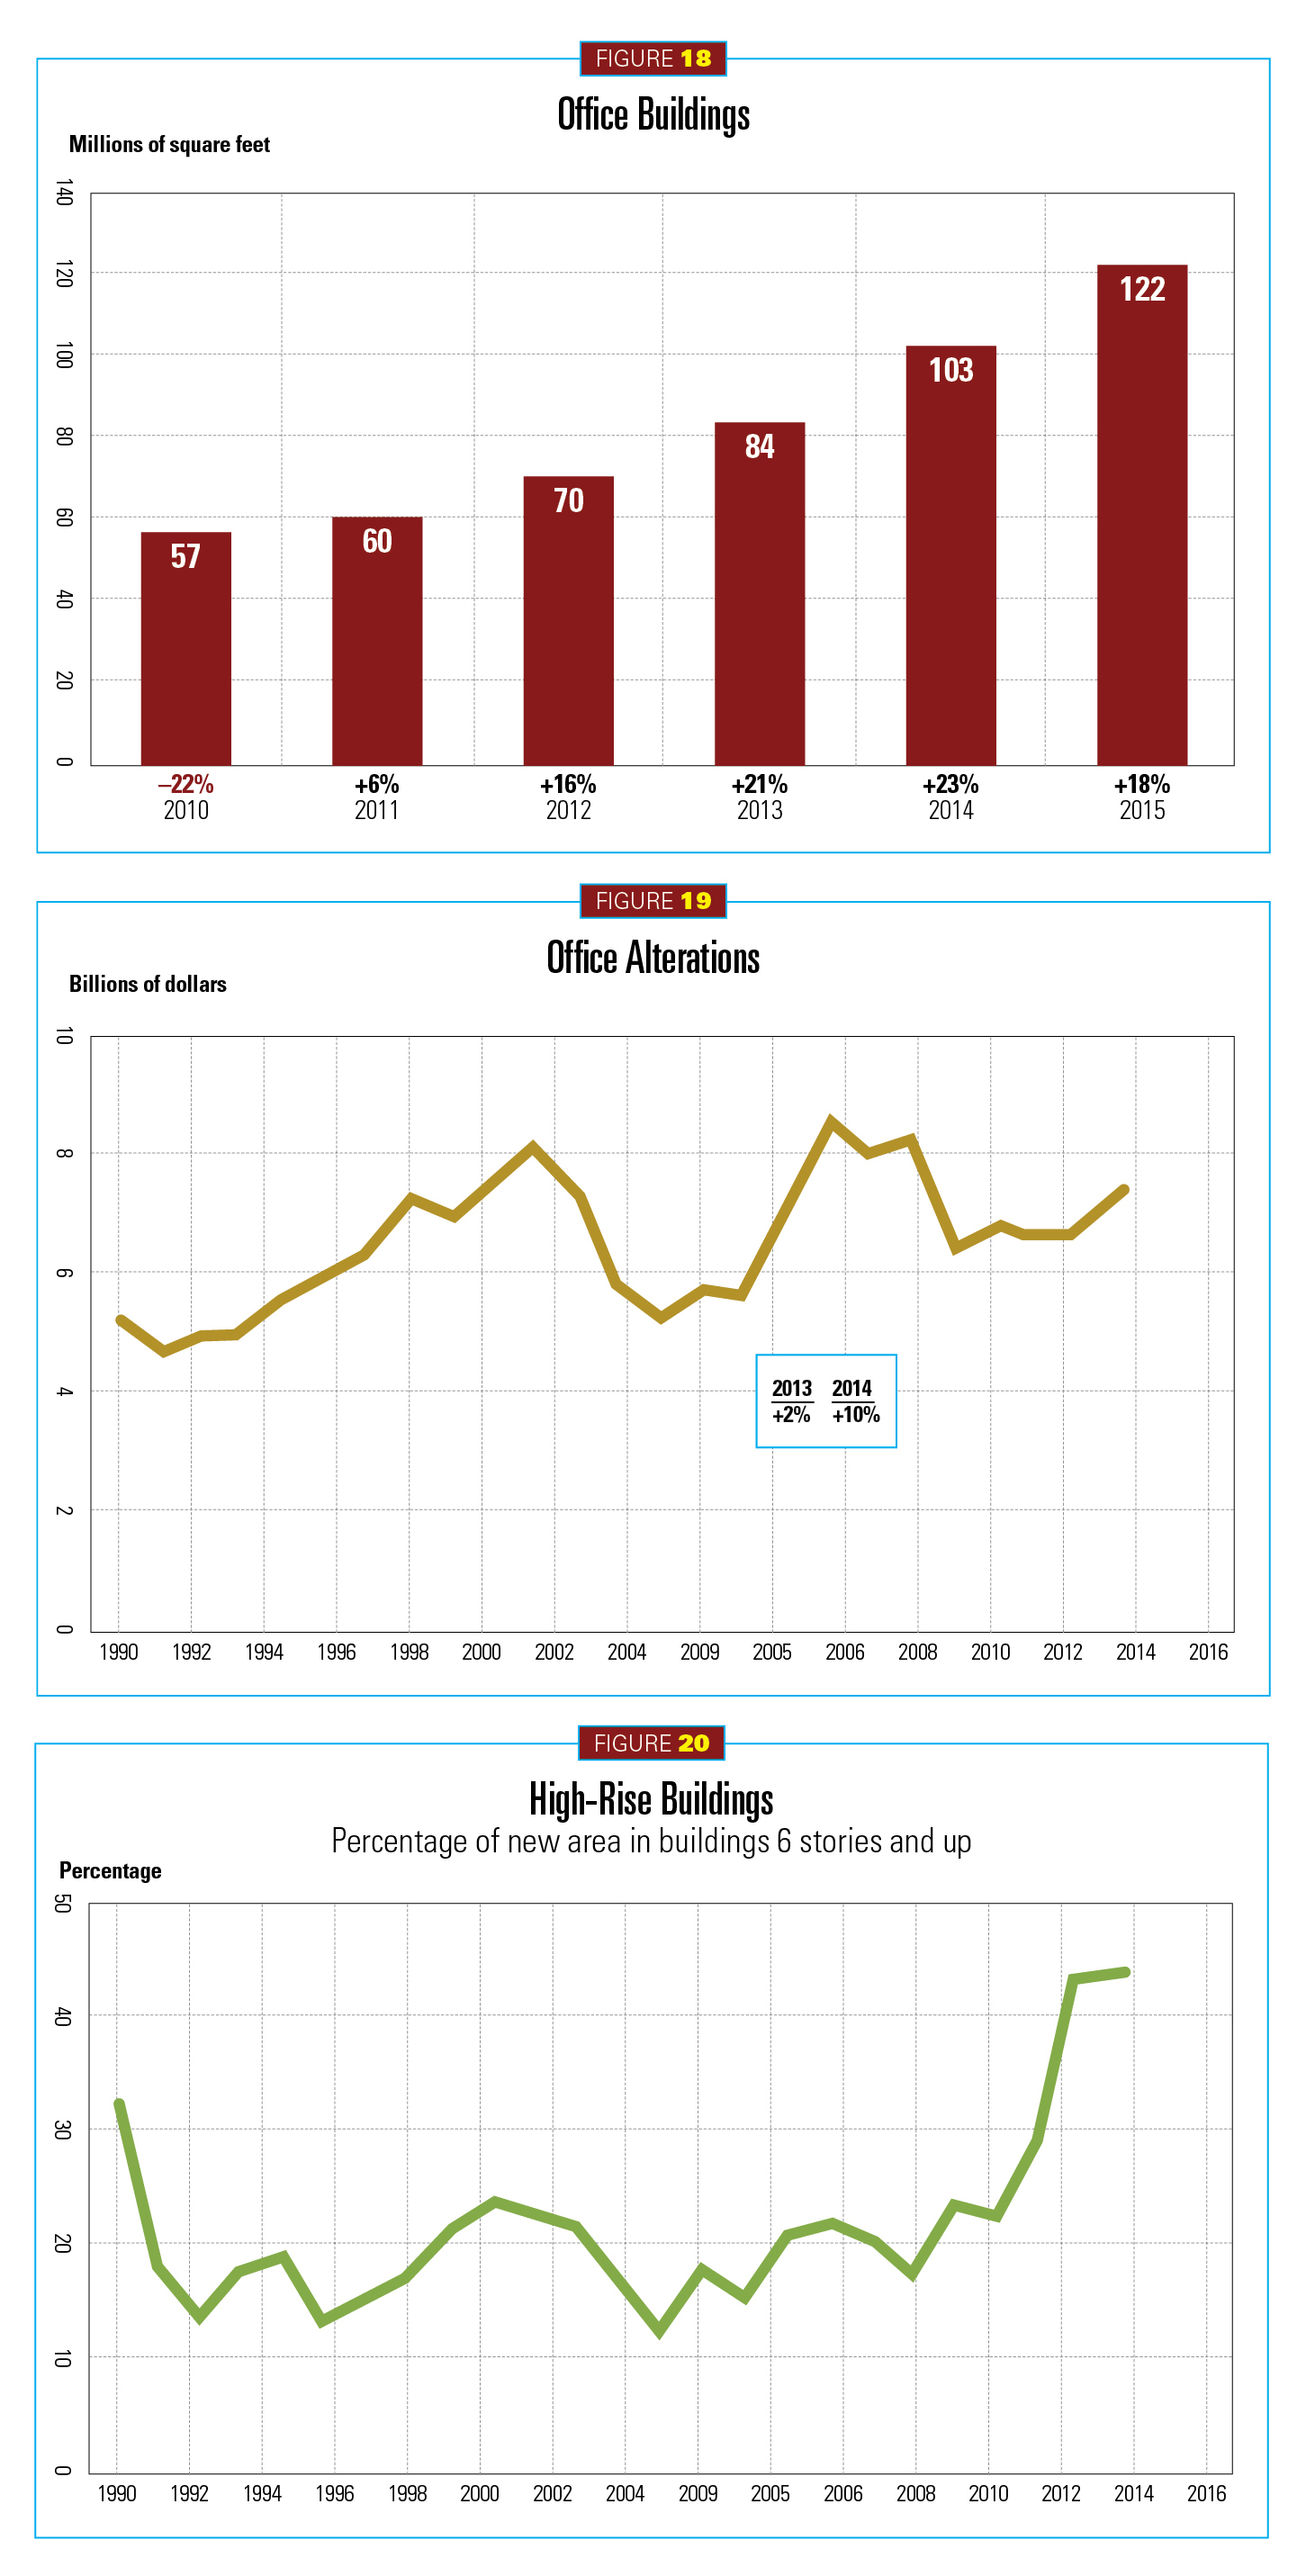
Office expansion continued into 2014 with estimated gains of 23 percent (103 million square feet) and 28 percent in dollar value ($27.1 billion) (see Figure 18). New office starts for 2015 are forecast at 18 percent (122 million square feet) and 19 percent in dollar value ($32.3 billion). Of note, Dodge found the strength of major store alteration or renovation activity that held during the 2008–2009 downturn is expected to grow another 2 percent in 2014 (see Figure 19). In addition, high-rise construction (six stories and up) for office spaces continues its three-year climb (see Figure 20). Vacancy peaks of 2010 are also retreating. According to CBRE-EA, downtown vacancy rates fell 50 basis points to 11.3 percent in the third quarter of 2014, bettering suburban rates that fell 20 basis points to 15.7 percent. Of the 63 markets covered by CBRE-EA, 44 showed a reduction of vacancy rates.
Stimulating growth were “nontraditional” building types, such as data centers. They represented five of the 20 top office projects in 2014, generating $1.6 billion in construction value. The largest office project was, in fact, a data center for the U.S. Army at Fort Meade, Md. ($861 million). Microsoft broke ground on three data centers—representing $875 million—to support its cloud effort. Travelers Insurance invested in a $200 million data center in Omaha, Neb. Chicago and Texas were also home to major projects.
Technology companies invested heavily in 2014. Last May, Apple broke ground on a new corporate headquarters in San Jose, Calif., a 2.8 million-square-foot, $2.3 billion effort. In Philadelphia, Comcast began building its Innovation and Technology Center (1.3 million square feet/$806 million). Other leading projects included the $333 million Zurich North America Insurance Co. headquarters in Chicago.
The top three states for office construction are led by Texas (by a wide margin), clocking in at about 16 million square feet. California followed at 6.5 million square feet, and Illinois came in third at 3.5 million. Of note, Chicago saw a 225 percent increase in office construction activity in 2014 after suffering a slower office recovery than other major cities.
Though government office construction slowed once ARRA funding ended, it saw a modest increase in 2014. The General Services Administration (GSA) began work on an $80 million energy-efficiency upgrade of the Harry S. Truman Building in Washington D.C., home of the U.S. State Department.
Hotels
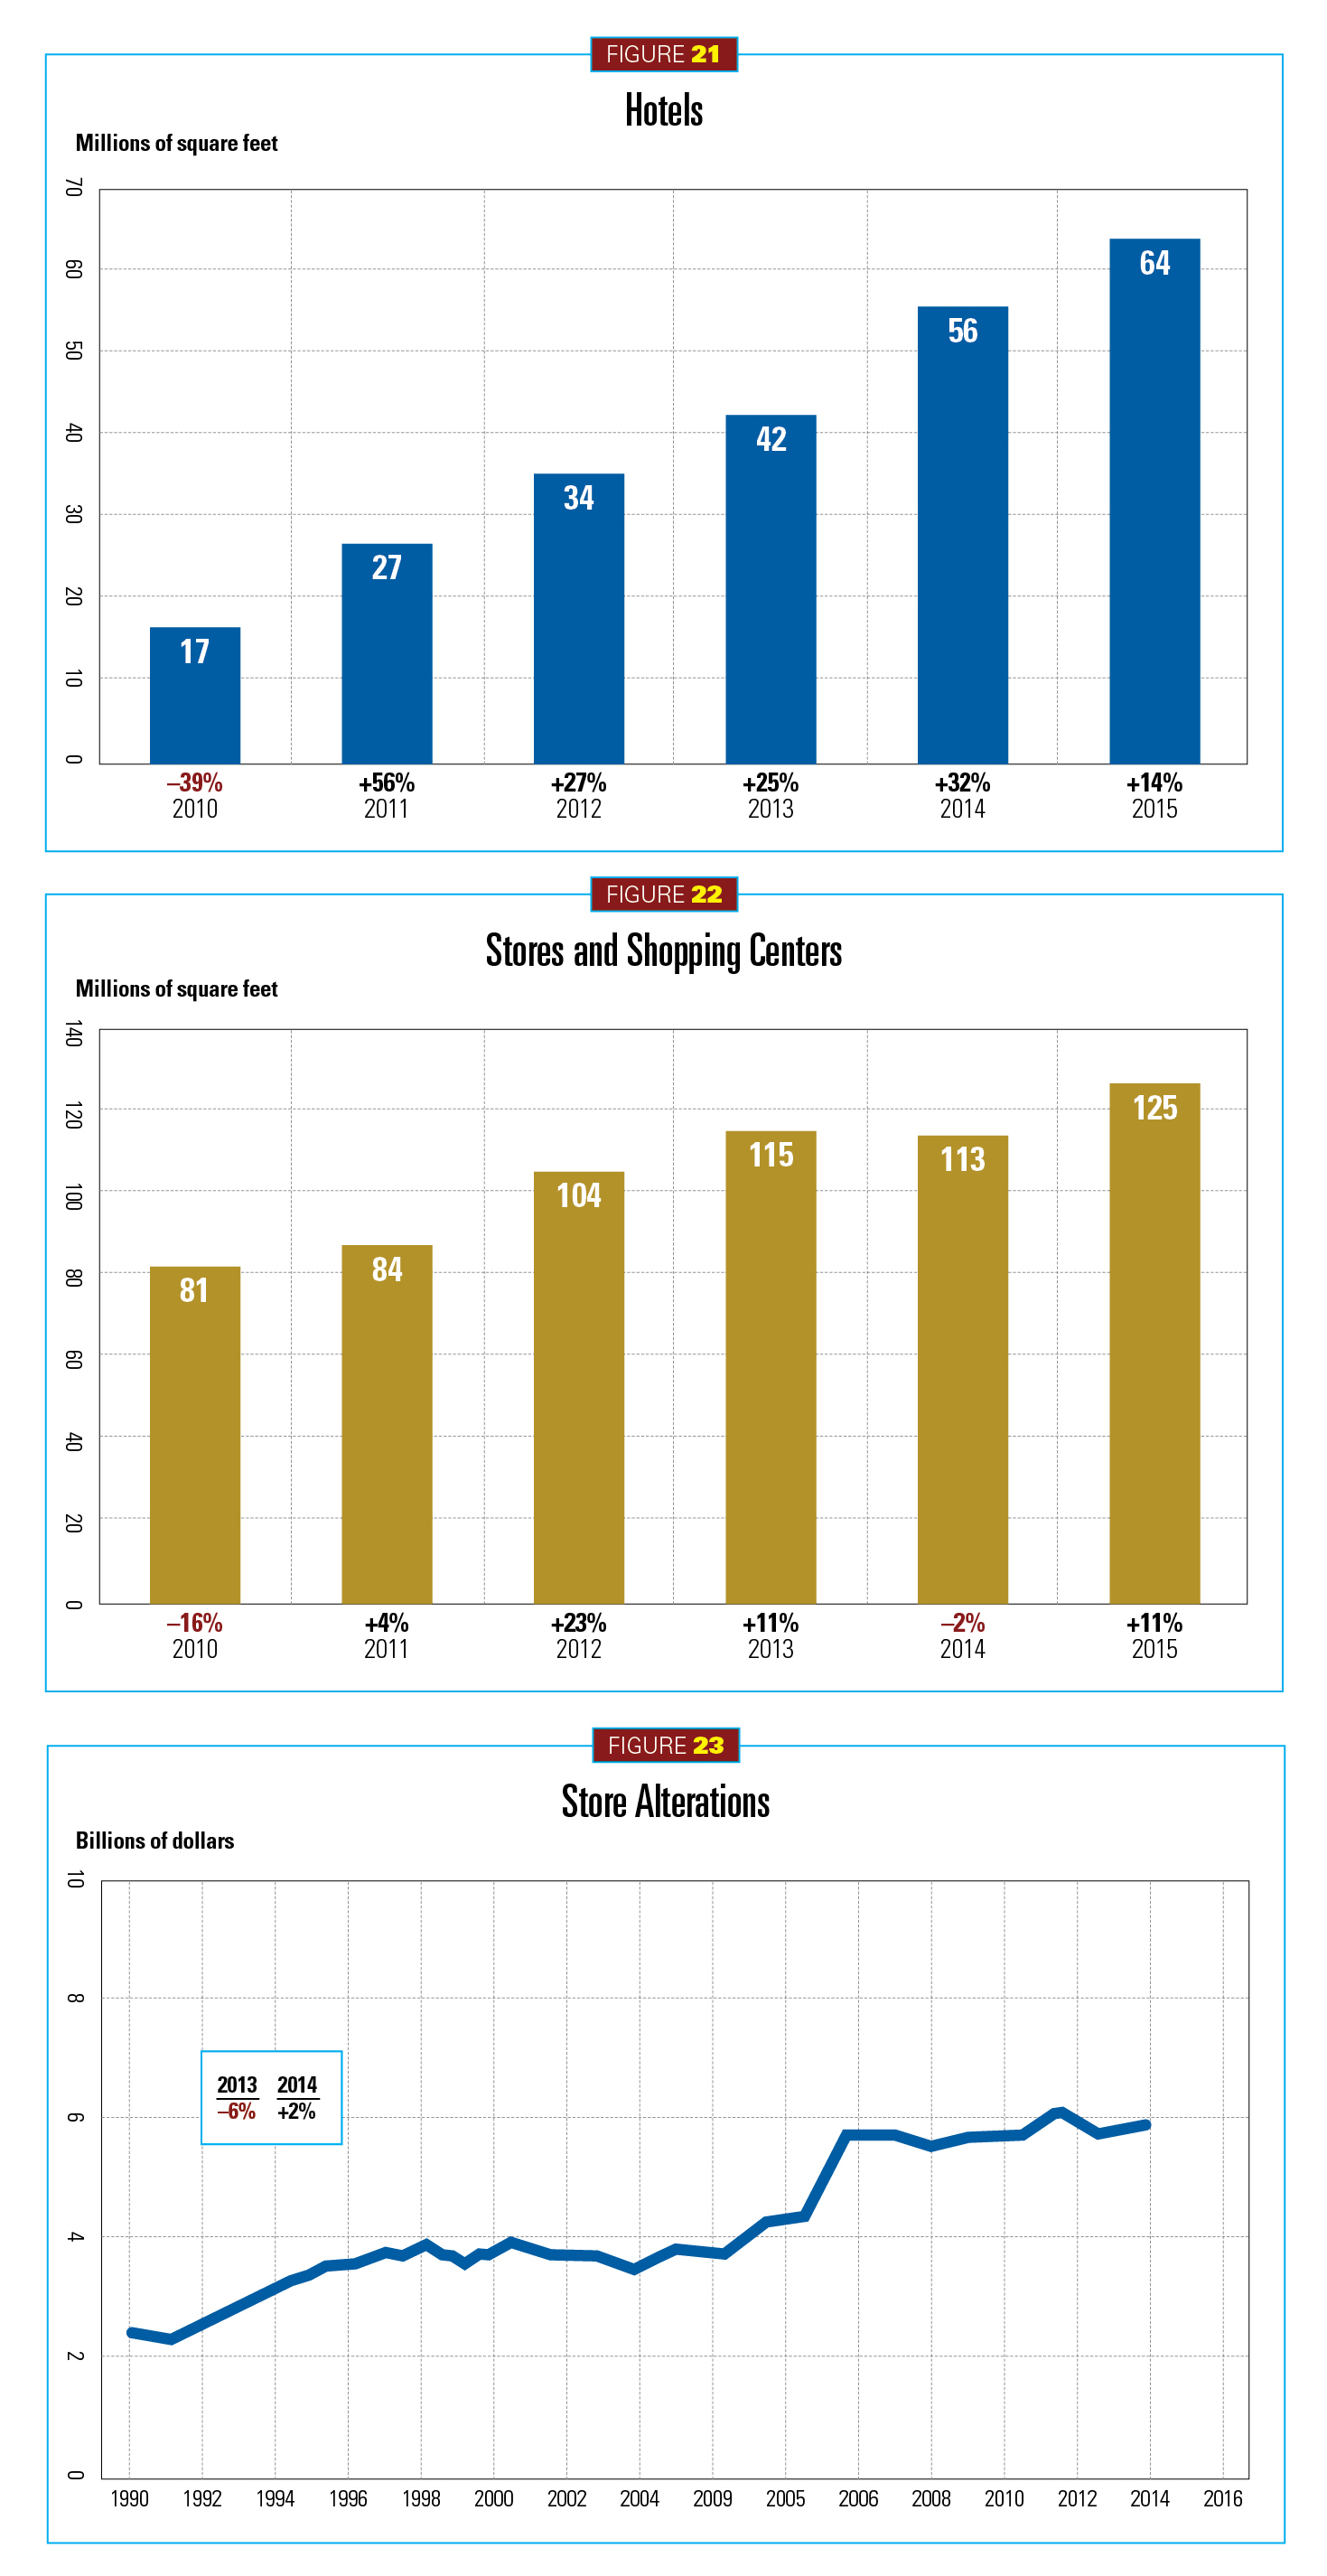
This past year, hotel construction was on a roll, building on strong 2013 activity. Growth in 2014 clocked in at 32 percent (56 million square feet) and $11 billion. This year, less growth is expected, but it should include a healthy gain of 14 percent (64 million square feet) and 17 percent ($12.9 billion) (see Figure 21).
Favorable market fundamentals continue to propel this sector. According to Smith Travel research, occupancy rates during the first nine months of 2014 were up 65.9 percent, a 3.5 percent increase from 2013. A lift was felt across all property rates. A number of big projects are in the pipeline for 2015.
The top projects in 2014 include the following: the Marriott Marquis Hotel in Houston ($272 million); the Convention Center Hotel in Cleveland ($260 million); and the Trump International Hotel in Washington, D.C. ($200 million), a conversion of the Old Post Office Building.
Retail
Stores and shopping center construction slowed some 6 percent in 2014 after three years of strong growth. Though declining 2 percent last year to 113 million square feet, dollar values increased 2 percent to $17.1 billion. Some weaknesses in single-family housing and a pullback in consumer spending tightened the margins for large retailers. This year, construction is expected to grow 11 percent (125 million square feet/$18.9 billion) (see Figure 22). Store alterations are also on the rise, up 2 percent in 2014 (see Figure 23).
Some major retail chains did move ahead with their expansion plans during the first nine months of the year. Wal-Mart built new stores and began remodeling existing ones ($1.8 billion). Discount stores including Dollar General, Family Dollar and Dollar Tree all saw growth, breaking ground on construction projects totaling $82 million to $161 million. Costco and Target reawakened in 2014 with $116 million and $99 million in new construction, respectively. Home supply stores expanded too, including Menards ($193.3 million) and Lowe’s ($47.8 million). Grocery chains, brand-name pharmacies and fast-food restaurants rounded out dominant construction activity.
The top three projects included a redevelopment of the International Market Place in Honolulu ($216 million); Mountain Grove in Redlands, Calif. ($138 million); and Bloc Downtown in Los Angeles ($80 million). Viewing starts by state, Texas led by a large margin. Store construction there represented nearly 12 million square feet. Florida was second at 6.5 million square feet, followed by California at close to 6 million.
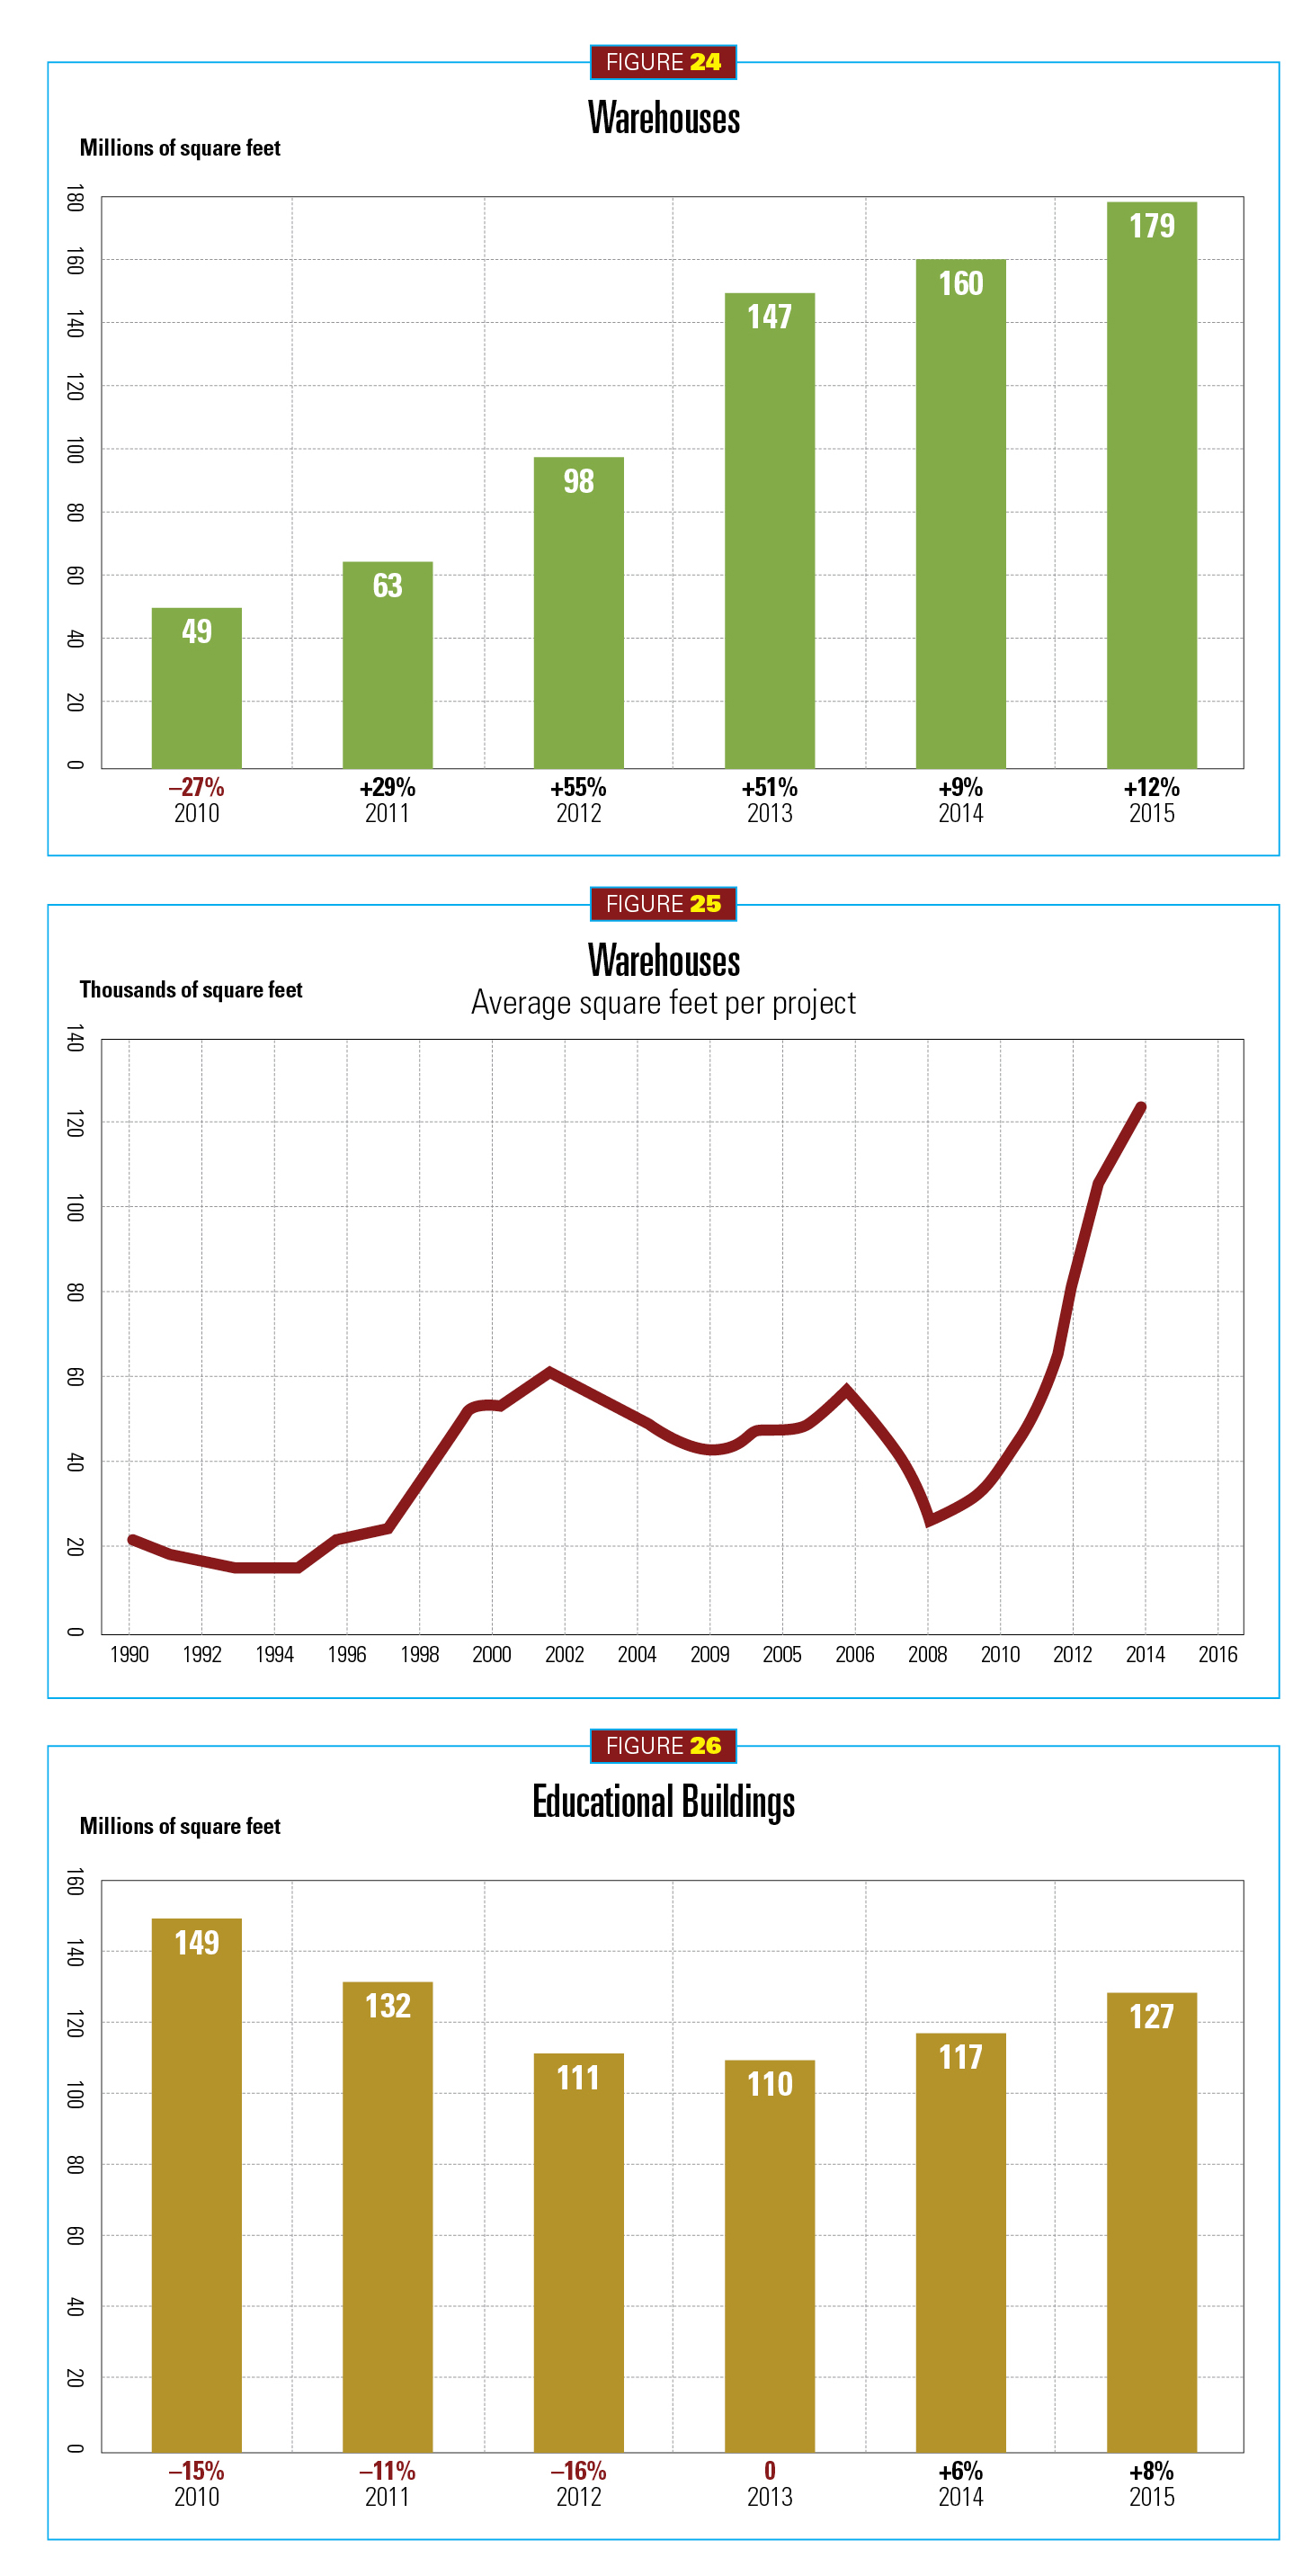
Considered part of the retail sector, commercial warehouses growth did slow between 2011 and 2013. Starts nevertheless grew 9 percent in 2014 (160 million square feet) and 15 percent ($10.3 billion). In 2015, activity will expand to 12 percent (179 million square feet) and 14 percent ($11.7 billion) (see Figure 24).
Kroger constructed a building in Forest Park, Ga. ($90 million).
E-commerce, which represented 6.4 percent of all retail activity in 2014, continued to fuel this building sector. Amazon.com added three new distribution centers in Baltimore, Chicago and Tampa, Fla.
Of note, it is also set to open its first physical store in Midtown Manhattan. Brick-and-mortar retailers also got into the e-game. For example, Urban Outfitters built a warehouse in Gap, Pa., representing $105 million.
The institutional sector— A beleaguered market breaks its fever
After a five-year decline, the institutional sector reversed course, growing by 1 percent (288 million square feet) and 4 percent ($95.3 billion). In 2015, that gain is expected to grow an estimated 8 percent (311 million square feet) and 9 percent ($103.6 billion). Institutional is no longer a drag on the total performance of construction.
Education
In 2014, total education starts increased 6 percent (117 million square feet) and 7 percent in dollar value ($40.8 billion). The outlook for 2015 is a further increase of 8 percent in square footage (127 million) and dollar value of $44.6 billion (see Figure 26). CMD Group predicts the dollar rise closer to $55 billion.
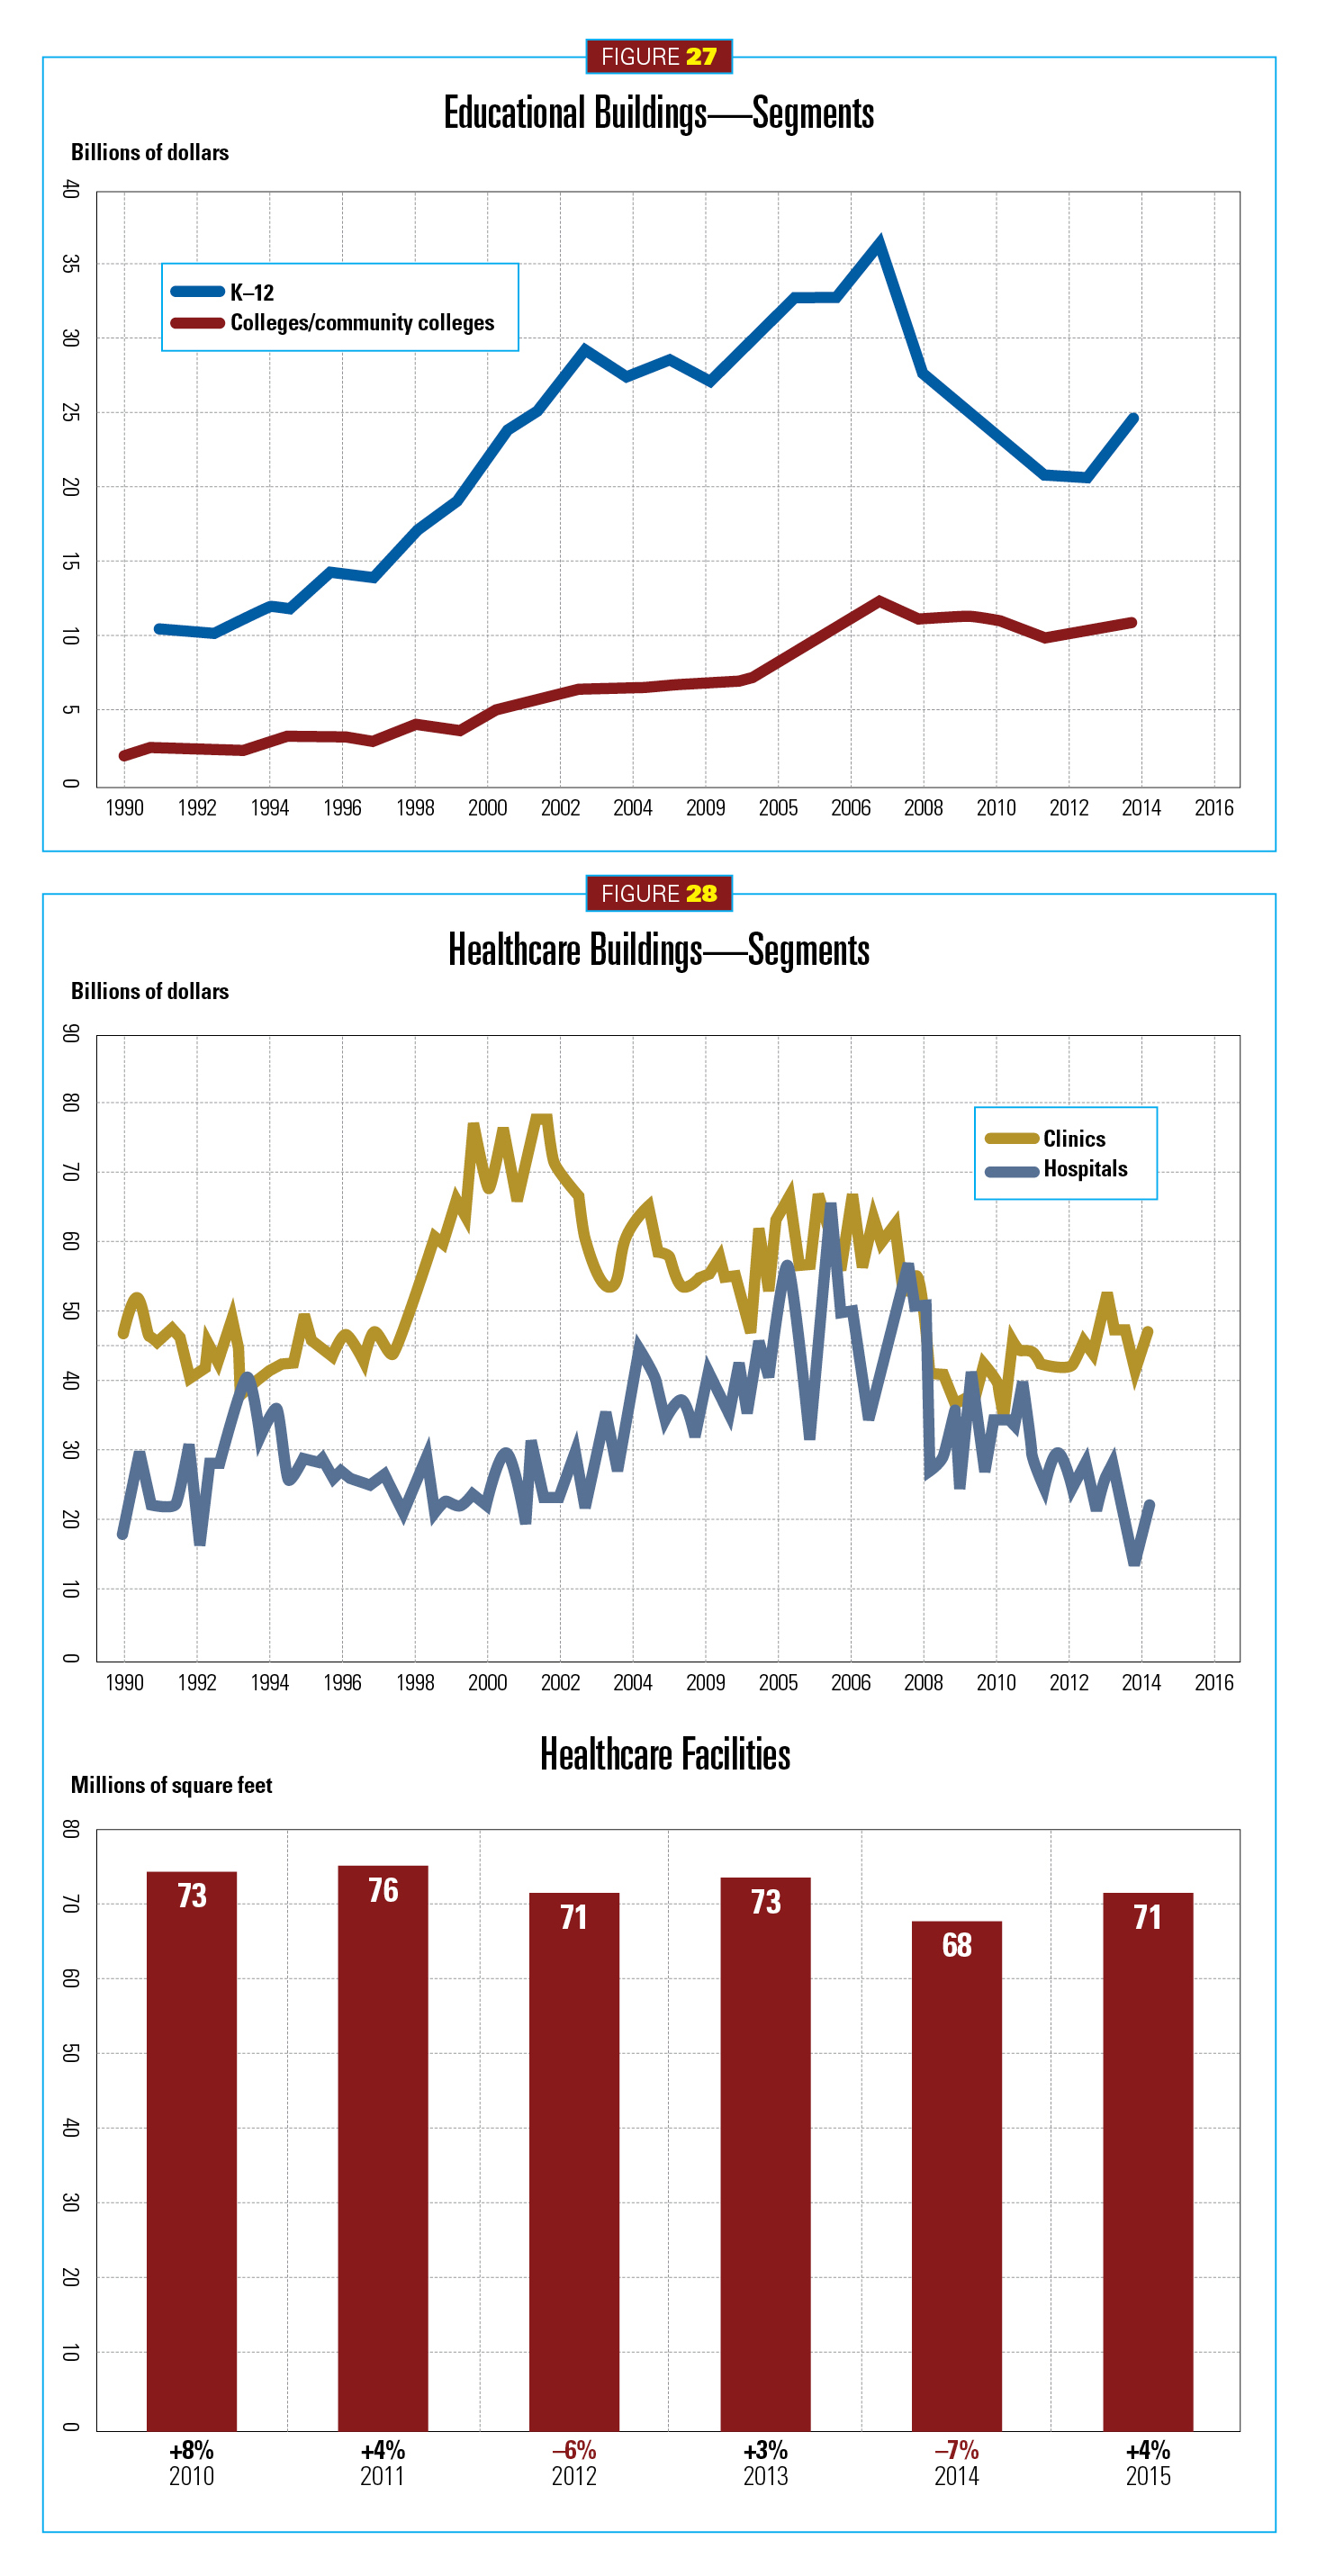
Construction of K–12 schools dominated institutional growth compared to colleges. On average, construction numbers were 10 percent higher in 2014. Junior high schools rose 18 percent, senior high schools were up 15 percent, and primary schools were up 4 percent (see Figure 27).
Texas, New York, Ohio, Michigan and other states all put major bond issues on the ballot during the midterm election in November 2014. A big victor was Texas, as voters approved a $748 million bond referendum for the Katy Independent School District outside Houston.
Another driver for K–12 construction is existing school rehab work. The National Center for Education Statistics (NCES) found that 21 percent of schools are in only “fair” condition and 3 percent are rated “poor.” This means costs to bring such buildings into good working condition could reach $197 billion, or nearly $4.5 million per school. The West is the region most in need of school repair and renovation, averaging 59 percent of schools. The Northeast came in at 49 percent, and the Southeast came in at 45 percent. No hard figures were given for the Midwest.
Construction starts for four-year colleges rose 7 percent in 2014. A subsector representing college-related laboratories and research and development rose an outstanding 45 percent due to funding initiatives for STEM (science, technology, engineering and math). There were declines in community colleges (–8 percent), libraries (–1 percent) and museums (–33 percent).
Noted 2014 education projects included the University of Buffalo’s School of Medicine and Biomedical Sciences in Buffalo, N.Y. ($251 million); a renovation to Princeton University’s 20 Washington Road building ($155 million); and the Denton High School in Little Elm, Texas ($150 million).
Healthcare could use some nursing. Construction slipped 7 percent (68 million square feet) in 2014, yet the dollar value did rise 3 percent ($22.8 billion). Market conditions are expected to improve this year as private financing loosens and the Affordable Care Act (ACA) enters its second year. A gain of 4 percent is expected (71 million square feet) and 6 percent in dollar value ($24.3 billion) (see Figure 28). Figure 28 also shows the fact that clinics have fared better than hospital construction, though both are on the uptick.
Several factors are holding this institutional subsector down: political talk of ACA repeal, fiscal cliff drama, cuts in federal funding for Veterans Administration hospital construction, and hospital mergers. As the economy strengthens, the ACA matures and the futures of Medicare and Medicaid are clarified, the picture should brighten. Aging facilities and a growing elderly population also reveal a strong hand for future healthcare construction. CMD Group’s Carrick shared a fascinating statistic.
“Centenarians [100 year olds] will number as many as 500,000, or the size of Reno, Nev., by 2050,” Carrick said.
Major projects in 2014 included the CPMC Van Ness & Geary Campus Hospital in San Francisco ($900 million), the Kaiser Permanente Central Hospital in San Diego ($820 million) and the Kimmel Pavilion Clinical Medical Facility in New York City ($800 million).
Public buildings
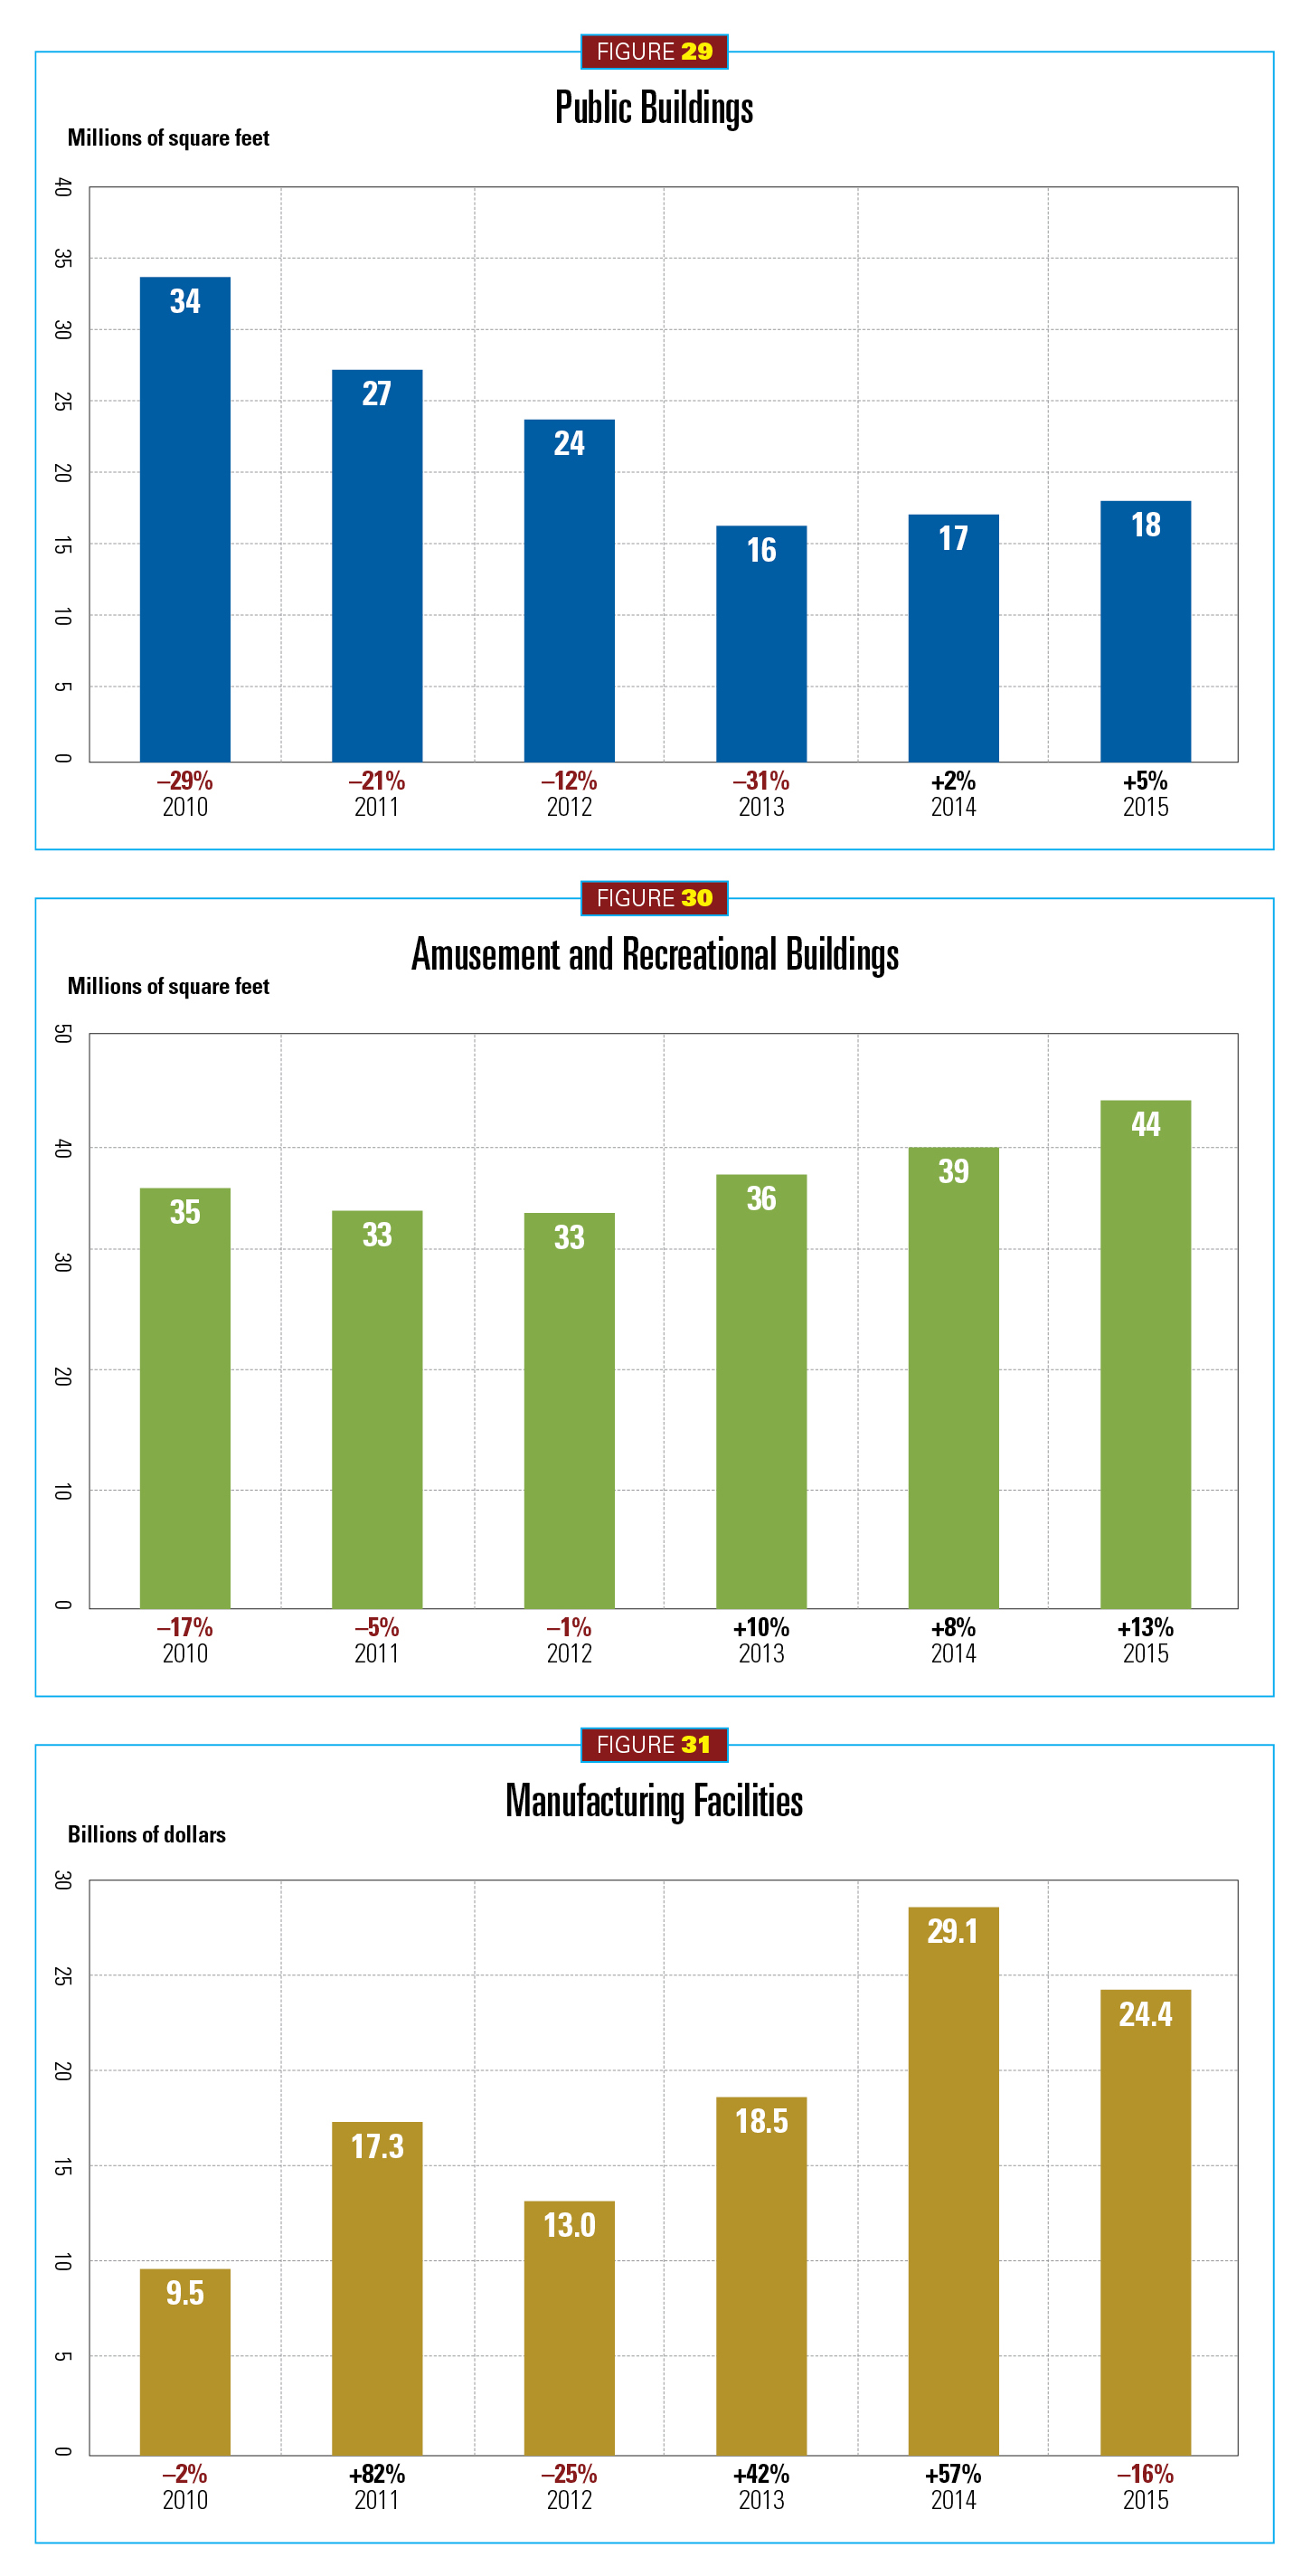
Thanks largely to major courthouse projects, this was another sector pulled from the ashes after four years of double-digit declines. In 2014, public building construction grew 2 percent (17 million square feet) and 8 percent ($7.1 billion). In 2015, starts are expected to rise to 5 percent (18 million square feet) and 6 percent ($7.5 billion) (see Figure 29).
Courthouse projects in dollar and square footage terms increased an impressive 63 percent based largely on four projects, three of which are located in California. The top two included San Diego County Central Courthouse ($317 million) and the U.S. Courthouse and Federal Building in Los Angeles ($317 million).
Religious buildings
Weakness in religious construction continued in 2014 with a drop of 6 percent (10 million square feet) and 7 percent ($1.7 billion) (not shown). This year should show some improvement, with expected gains of 3 percent (11 million square feet) and 4 percent ($1.8 billion).
While construction activity will remain low, supportive factors are increasing. Charitable donations are improving, which is an important investment factor for religious buildings. Personal giving is rising as well. Though 2014 figures were not available, the Atlas of Giving found donations to religious organizations showed an increase of 8.8 percent in 2013.
Amusement/recreational buildings
This sector continues to advance. In 2014, amusement and recreational construction grew 8 percent (39 million square feet) and 9 percent ($5.3 billion). Improvement will continue this year with starts climbing to 13 percent (44 million square feet) and 14 percent ($14 billion) (see Figure 30).
Six projects valued at more than $100 million broke ground during the first nine months of 2014. The largest is the new Atlanta Falcons football stadium ($948 million), followed by the casino portion of the National Harbor MGM Casino Resort ($717 million) in Oxon Hill, Md., and the MGM/AEG Arena ($375 million) in Las Vegas. Investors remain keen on this sector as several major projects are expected to commence construction soon.
Transportation terminals
Though some big projects dominated this sector, starts in 2014 were 8 percent below 2013 figures. Market size stood at 17 million square feet and dollar value at a seven-year low of $5.3 billion, an 18 percent decline. This year, starts and dollar value will both increase for the first time since 2006; 13 percent (19 million square feet) and 11 percent ($5.9 billion) (not shown).
Positives include the launching of projects long in development. Capital spending for airport-related projects will also remain strong. Through 2015, the Federal Aviation Administration will provide key funding of $3.35 billion for airport terminals and infrastructure. Increasing air traffic and rising airline revenue is also helping to support capital spending. One assist for this sector will come if Congress passes a new multiyear surface transportation bill.
The manufacturing sector—On balance, a outlook moving forward
A roller coaster is an apt metaphor for manufacturing facility construction (see shape in Figure 31). In 2011, new manufacturing plants gained 82 percent in dollar terms. The following year, contracting saw a pullback by 25 percent. Starts nearly doubled the following year (42 percent). In the first nine months of 2014, work began on 25 manufacturing plants valued at $100 million or more. Fifteen of those were chemical and/or energy-related. In total, manufacturing plant construction likely jumped an impressive 57 percent ($29.1 billion) and 54 million square feet (3 percent) in 2014 (see Figure 31). With the completion of some big projects, the construction forecast for 2015 is smaller in dollar terms, falling back 16 percent ($24.4 billion) but a 13 percent rise in square footage (61 million). Here, CMD Group estimated dollar starts more conservatively at 9 percent.
“I see a big turnaround down the road for manufacturing that should remain strong for several years,” Simonson said.
Manufacturing plants representing semiconductors, automotive assembly and tire manufacturing all broke ground in 2014. In other good news, capacity utilization stayed relatively high. It reached 78.1 percent last September, and the rate should increase in 2015 driving plant construction.
Major projects in 2014 included several billion dollar chemical plants including the Chevron Phillips ethylene plant ($3 billion), a semiconductor facility in Oregon ($450 million), and an ore-processing plant in Texas ($370 million).
The public works and electric utilities sector—Waiting on Congress
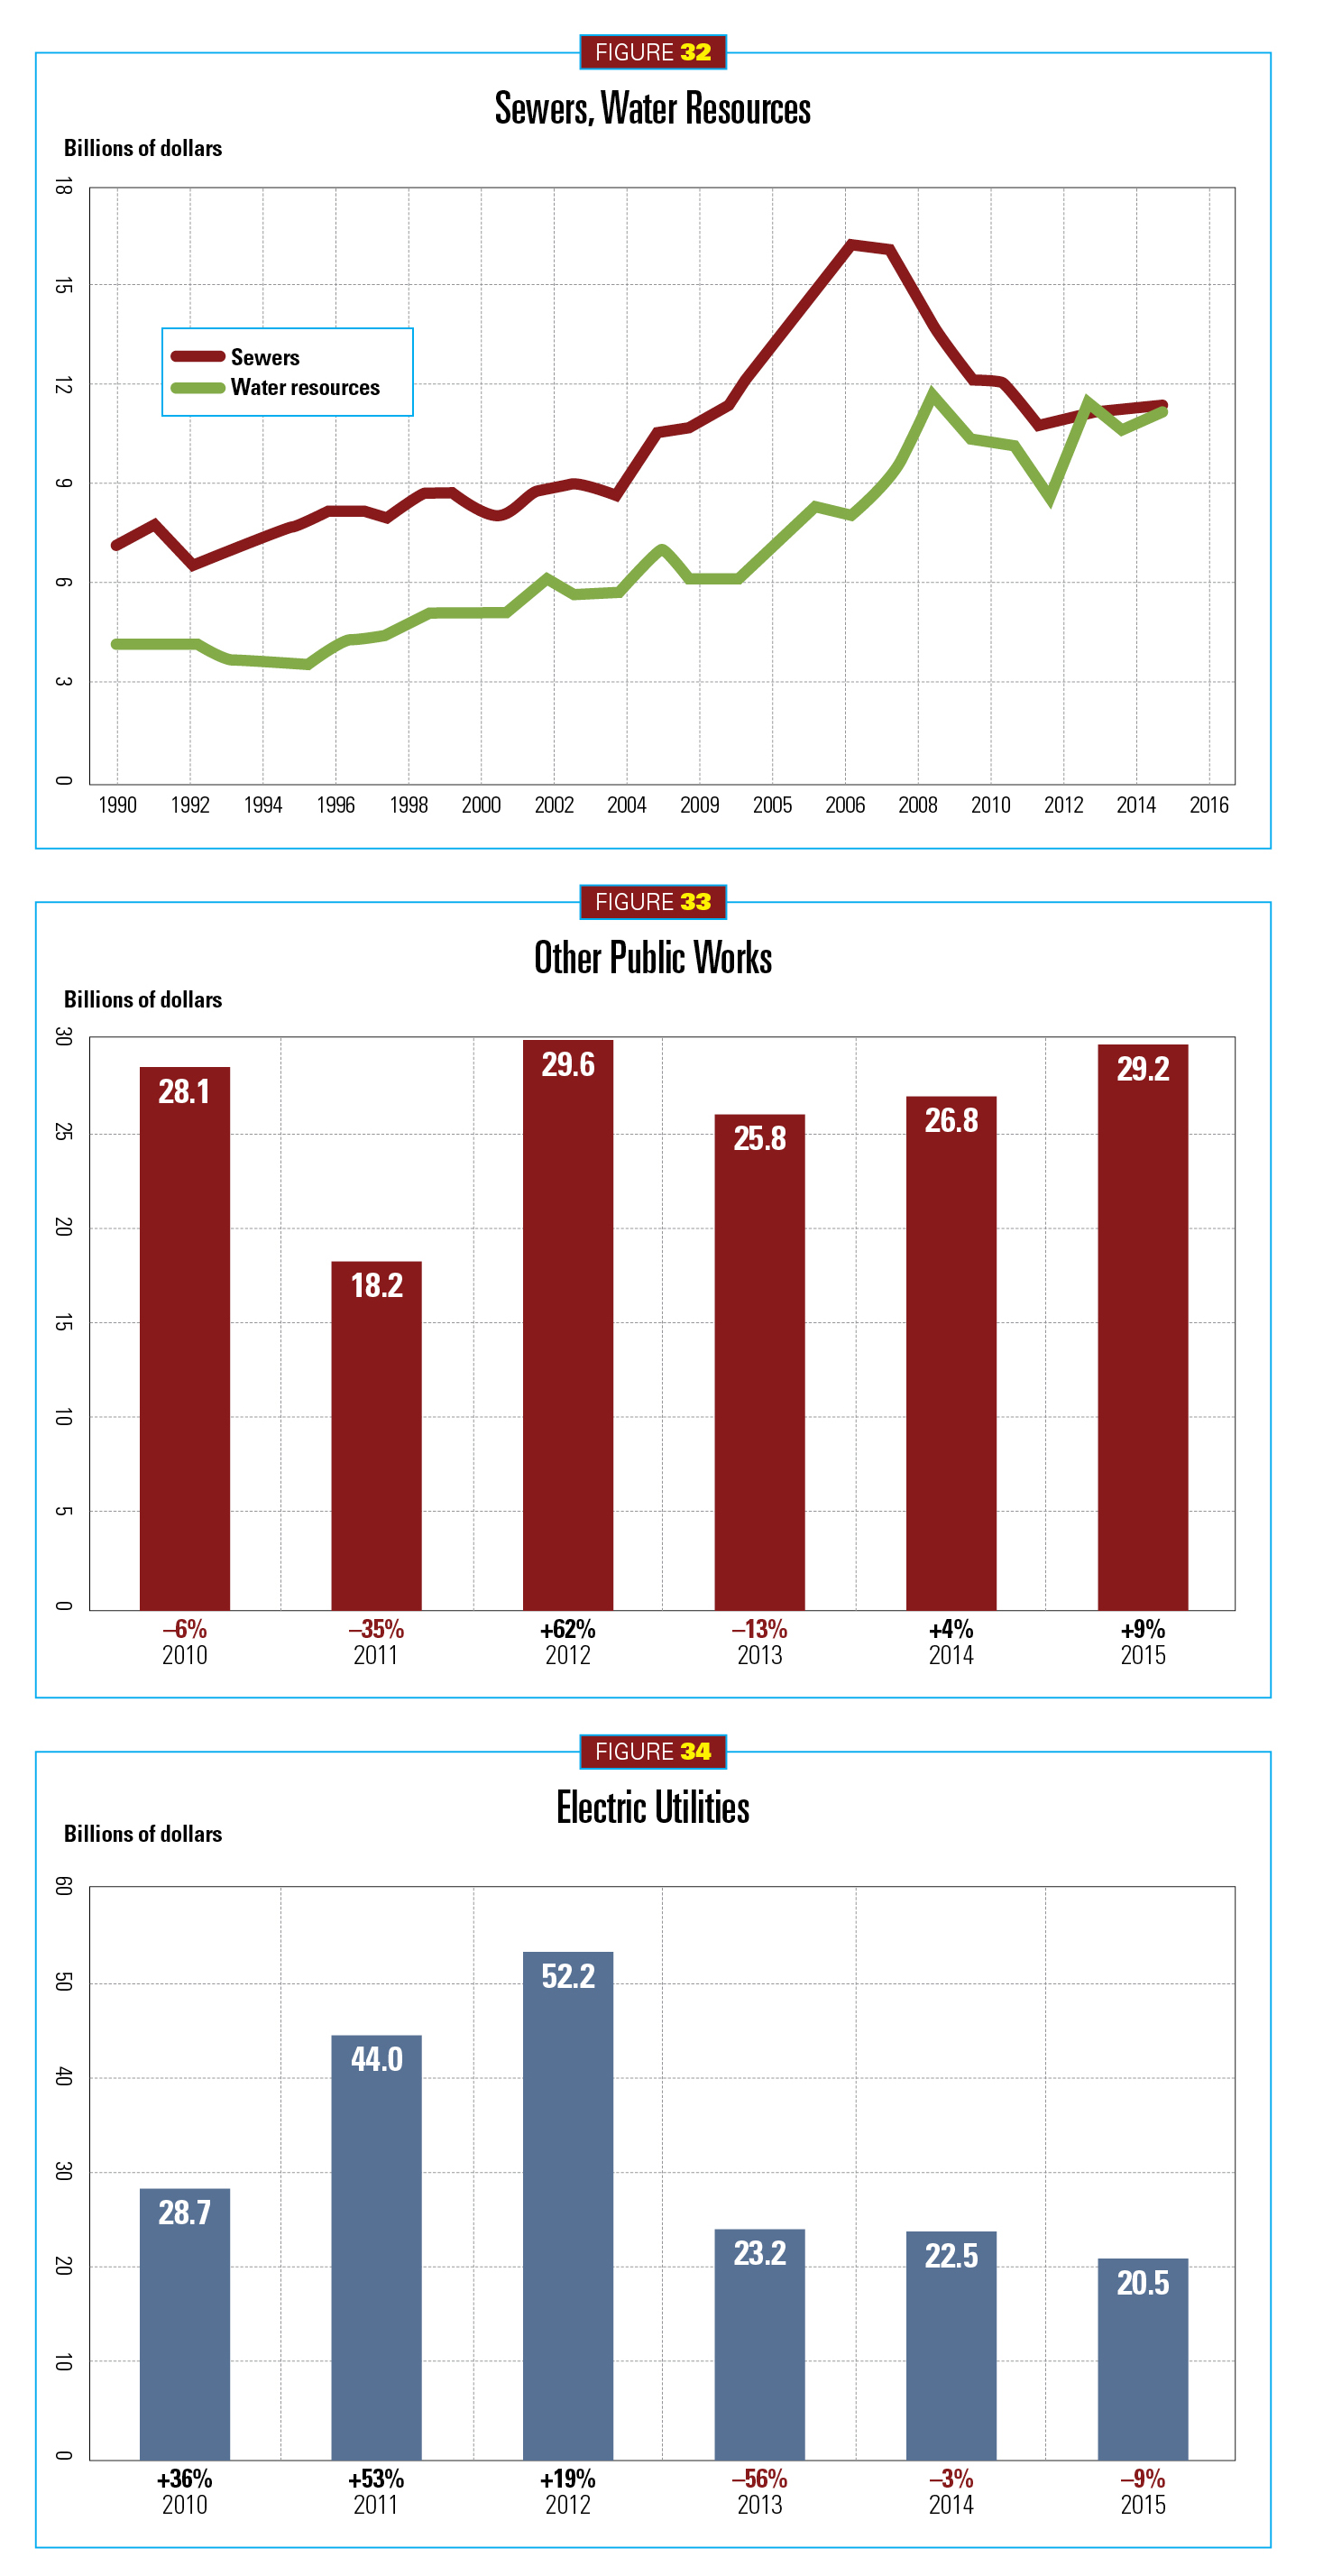
After a strong 2013 and the completion of some big projects, water and sewer projects took a hit in 2014, landing at $113.4 billion (see Figure 32). The CMD Group placed starts higher at $24 billion. This year looks a little unclear. The 2015 federal appropriations were just passed, and it will take some time to sort out what it all means. Fortunately, the Highway Trust Fund is solvent through May. State and localities are also finding their own funding through user fees, bonds and public-private partnerships. Such efforts will help support a lesser rebound for 2015, projected at a 5 percent gain ($118 million) or greater ($128 million). Looking to electric utilities and gas plants, their rate of decline from 2013 (56 percent) has much improved, though it’s still in the negative column. In 2014, its retreat was only 3 percent. This year, it may increase a bit to 9 percent.
Transportation public works
Again, 2013 was so good for this sector that 2014 could only disappoint. Highway and bridge construction set a record $65.7 billion in 2013. Activity last year never had a chance without the support of the previous year’s stimulus dollars, so construction fell 17 percent to $54.8 million. The forecast for transportation public works in 2015 is set at a 3 percent increase ($56.5 billion).
The three largest projects in 2014 were the Gerald Desmond Bridge replacement in Long Beach, Calif. ($650 million); a replacement bridge project in Cuyahoga County, Ohio ($272 million); and the I-90 bridge in Albany, N.Y. ($146 million).
Environmental public works
After some major projects drove environmental public works to a 14 percent increase in 2013, fewer big projects in 2014 dropped this sector’s performance to 4 percent ($31.8 billion). Within that is a 9 percent decline for water supply systems and a drop of 6 percent for river/harbor development. This year, the retreat turns into an advance, with environmental projects increasing 4 percent ($33.1 billion). Water supply systems will be up 6 percent; river/harbor development 4 percent; and sewer systems increasing 3 percent.
This sector is affected as well, as it waits for 2015 federal appropriations, but it will benefit from the new Water Resource Reform and Development Act of 2014 (WRRDA), a rare example of bipartisan congressional cooperation that became law last June.
Some big projects in 2014 included the Back River waste treatment plant in Baltimore ($285 million) and the Anacostia River Tunnel in Washington, D.C. ($240 million).
Other public works
This category saw a rebound of 4 percent in 2014 ($26.8 billion). Another gain of 9 percent is expected in 2015 ($29.2 billion) (see Figure 33). The 2014 turnaround can be attributed to strong rail-related work. This year’s gains anticipate an increase in pipeline projects.
Higher mass transit ridership has helped this sector. In 2014, track and rail bed construction increased at least 72 percent. Enough work is lined up in 2015 to keep this sector moving, but it too awaits federal approval of 2015 appropriations, in this case from the Federal Transit Administration and the Highway Trust Fund. In terms of airport runway and taxiways, this segment remained relatively stable in 2014, seeing construction starts averaging as much as $2.3 billion. Activity in 2015 is expected to average $2 billion.
Pipeline construction declined in 2014, but not for lack of work stimulated by the Pipeline Safety, Regulatory Certainty, and Job Creation Act, paired with the substantial volumes of natural gas and natural gas liquids processing in the United States. The problem was and is one of lengthy rigorous government review. Construction dropped $4.6 billion in 2013. Last year saw less of a drop, in fact there was some growth, as much as 8 percent or $90 billion, according to CMD. Firm projections were not given for 2015, but McGraw-Hill’s Murray said, if passed, “Keystone’s start in early 2015 cannot be ruled out.”
Electric utilities
It’s good news when your negative ledger diminishes. That’s been the case for the electric utility construction segment. Utility construction fell a whopping 56 percent in 2013. In 2014, the market firmed up substantially, improving to a 3 percent drop ($22.5 billion) (see Figure 34).
A dip to $20.5 billion, or –9 percent, is projected for 2015 as the market awaits President Barack Obama’s proposed Clean Air Act carbon-pollution standards. These proposals continue in their consultative phase followed by state implementation plans, expected no later than June 1, 2016. Stricter pollution standards for utilities and other power producers could propel construction activity, with utilities building new natural gas fired plants and/or retrofitting their coal plants. In addition, ongoing efforts to create smart grids and integrate renewable- and alternative-power sources will promote construction of transmission and distribution lines. In its last Long-Term Reliability Assessment, The North American Electric Reliability Corp. (NERC) reported that the electric power industry planned to build 18,300 miles of new transmission and distribution capacity between 2013 and 2018. Another 6,800 miles of transmission capacity is under review.
Noted projects in 2014 include Future Gen’s coal-fired power plant retrofit in Illinois ($1.7 billion), a liquid fractionators facility in Texas ($1.7 billion), and the Port Everglades natural gas plant in Fort Lauderdale, Fla. ($1.2 billion).
Going back to the beginning
As shown by Figure 2, what goes down in the construction market eventually goes up. Of course, the reverse is also true. What the construction industry experts predict is that we’re back on the upswing portion of the cycle, so get ready, hold on to your hardhats, and enjoy the ride toward the next boom.
About The Author

GAVIN, Gavo Communications, is a LEED Green Associate providing marketing services for the energy, construction and urban planning industries. He can be reached at [email protected].