Wind power is now well-established and enjoying impressive growth. Federal assistance disappears after 2019 (for the most part), so the growth may slow, but for how long is debatable if wind-power electric rates remain competitive. For now, many wind projects are in the pipeline as everyone takes advantage of incentives before they expire. Productivity, technological advances, and expected future cost parity with natural gas is expected to keep wind a contender.
Over the past decade, U.S. wind power has more than tripled. According to the American Wind Energy Association (AWEA), Washington, D.C., there are more than 54,000 wind turbines providing a combined capacity of 89,379 megawatts (MW) operating in 41 states, Guam and Puerto Rico. In 2017, the domestic wind industry grew by 9 percent (7,017 MW) and added 406 MW in the first quarter of 2018. The AWEA states wind now leads in U.S. renewable generating capacity.
For perspective, the amount of electricity wind generated in 2017 was enough to power 24 million homes and represented 6.3 percent of the nation’s electricity. By 2020, wind power is projected to be 22 percent of all electricity generated.
“We are approaching a leveled cost of energy,” said Tristan Grimbert, president and CEO of EDF Renewables, San Diego. “In windy regions, costs can drop to 1 cent per kilowatt, so wind actually competes with other wind companies—wind on wind. We forecast wind power will be cost-competitive with natural gas by 2022.”
Tristan listed what he called “first order drivers” that will help wind energy continue to grow. These include more efficient and effective turbines with taller towers and bigger blades and technology to optimize power generation to lower costs and keep wind power competitive.
With three-quarters of the states generating wind power of some measure, the top five are Iowa (37 percent), Kansas (36 percent), Oklahoma (32 percent), South Dakota (30 percent), and North Dakota (27 percent). The strongest wind resource regions are the Midwest, Great Plains and Texas. Texas leads in wind-industry employment with 24,000 people. In 2017, the U.S. wind industry supported 105,500 jobs.
Utilities remain the biggest investor with 8,400 MW of wind power being developed or constructed under their ownership. Nonutility companies exceed 9,100 MW attracted to wind’s falling costs and long term pricing programs. The largest procurer of wind power by a wide margin is AT&T, followed by Amazon, Facebook, Microsoft and Dow Chemical.

When price supports fade
The federal renewable-energy Production tax credit (PTC) and the investment tax credit (ITC) have been instrumental in promoting wind energy as a viable renewable-energy provider. Both have attracted interest and investment in new wind farms. The PTC was enacted in 1992, creating an inflation-adjusted, per-kilowatt-hour (kWh) tax credit for electricity generated by wind, geothermal, closed-loop biomass and solar. The wind credit is on a three-year draw-down having moved from an 80 percent tax credit to 60 percent and finally 40 percent, ending after 2019. The ITC, a corporate tax credit (rebate) is undergoing its step down. Currently, rebates for wind and solar stand at 30 percent but drop to 10 percent in 2022.
State incentives could remain. A current list can be found at the Database of State Incentives for Renewables and Efficiency (dsireusa.org), curated by DSIRE, a program funded by the U.S. Department of Energy.
Bruce Hamilton is director—energy practice for Navigant Consulting, is a global professional services firm based in Chicago. It advises on issues of wind power market entry and auction bidding and provides feasibility studies, and operations and maintenance (O&M) strategy development.
In May, Hamilton spoke at the AWEA WINDPOWER conference in Chicago. His firm sees 57 gigawatts (GW) of wind- generated power by the end of the decade (a recent 15 percent projected increase) representing 53 GW onshore and 4 GW offshore. Sixty-five percent of projects that were under construction on Jan. 1, 2018, will be completed by year’s end. Wind turbines, representing an additional 50-plus GW, have been safe harbored to qualify for the PTC.
“Navigant estimates 73 GW of coal-fired units will be retired over the next decade, exceeding what was forecast with the Clean Power Plan,” Hamilton said. “Shale gas supply will get natural gas under $4 per MMBtu through 2025, both helping wind compete.”
Projecting out to 2027, Hamilton said wind could represent a 33 percent addition of U.S. power generation (power produced over time); 12 percent of total capacity (maximum electric output). Interestingly, of the 13.3 GW of 2017 wind project construction, 80 percent was built in states that have no immediate renewable portfolio standard (RPS) requirements.
“Despite lower natural gas and solar prices, Navigant’s 10-year wind forecast has increased since 2017 due to more coal retirements, the solar tariff, and a growing offshore market,” Hamilton said. “Improvements in storage, demand response, electric vehicle [EV] integration and better wind-turbine frequency regulation will help to facilitate issues around wind integration.”

A bullish outlook?
With federal incentives soon to expire, now would be the time for investors to invest, developers to develop, and wind farms to add turbines. David Hostert, head of wind energy research for Bloomberg New Energy Finance (NEF) in London, is looking at U.S. wind’s future, following the end of incentives.
“Wind-energy prices have come down quite a bit,” he said. “Power purchase agreements continue to evolve and corporations are taking note. Corporate demand (wind power) stays strong. Utilities continue to chase low-cost wind and regulated returns. Smart technology as applied to wind energy is delivering tangible gains. We need more of all of this to keep wind going. Favorable electricity hub/node pricing will help.”
Bloomberg estimates a gross forecast of wind generation at 34 GW by 2020, and 57 GW by 2025. Its net forecast is, respectively, 30 GW and 50 GW.
Hostert also cited a number of other positive impacts that include steadily falling price of wind turbines (at its lowest in 2017), gains in performance; better siting which reduces development costs, predictive maintenance software, and improved forecasting.
“The O&M industry within the wind industry is exploding,” said Aaron Barr, a Boston-based principal consultant with analytics firm Wood Mackenzie. “Wind operators are trying to convert to planned maintenance and lower operational cost. Digital technology is helping to unleash savings.”
Drivers of offshore wind and storage
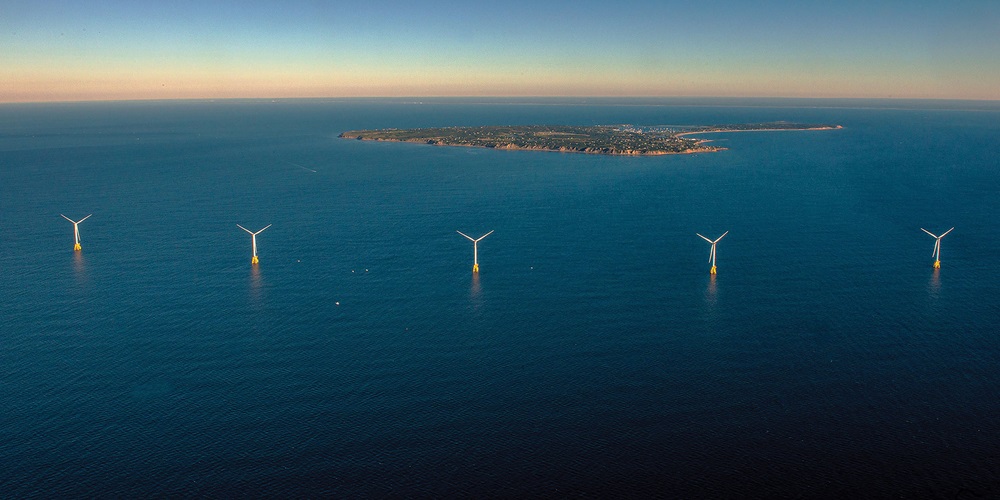
The prospects of domestic offshore wind production were raised by many speakers at WINDPOWER. While popular in Europe, its U.S. potential is newer and often tethered by governmental policies. Though offshore is very expensive today, its power generation is close to the load. It also brings development to ports.
Navigant projects that 3.9 GW of offshore wind will be installed by 2027 in Northeastern and Mid-Atlantic states. A number of states in that region have legislation for wind power, request for proposals, and, in the case of Maryland, offshore renewable energy credits. Bloomberg sees an established market by 2028 and projects 6.2 GW of U.S. wind power by 2030. Costs may be higher than Europe at the outset.
“Cheap offshore wind is real, but you need to pay to get on the curve,” Hostert said. “The real costs are infrastructure.”
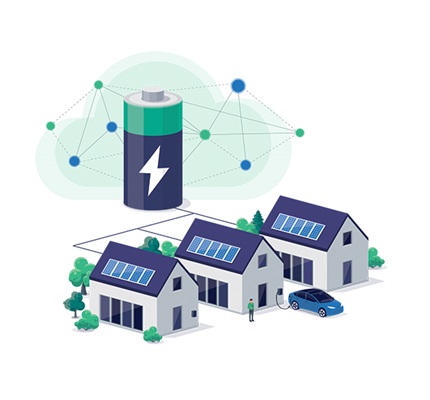
Hostert also raised the issue of power storage.
“Wind needs to get into this,” he said. “Maybe storage of wind-generated power is programmed, tapped for power in the evening.”
Grimbert added wind-generated power storage will be challenging.
“Predictably is an issue with wind,” Grimbert said. “The ratio of generation capacity versus storage will be different. You may store at a good clip during windy days but then go days without wind as you deplete what you stored. You could perhaps level out storage production with different wind regimes picking up power from different farms where the wind is blowing.”
Nonetheless, Grimbert saw wind- generated power storage as another tool adding to grid stability. Its practice is maybe 10 years out, Grimbert guessed, but it could also trigger creative applications such as “storage on wheels” in the form of mobile EV charging stations.
“When it comes to power storage, wind will be a better choice in one region, solar in another,” he said. “There will certainly be those instances where co-location (combination solar/wind farms), could together contribute to clean-power storage.”
Battery development will help sell storage, as well. In a June 2018 press release, Bloomberg NEF said this about clean energy storage, “Wind and solar are set to surge to almost ‘50 by 50’—50 percent of world generation by 2050—on the back of precipitous reductions in cost, and the advent of cheaper and cheaper batteries that will enable electricity to be stored and discharged to meet shifts in demand and supply.”

Competing with solar
“Wind and solar compete on price with regional variation,” said Max Cohen, associate director at IHS Markit, a global research and analysis company headquartered in London. “Wind is cheapest in the middle of America, solar in the Southwest. So how do you lower price of wind? Through better blades (including longer for bigger capacity) and operation technology. OEMs could help boost builds after PTC winds down, too. If proposed projects go forward, utility wind ownership jumps from 20–40 percent. Wind energy operates among a patchwork of evolving state and provincial policies. It can compete in the right locations.”
In looking at U.S. renewable capacity additions, IHS sees solar and wind each grabbing comparable capacity, with the exception of a couple years (2021–2023) where solar leads.
“In a post-subsidy world, wind and solar is competitive through prices, though costs will remain tougher for wind in some regions,” Hostert said.
About The Author

GAVIN, Gavo Communications, is a LEED Green Associate providing marketing services for the energy, construction and urban planning industries. He can be reached at [email protected].