You're reading an older article from ELECTRICAL CONTRACTOR. Some content, such as code-related information, may be outdated. Visit our homepage to view the most up-to-date articles.
Recently, a knowledgeable colleague said we really don’t need precisely aligned, continuously sampled and calculated harmonics to get an accurate picture of what the average harmonics are. Usually, we are concerned with harmonics as they cause losses in electromagnetic devices that increase as square of the harmonic number.
It makes sense with the old adage for what power is: “Twinkle, twinkle, little star, P equals I squared R.” If you replace R for resistance with Z for impedance and then go back to the formula for impedance of an inductor (the root of motors and transformers) being proportional to the inductance times the frequency, the power of the harmonics is proportional to the square of the frequency.
Hence, the primary concern is the heating effect in motors, transformers or wires. The average value along with the maximum value are good indications of what is going on. Is an accuracy of 0.1 percent of the increase in heat meaningful in the life of the motor? Instead, you could certainly throw in, along with the average and max, the calculation for 95 percent cumulative probability number, which states that 95 percent of the time, the harmonic value will be equal to or less than X percent.
At an industrial facility with a permanent power quality monitoring system at key points within the facility as well as the service entrance, workers noticed there was an increase in the voltage harmonic levels compared to prior months. It just so happened that there were two different vintage instruments that were both monitoring at the service entrance. One instrument took more than 13,000 harmonic measurements over the three-month measurement window, each one precisely aligned to tens of milliseconds of the 10 minute boundaries. The other instrument was much older and had less than a thousand measurements. Yet, when the results were analyzed, both instruments had the exact same average (2.7 percent), same maximum (5.0 percent) and same 95 percent cumulative probability (3.6 percent), as shown in Figure 1.
This is not to say instruments shouldn’t comply with measurement standards, as getting repeatable and accurate results from different instruments is a plus. It says more is not necessarily better or even needed, depending on the situation. One needs to understand what the equipment susceptibilities are and what is required from a measurement perspective to see if the equipment is being adversely affected by the electrical environment. When harmonics cause a derating in a motor or transformer’s maximum operating point, even a 1 percent instrument taking measurements once a second would probably give you adequate results.
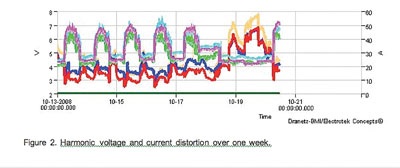
So why did the average voltage total harmonic distortion (Vthd) increase from 2.7 percent in 2007 (Figure 1) to 3 percent for the summer in 2008? Close examination shows the weekend periods had harmonic voltage distortion approximately double the weekdays (Figure 2).
The harmonic currents drop to levels similar to nighttime. The area around the facility has a significant residential population, so it would appear that the activities of the facility contributed more than the industrial facilities, which are nearly all idle on weekends.
The red-blue-yellow lines are the harmonic voltages, and the purple-cyan-green lines are the harmonic currents for phases A, B and C, respectively. Harmonics also follow the same rules of Ohm’s and Kirchoff’s Laws that are used to analyze rms variations, such as sags and swells; namely, harmonic voltage is equal to harmonic current multiplied by harmonic impedance. Since the harmonic voltage increases significantly when the harmonic current decreases, this shows the facility is not the significant cause of the weekend distortion.
Further examination of the harmonic spectrum or components shows the third is clearly the dominant harmonic, with some fifth harmonic and less than 0.5 percent for the seventh harmonic. This is the typical spectrum for single phase rectified input loads, such as PCs, TVs, microwaves, and so on that are found in residential facilities. One would expect to see significant 5 and 7, 11 and 13, and 17 and 19 pairs of harmonics where three-phase full wave rectified power converters loads are present.
Of course, this begs the question, are the harmonic currents on the grid actually that much higher during the weekends than when factories are running, or is it something else causing this effect? More digging is required.
BINGHAM, a contributing editor for power quality, can be reached at 732.287.3680.
About The Author

BINGHAM, a contributing editor for power quality, can be reached at 908.499.5321.