Last month’s article discussed how harmonic content and the source of those harmonics could be identified by their waveform signatures. Transients also have telltale signatures in many cases. The same laws (Ohm’s and Kirchhoff’s) used for analyzing rms voltage variations such as sags and swells also apply to transient analysis. A quick review of sampling theory would be helpful, since transients are usually classified as subcycle events, or disturbances that happen in the microsecond-to-millisecond time frame.
Converting a waveform into useful numbers is governed by Nyquist theory, which says that the rate of sampling of the waveform must be at least twice the frequency of the highest frequency component in the waveform. If you are looking for a 2-millisecond transient, then your PQ instrument must have a sampling rate of 1 millisecond or 1 KHz, as time and frequency are inversely related. If the resulting transient from a nearby lightning strike is a 20-microsecond impulsive voltage transient, the instrument must be capable of recording at 100 kHz or higher. This includes the voltage and current channels, and the probes used to connect to the circuit.
The effects from transients can range from blatant to sneaky: a destructive path, or a subtle effect from notching transients that can still lead to destructive failures over time.
In general, transients are categorized as either impulsive (a single disturbance, such as lightning strike), oscillatory (such as a power factor correction capacitor being energized) or arcing (from contact bounce or fault conditions). Detailed characteristics are:
- The peak voltage or current instantaneous value
- Direction from the sine wave of the fundamental frequency waveform (positive adds energy to the curve, negative subtracts energy)
- Frequency of transient occurrence (random, periodic, every cycle)
- Rise time on the leading edge of the initial transient
- Magnitude and frequency of overshoot or ringing waveform after initial transient
- Phase position on the fundamental frequency waveform where the transient occurs
- Duration of the transient (width of an impulsive transient, duration of ringing signal of oscillatory transient)
- Energy of the transient (usually measured in joules and requires accurate voltage and current measurements)
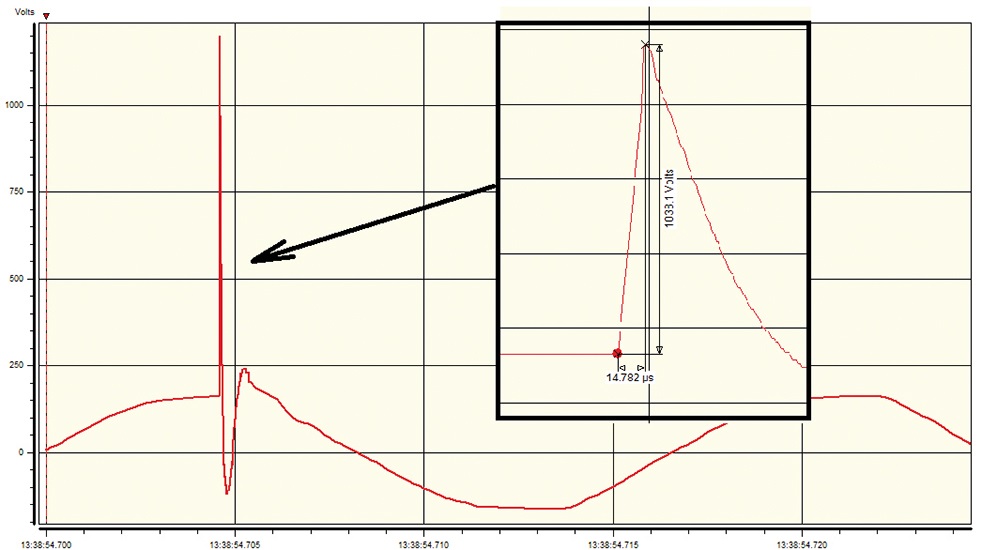
Figure 1 shows the voltage waveform from a simulated lightning strike coupled directly into the wiring. The box is a zoomed-in detail showing the rise time of the leading edge and the transient’s peak magnitude above the normal sine wave of the 120V rms voltage waveform.

Figure 1: Impulsive wave form with details of rising edge
The plot shows a single 1-kV positive impulsive transient occurred at 90-degree phase position with a rise time of about 12 microseconds. Rise time is usually calculated as the duration from 10% to 90% of peak value. There is a subsequent negative 300V x 0.4-millisecond transient and no real oscillatory waves after. No current waveforms were measured, but a proportional current impulsive transient from the energy added by the lightning is likely. Using the same rules for directivity as sags indicates an upstream source.
The relatively fast rise time means the strike was nearby, as the RLC impedance of distribution wiring acts as a filter and smooths out the sharp rise time. The amount of energy in the transient might not destroy the TVSS devices in a surge protection outlet strip the first time, but it would weaken them and make them vulnerable if struck again.
The power-factor (PF) cap switching oscillatory transient is quite common in industrial areas. Cap banks are often switched on in the morning to compensate for inductive loads in the facilities, then off in the evening to prevent the PF from going the other way. Figure 2 shows the three-phase voltage from a PF cap bank being energized on a 20-kV distribution circuit. The A phase waveform is enhanced for clarity. When the uncharged cap bank is energized, a large inrush current occurs, resulting in the negative voltage transient.
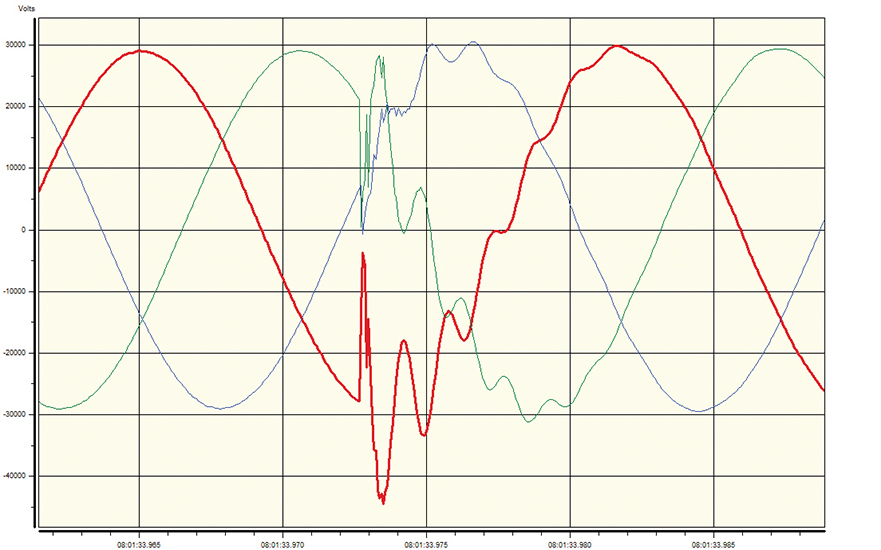
Figure 2: Three-phase voltage waveform for energizing a PF cap bank
The wiring’s inductance doesn’t like an instantaneous current change, so it causes an increase in voltage, as seen in the overshoot on the next half of the transient’s cyclic waveform. This oscillation continues at a rate determined by the system’s impedance, decaying due to the resistance and oscillating at a rate determined by the inductance and capacitance. Typically, the overshoot can be 1.2–1.5 times the normal peak voltage waveform, and the ringing frequency is between 400–1,600 Hz. The time—8 a.m.—is another clue, as it occurs every weekday at this site and time.
Other typical transient waveforms include arcing from tree vegetation contact, a phase-to-phase or phase-to-ground fault, or a worn contact on a switch or relay. A picture is worth a thousand words, but only if you know how to identify what you are looking for in it!
Richard P. Bingham
About The Author

BINGHAM, a contributing editor for power quality, can be reached at 908.499.5321.