Another IEEE Working Group has been meeting to address the problem of recognizing and analyzing the signature of power quality disturbances to identify their source. IEEE P3139 Guide for Power Quality Data Analytics is the first release of the working group’s 20-year effort on the electrical signatures of various utility equipment failures, including waveforms and RMS plots of the voltages and currents. However, the name of the guide probably isn’t likely to pique the interest of the 71% of Electrical Contractor‘s readers who reported being engaged in power quality work in the 2024 Profile of the Electrical Contractor.
Signatures have held a high regard in the PQ community for decades. Back in the late 1980s, BMI published a book called “The Handbook of Power Signatures.” A decade later, Dranetz-BMI and Electrotek Concepts developed a PQ monitoring system primarily for permanent PQ monitoring and reporting called the “Signature System.” The squiggly variations in the voltage and current sine waves during PQ disturbances hold a wealth of information that don’t seem obvious to the masses. Identifying a back-to-back power capacitor switching transient signature in the voltage waveform remained a mystery to many using PQ monitoring instruments, despite my efforts to educate people in seminars around the country.
Spot the different signatures
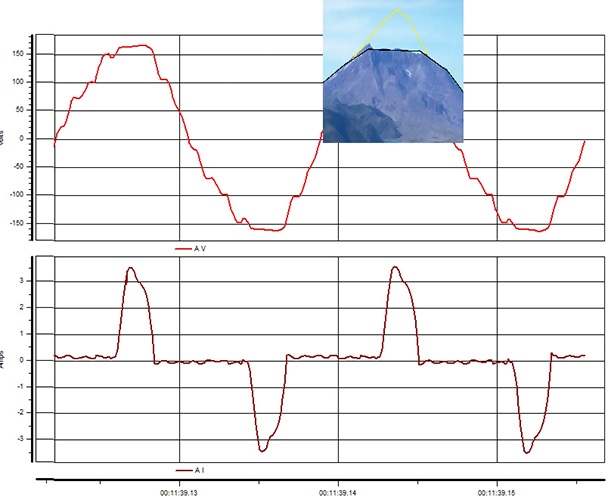
Recently, I responded to someone who posted a question on a nontechnical website concerning a voltage waveform he recorded in his home. He was concerned about why it looked like it did and if it was a significant problem. The voltage waveform was what I refer to as the “Mount St. Helen’s effect.” The peak portion of the positive and negative half cycles of the waveform is flattened, as illustrated in Figure 1.
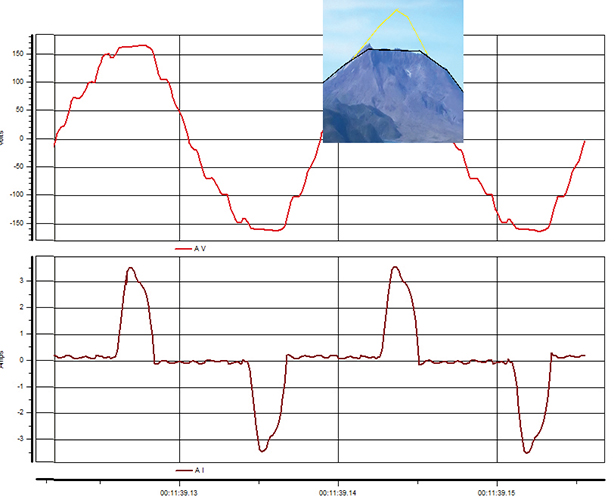
Figure 1
The current waveform in the lower half of the graph is mainly in the area of the voltage peaks and has 85% of the fundamental being the 3rd harmonic, 56% for 5th, 28% for 7th and 12% for 11th. The resulting effect on the voltage waveform is the fundamental plus 6.5% of the 3rd harmonic, 1.3% of 5th, 3.2% of 7th and 2.8% of 11th. This is typical of single-phase loads such as computers, printers and televisions, often referred to as “electronic loads.” The power supplies have a full wave rectifier and a storage capacitor that feeds a switching power supply. It only draws current when the rectified AC voltage is higher in amplitude than the storage cap voltage. Remembering Ohm’s and Kirchhoff’s laws, if current only flows in the middle of the waveforms, then the voltage drop across the source impedance reduces the supply voltage at the middle of the waveforms. The 3rd harmonic is the main culprit in single-phase electronic loads.
Three-phase electronic loads typically have a different signature. The current here often looks like an outline of Batman’s head, as shown in Figure 2.
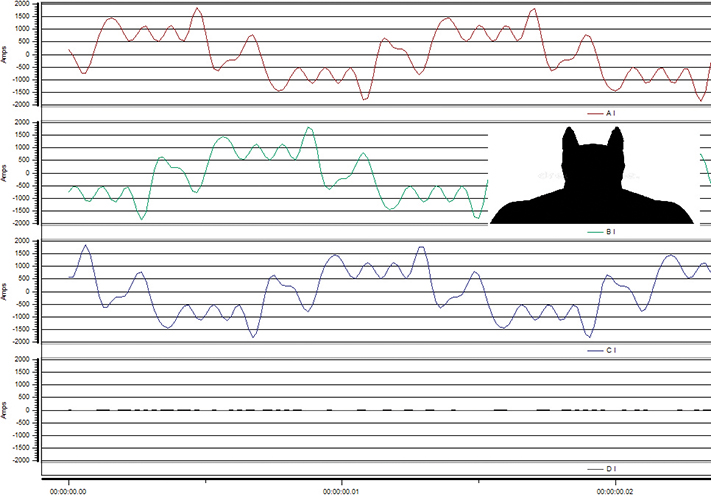
Figure 2
Here the current harmonics are 50% of the 5th, 47% of 7th, 29% of 11th and 24% of 13th. This follows the rule that dominant harmonic numbers are equal to N x [number of poles +/– 1]. Another notable part of the signature is a little current in the neutral conductor, as it is the triplen harmonics that add in the neutral (3, 6, 9, 12, etc.), which is another easy-to-spot signature. A lot of neutral current at 180 hertz means there is lots of 3rd harmonic on a three-phase wye circuit.
Another easy way to spot a harmonic issue is the presence of even harmonics (2, 4, 6, 8, etc.). These are unusual to find on electric systems with properly operating loads, even with a large percentage of electronic loads. Even harmonics produce asymmetries in the voltage and current waveforms, meaning the positive half-cycle doesn’t look like a mirror of the negative half-cycle. Even harmonics can cause a DC offset in the voltage and current, which is not a friend of transformers and motors. Just a DC current of 1% of rated current can cause problems, such as transformer core saturating and damage to the windings.
In one case study, a current waveform for the input to a UPS in a mission-critical facility was showing significant even harmonics. The facility manager said the PQ monitor must be malfunctioning. A quick analysis of the current signature looked like even harmonics.
After the manager agreed to take the UPS out of service and check, he found that one half of the rectifier was blown. It became a half-wave rectifier power supply instead of a full-wave one. If the UPS had been required to power the computer loads during a voltage interruption, it would have been an interrupted power supply instead of a UPS.
Whatever name you want to call these common signature waveforms, remembering just a few can help find the source of many harmonic problems.
Richard P. Bingham
About The Author

BINGHAM, a contributing editor for power quality, can be reached at 908.499.5321.