
A hall of mirrors: a maze filled with obstacles, distortions and confusing reflections. You feel anything but certain. This is an apt metaphor for 2025 and as we enter 2026. The economic headwinds are real, and shifting policy decisions coming out of Washington have added challenges. To make it through the fun house, separate what you know to be real in the marketplace, and shut out the noise coming from news coverage, politicians and opinion-makers. That is how you will gain some clarity and take control. This 2026 Construction Outlook can help guide you as you navigate economic mirages throughout the year.
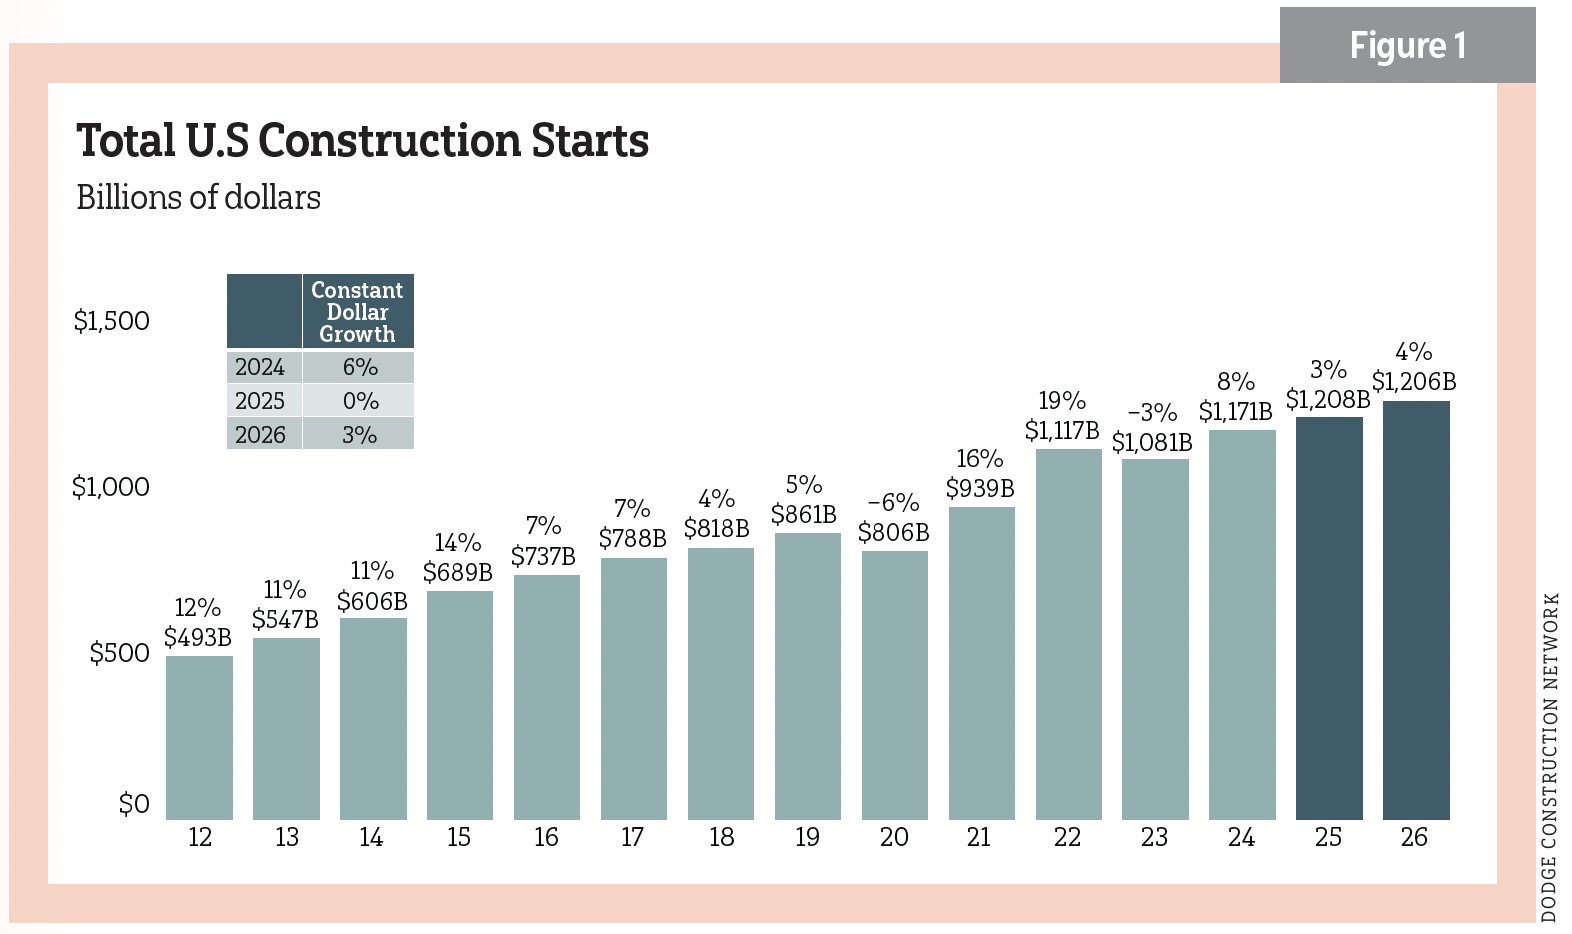
Weaker growth is expected this year. The good news is, construction is still growing. For 2025, Dodge Construction Network, Boston, puts total starts (residential and nonresidential) growth at 3% ($1.2 trillion). That fell from early 2025’s expected 8%. Such downgraded estimates reverberated through many construction sectors in recent months. For 2026, Dodge projects a slight advance at 4% ($1.26 trillion). ConstructConnect, Cincinnati, and its partner, Oxford Economics, saw growth of 1.1% ($997,142 billion) in 2025. For 2026, they anticipate –2.2% ($975,200 billion). Both prognosticators anticipate a return to stronger growth in 2027. See Figure 1.
What we know and wish we knew
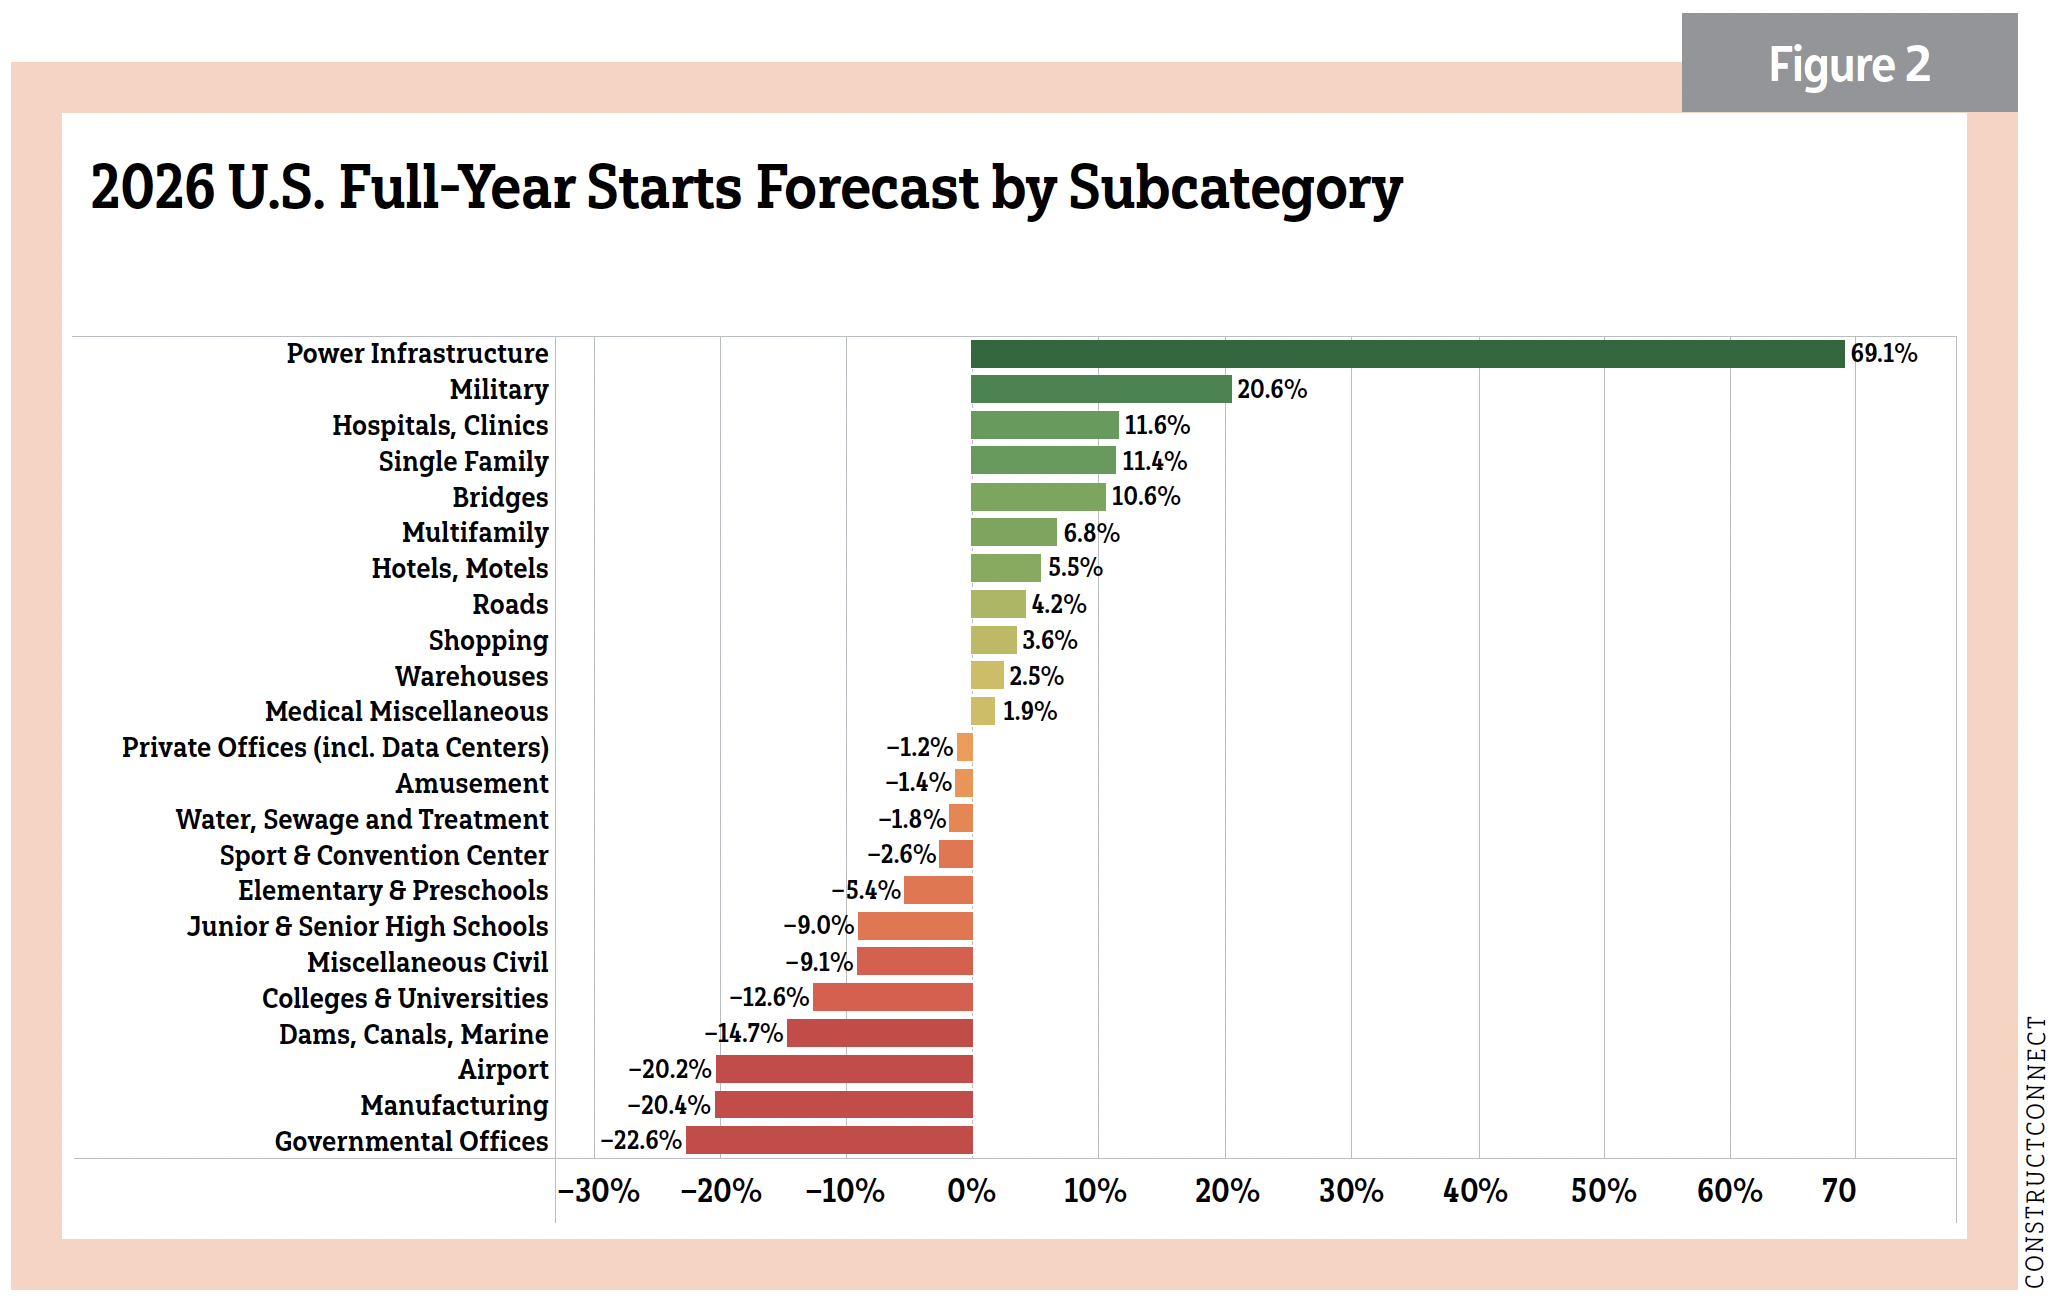
“It has been an odd couple of months for somebody that relies on information,” said ELECTRICAL CONTRACTOR’s economist Chris Kuehl, managing partner and cofounder of Armada Corporate Intelligence, Lawrence, Kan. “Important data simply stopped as the government shut down, leaving the prognosticating crowd more dependent on guessing. So, what do we know now? At the heart of the [residential] sector is growth, and construction is following that growth.” See Figure 2.
Kuehl finds looking at population migration patterns as an important lens when assessing the economic picture. Important and strategic homework for the electrical contractor is to find where the business is and which construction sectors are beneficial to invest in.
“At the moment, there is an exodus of people from high tax and high cost-of-living states to those judged more economically reasonable,” he said. “That has prompted departures from the far West and Northeast and arrivals in the Midwest, Southeast and Mountain West. Job opportunities once dominated the motivation for relocating, but many people can now work from anywhere, and that changes patterns. People are free to choose where they live according to factors such as recreational preferences, proximity to family and so on.”
Kuehl added that these patterns are reflected in local data.
“While the overall jobless rate for the country may be 4.3%, in North Dakota it is 2.5%. California sports a rate of 5.5%. Other factors are more traditional and permanent—mortgage rates, job security and the like. A small increase or decrease in the mortgage rate will push the residential market in a new direction. Localities will react differently,” he said.
Nonresidential construction reacts to a more complicated set of variables, Kuehl said.
“Financing certainly plays a big role, but a potentially lucrative project will be worth pursuing even if financing costs are high. Demographics play a major role, too, as rooftop counts will be studied, determining everything from retail construction to government building needs” he said, adding that shifts in local business development will drive overall construction.
Kuehl pointed to three arenas that will affect the nonresidential sector: “The first is the dramatic need for more energy. It is estimated that an additional 44 terawatts of power will be needed in the next three years just to power A.I. Texas is planning the construction of at least 25 peaker plants to provide energy during the summer months in 2026. This demand on the grid will only expand with the development of more robotics for factories, warehouses and elsewhere.
“A second driver has been healthcare as the baby boomer generation ages and demands more care. This has been accelerated by the decentralization of healthcare—more facilities located closer to where populations are growing. Specialization has also amplified the need for more facilities. Transportation and logistics continue to be a driver, too. Meanwhile, retail trends favor online activity, and that amplifies the need for warehousing and all the needed elements of supply-chain management,” Kuehl said.
He emphasized that growth is still taking place in many parts of the nation and in various industries.
“Overall, the U.S. growth rate [GDP] is still thought to be in the 4.0 range [according to GDPNow]. Many parts of the nation are seeing even better numbers, while others are slower. When it comes to data, the more local, the better,” he said.
Editor's Note: As of late December, GDP grew at a 4.3% annual rate, faster than the previous three months.
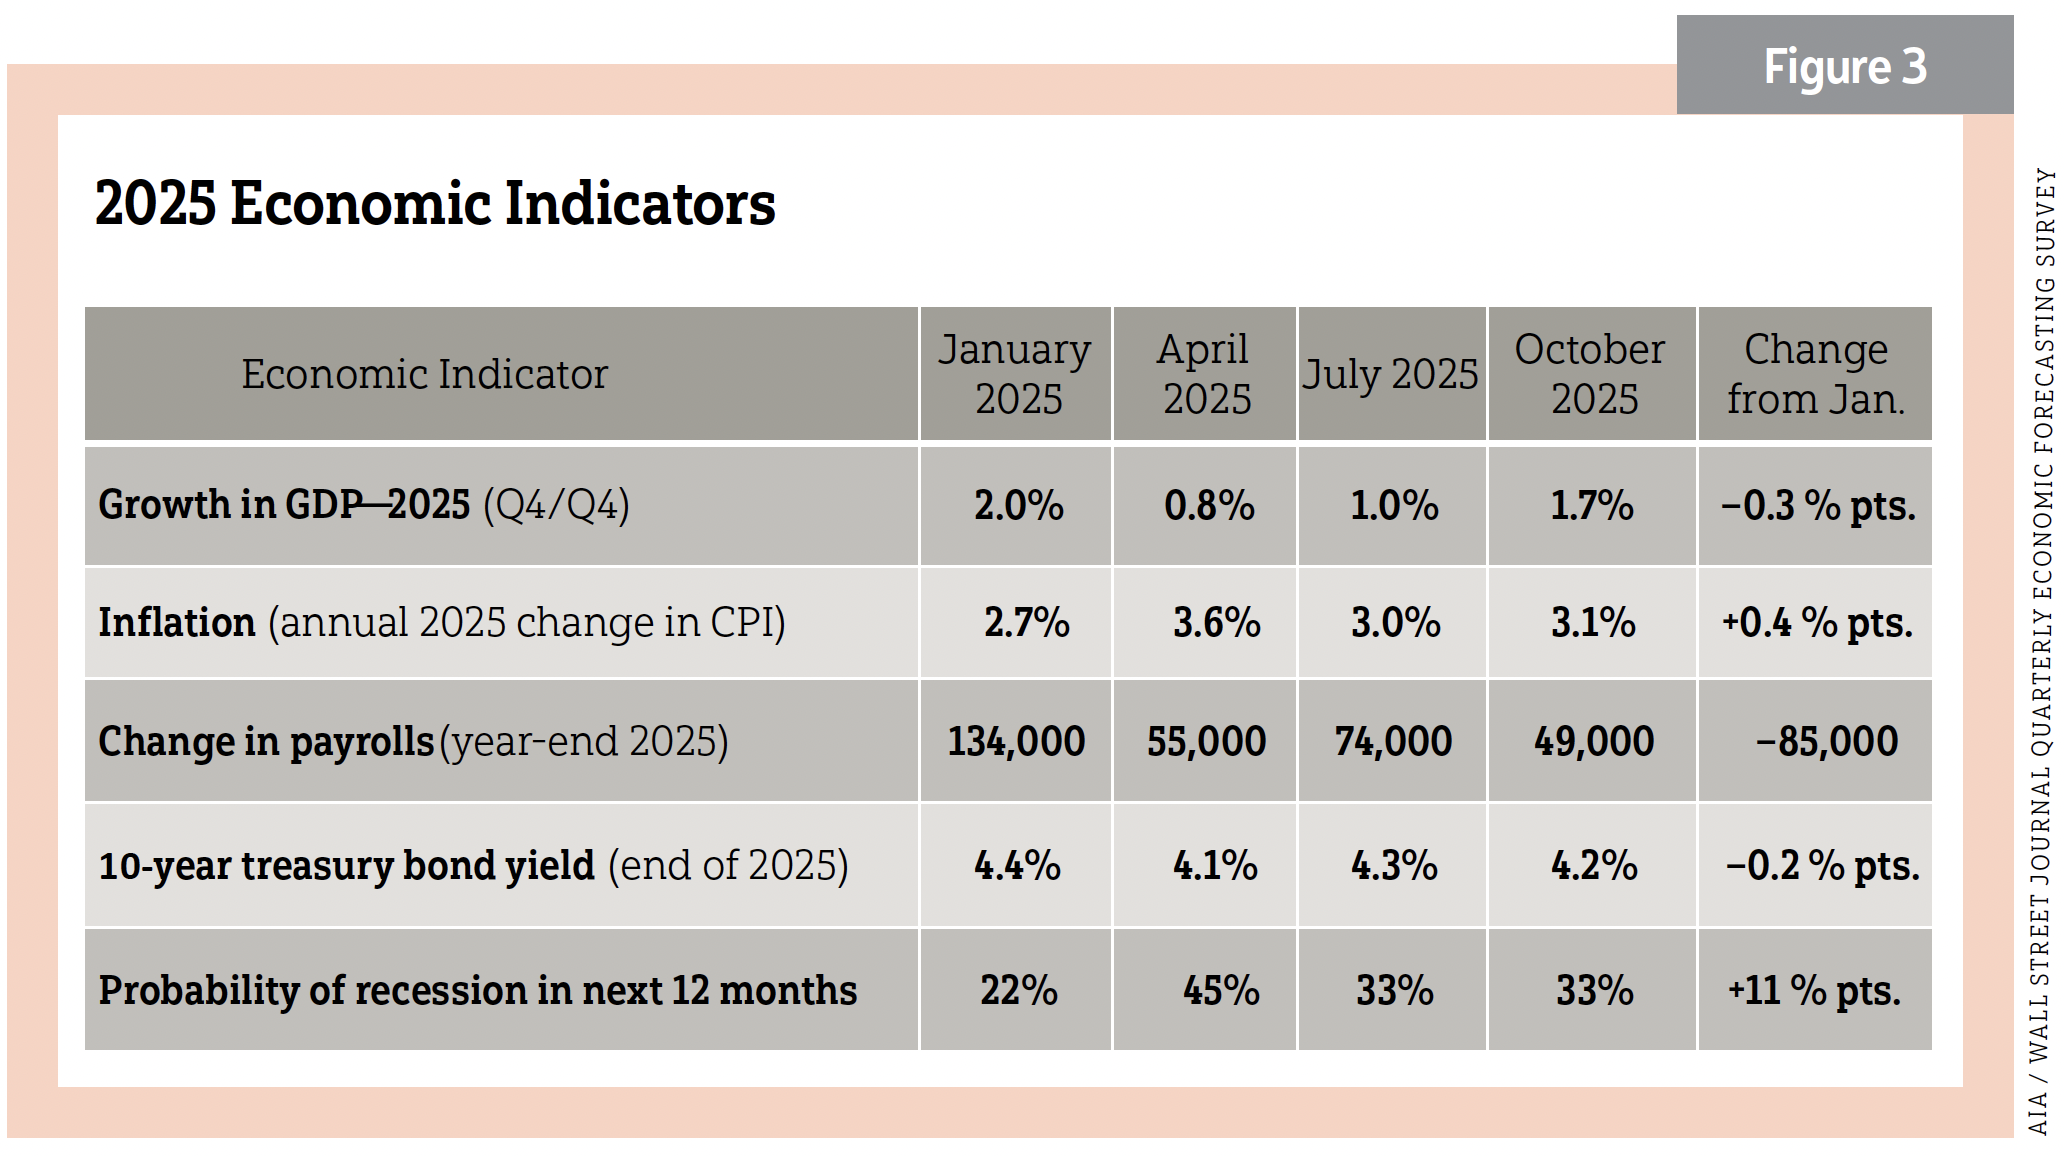
For the electrical contractor, projected growth is encouraging, given what is needed and the forces driving construction demand, but that growth comes with challenges.
“Will there be a labor force sufficient to handle the load?” Kuehl asked. “Will commodities be available and at a reasonable price? Will barriers in the regulatory world compromise expansion plans? Will local economic distress derail opportunities?”
These questions will hang over 2026 and beyond. See Figure 3.
Economic spasms
The economy is not exactly the human body, but nagging issues can build up over time and symptoms will appear. While the nation’s economic health has not suffered a clear fracture, economists are concerned about recurring “muscle spasms” signaling underlying strain.
Cristian deRitis, managing director and deputy chief economist for Moody’s Analytics, New York, described some of those spasms he and other economists will watch that are certainly hindering growth. Though Moody’s baseline forecast does not include a recession, the odds of one are elevated. Moody’s projects GDP growth to rise modestly from 1.9% in 2025 to about 2.0% in 2026, all down from stronger growth in 2024.
“We do have some spasms in terms of the labor market. Also, housing markets not performing as strongly as other parts of the economy,” deRitis said. “Policy uncertainty is at a near record high. Though it has come down a bit, it is still very elevated, and that was before we had the data uncertainty.”
The longest federal shutdown in U.S. history (43 days) ended in November and many of the measures used for economic forecasting were delayed or canceled.
The tariff effect
At midyear 2025, GDP stood at 3.8 (seasonally adjusted)—the fastest pace since the third quarter of 2023.
“Importers were getting ahead of the tariffs [and] increased their inventories,” deRitis said. “They were able to hold the line on prices and market share. But now importers have burned through those inventories and must now import. More of that impact is being passed on to the consumer. We expect to see some weakening in the fourth quarter of 2025, followed by moderate acceleration in the first half of 2026. During this period, the overall inflation rate will rise to around 3.6%. We then expect inflation to stabilize before declining gradually in 2027.”
Though headline news of big-name company layoffs should not be dismissed, deRitis offered a measured take: ”Looking at the list of larger layoffs, these may be more idiosyncratic than signals of a broader trend. For example, Target has faced challenges, but we haven't seen layoffs at competitor Walmart. Amazon announced large cuts, but they hired aggressively over the past five years—this could just be restructuring. The same may apply to other companies. We'll need more data in the months ahead to know if these are canaries in the coal mine or one-off adjustments. That said, in the current economic climate, the risk of layoffs has increased as companies navigate an uncertain policy environment.”
In mid-December 2025, the Bureau of Labor Statistics released delayed data that showed 64,000 jobs added in November and elevated unemployment of 4.6%, the highest level in four years. Moody’s assesses breaking even on job growth, the number of jobs needed to create or add to the economy to keep up with population or labor force growth. That includes new college and high school graduates, immigrants and people coming off the sidelines into the labor market.
“The expectation is maybe 25,000 to 50,000 jobs per month,” deRitis said. “That is much lower than the 200,000 jobs we were adding and have grown accustomed to. You see job openings certainly stalling or even coming down relative to their peaks.”
The consumer is still saving the day
“Consumers have certainly done their part in spending and business investment was strong,” deRitis said.
But, he added, there is a hitch, as consumers in the top 10% of the income distribution represented nearly 50% of total spending in the third quarter of 2025, the highest level in data going back to 1989.
“This group, defined as those earning about $250,000 or more, has been driving overall consumer spending, contributing at least one-third of the U.S. GDP in 2025. Those making under $175,000 are just keeping pace with inflation,” he said.
In addition, deRitis described the valuation of the stock market as “very frothy.” It might see some significant corrections.
“It wouldn’t take much for slower spending or slower economic growth if these 10%-tier consumers get cold feet. That is the fragility that I see in this economy,” he said, adding that, nonetheless, “consumers may be expressing a lot of uncertainty and angst in consumer sentiment surveys, but if consumers continue to do their part, they contribute to growth and help us avoid recession. The Fed is starting to cut rates. So lower rates should be stimulative.”
The last consumer spending statistics available at the time of print were from August 2025 due to the federal shutdown. Spending was still up by about 1.7% year-to-date (YTD). In September, retail sales rose 0.2% from the previous month, the Commerce Department reported. The Consumer Collective, an advisory firm based in Brooklyn, N.Y., surveyed Americans making less than $75,000 and found that most planned to buy gifts for the holidays.
Editor's Note: As of late December, consumers spent 3.9% more from Nov. 1 to Dec. 21 this year compared with last year, according to a Mastercard report on holiday spending derived from a MasterCard's "SpendingPulse," which measures retail sales in stores and online through payment data.
The Federal Reserve cut short-term interest rates for a third time in 2025 on Dec. 10. The quarter-percentage-point reduction put the short-term federal funds rate between 3.5% and 3.75%.
Economic positives for deRitis include the projected 1.6% growth in 2026. Underpinning that growth, he said, “You do have investment spending by businesses, particularly around A.I. and infrastructure. States are in fairly good shape. Localities may have rainy day funds, but, if there are disasters or other gaps, the funds could be quickly depleted.”
A recent National League of Cities survey revealed U.S. cities’ general fund spending increased 7.5% in fiscal year 2024. That growth slowed to 0.7% in fiscal year 2025 as federal policy uncertainty and economic shifts began to play out.
“We construct a risk matrix. In terms of the most immediate, broadest macroeconomic impact would be the continued trade war and potential for escalation. That has all sorts of negative consequences in terms of planning and uncertainty in spending investment,” deRitis said. “Secondly, the real question with the Fed is whether it acted too slowly in cutting rates—given the signs the labor market may be weaker than believed—or whether cutting at all was a mistake, risking an inflation surge fueled by tariffs. Any misstep in monetary policy could take months to revel itself.”
If the Fed were to lose its independence, deRitis added, “that has all sorts of implications for the bond market and for your mortgage rates. If 10-year treasury yields gap out because investors are worried about the debt and they are worried about independence or monetization of the debt, that has negative consequences.”
The devil is in the nonresidential details
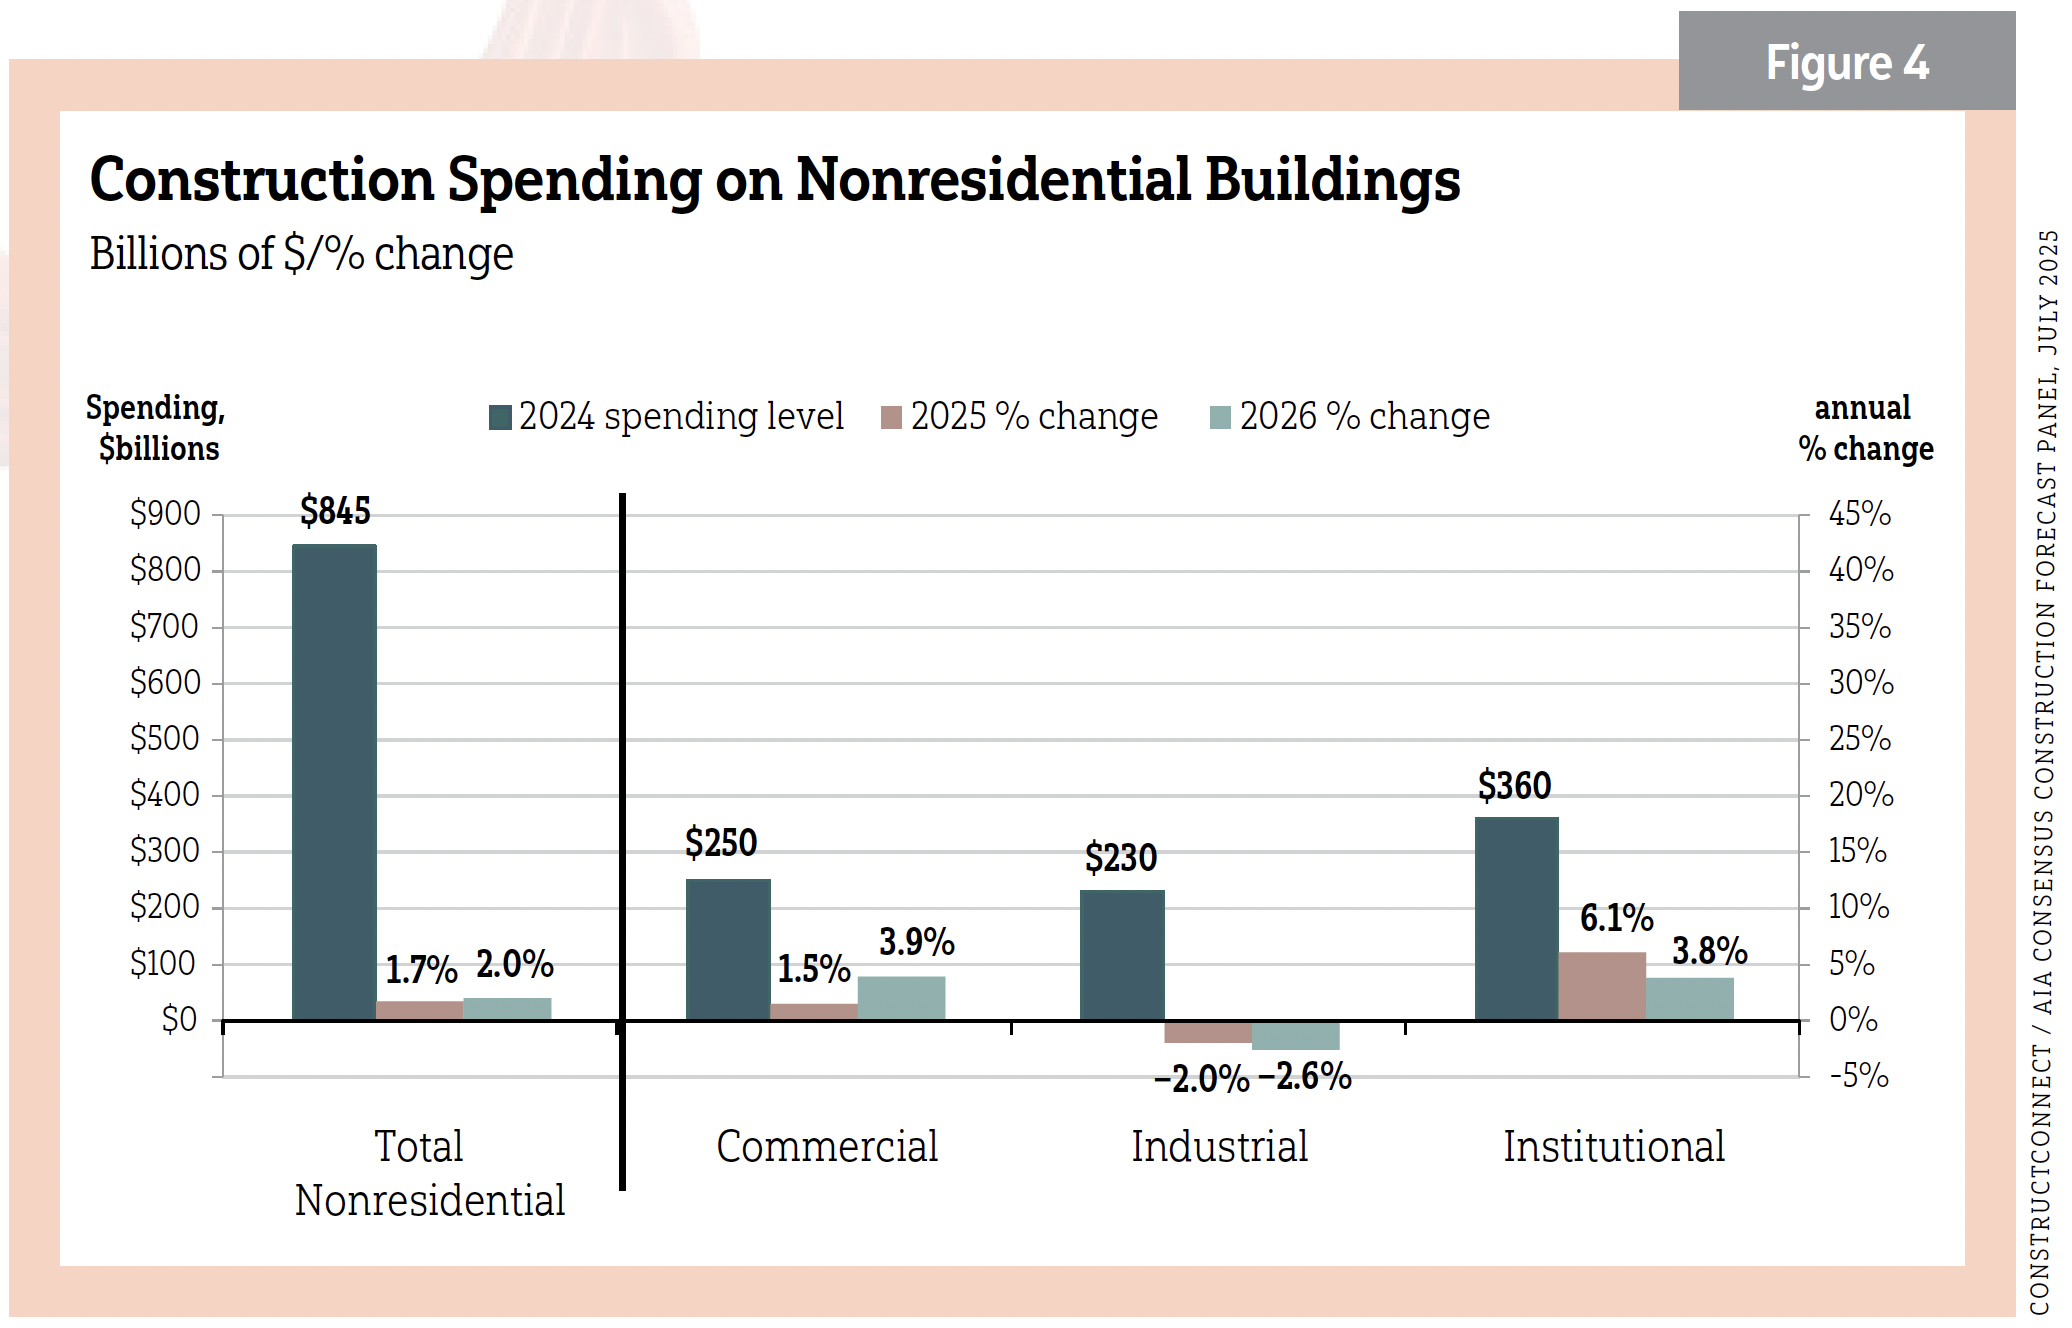
Kermit Baker, chief economist for the American Institute of Architects, Washington, D.C., gave his construction economic overview of 2025 and put-in-place spending projections for 2026 (available data as of October 2025). Such spending refers to dollars over the life of a project’s construction. He found 2025 nonresidential construction spending to be healthy carrying over from 2024, but year-over-year (y/y) growth rates began dropping in the second half of 2025.
“We’ll see spending growth probably in the 5%–5.5% range overall for nonresidential buildings in 2025,” he said. “There has been some disproportionate growth. Manufacturing surged 23% on a y/y basis. In fact, it accounts for over a quarter of all spending in the commercial, industrial and institutional sectors so far. The office sector is the weakest commercial sector, but it is boosted by the inclusion of data centers. Growth we have seen in commercial retail includes not only standard brick-and-mortar retailing but also warehousing numbers.” See Figure 4.
Baker felt that, while warehouses remain a large part of the retail market, their vibrant rise may be returning to more traditional levels. He cited findings from Capital Analytics, Miami, as added insight into the health of the nonresidential market. Capital Analytics tracks property values in the commercial and industrial categories.
“[It reports] the downturn in commercial property values is beginning to stabilize—really, across all the key commercial categories,” Baker said. “For instance, manufacturing facilities continue to see healthy gains. We are probably near the bottom in terms of commercial property value declines that we’ve seen in recent years.
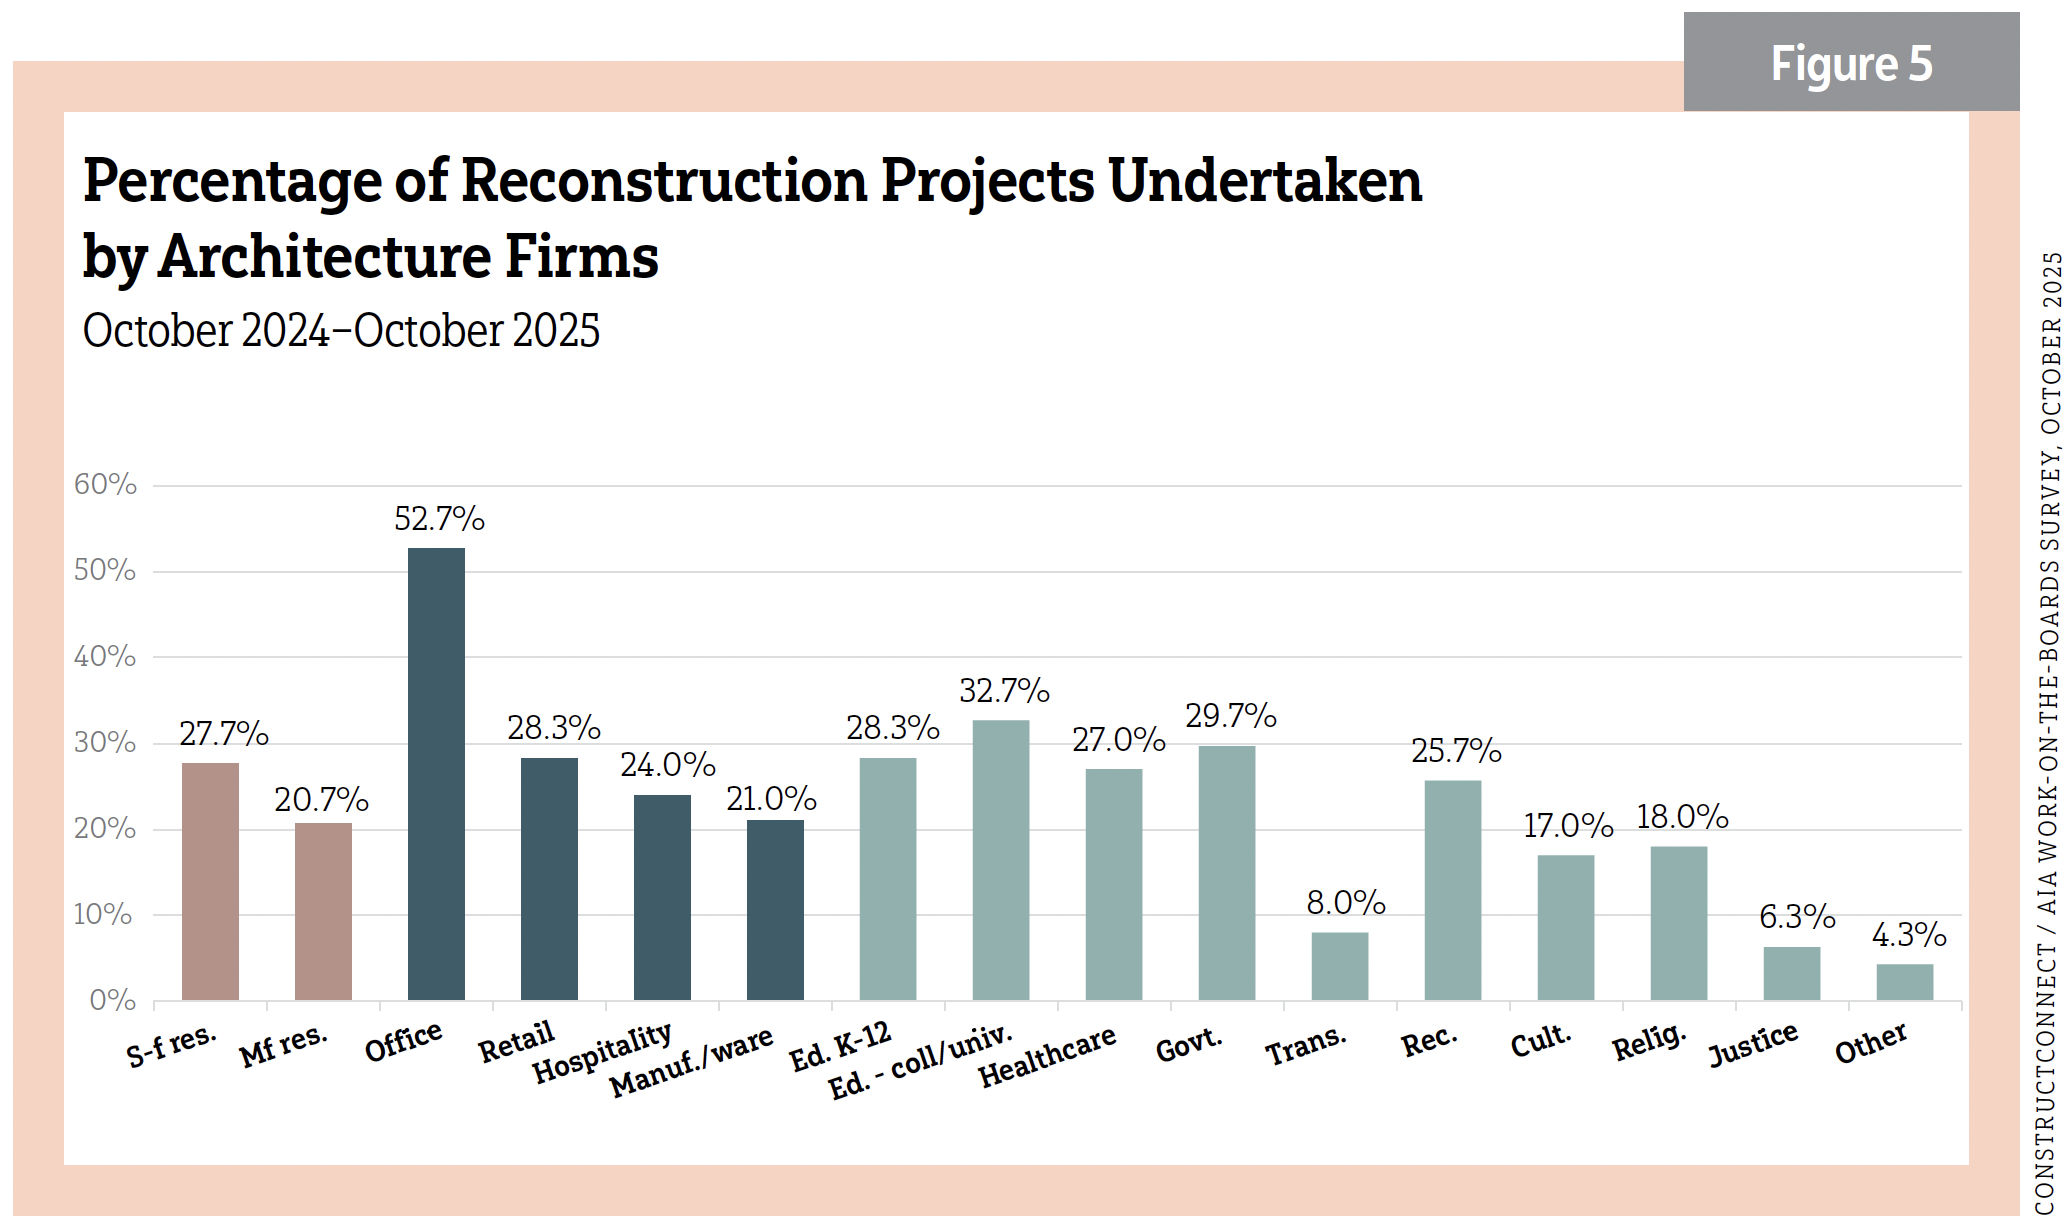
“The construction market is really unusually unbalanced at present,” he added. “We’re seeing a few strong sectors, but most of the core sectors we think about are weak. I think there are more opportunities in the reconstruction realm, particularly adaptive reuse and conversion of unutilized facilities. I think the demand is there.” See Figure 5.
In October 2025, AIA’s Deltek/Architecture Billings Index (ABI) rose to 47.6 from September’s 43.3. Any score of 50 or above in the ABI shows growth. Inquiries into new projects saw the most significant increase in a year and a half. New design contracts decreased again, as projects remain smaller and clients are hesitant to commit.
“Architecture firms estimate that billings declined modestly this year. Unfortunately, they are not expecting a significant turnaround in 2026,” Baker said. “About a third of firms nationally project that their billings will increase this coming year, and a slightly higher share expect them to remain about the same. Firms with a multifamily specialization are the most optimistic about prospects for 2026.”
The ABI’s Project Inquiries index was a promising 54.8. The Design Contracts index was 47.1. Mixed practice, firms that do not have at least half of their billings in any one other category, was 44.0.
Regional scores included Midwest (49.6), South (46.3), Northeast (45.1) and West (42.1). Sector scores included multifamily residential (46.8), commercial/industrial (43.9) and institutional (46.1). The Project Inquiries Index rose to 51.6, while the Design Contracts Index stood at 47.1.
Encouragingly, the U.S. Expansion Index reached 1.16 y/y in November 2025. That represented a 16% increase in planned construction investment and the fourth consecutive month of expansion.
Wait for it
Michael Guckes, the chief economist for ConstructConnect, shared his optimism for construction, with many markets estimated to show year-to-year growth.
“Residential single-family, especially, we think is going to rebound with the right market conditions [mortgage, cash flow, home affordability],” he said. “The incredible growth in data centers and the electricity demand will need power to be met. Energy infrastructure and power generation are some of the faster growing subcategories in the next 5 years.
“Civil construction continues to be strong and continues to benefit from the IIJA [Infrastructure Investment and Jobs Act of 2021]. That represents about $700 billion of unallocated money that is going to help civil projects and in our five-year forecast. Things like dams, bridges and roads will all benefit tremendously, including the normal construction spending that goes on in those areas, as well. Also, hotels and motels appear strong. Nursing homes, too, along with assisted living and hospitals. Transportation terminals should also do well,” Guckes said.
Slowing, not flatlining
Eric Gaus, chief economist for Dodge Construction Network, sees some slowing in 2026 but nothing devastating.
“The construction industry is on the same knife edge as the rest of the economy. Knowing exactly what the tariff rates are, when they are going to be enacted, and on which products or countries has been really, really challenging,” Gaus said. “Though tariffs are a moving target, they are going to be pushing through eventually on prices, and we see these price pressures. We are seeing a pullback in discretionary spending. Construction will not kick back into high gear until sometime in 2027.”
Focusing down, Gaus said commercial starts performance in 2025 was mostly flat from 2024, if you took away data centers. Performance of institutional showed flat growth, too, as of September 2025 and projects are taking longer to start. See Figure 6.
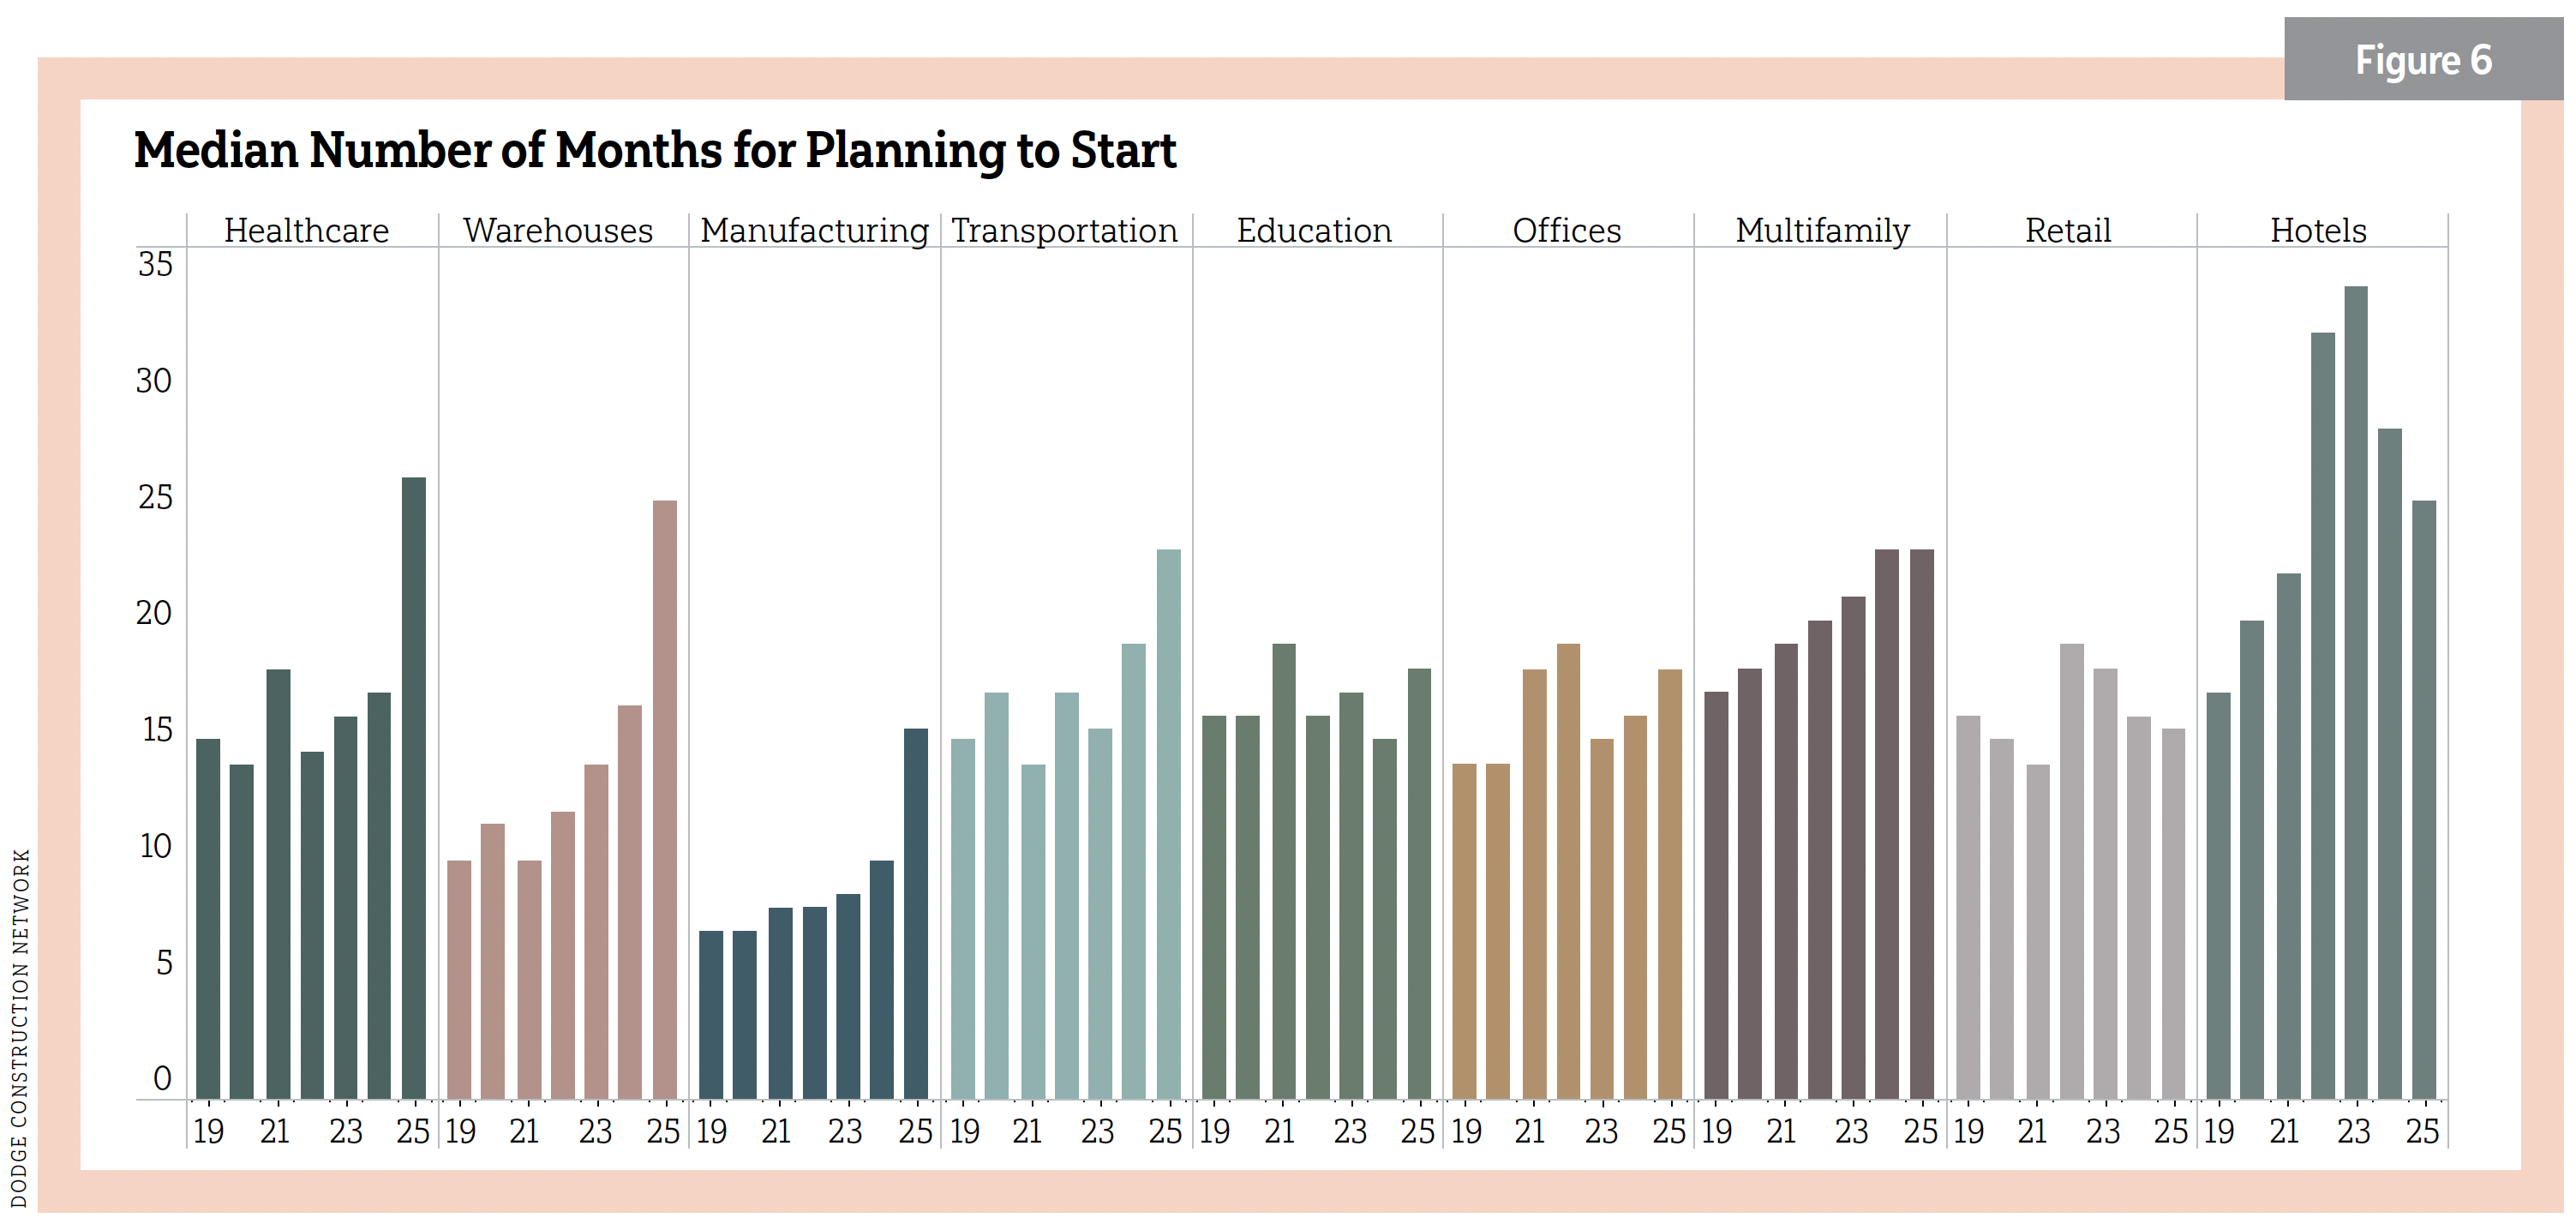
“To us, this corroborated this idea that people are sitting on their hands—still putting projects in the planning hopper but not shovels in the ground. This is particularly acute in healthcare, warehousing and manufacturing, but we’re seeing some of this across the board. We are seeing more planning activity, and that is a good thing, even if we don’t see returns until 2027,” he said.
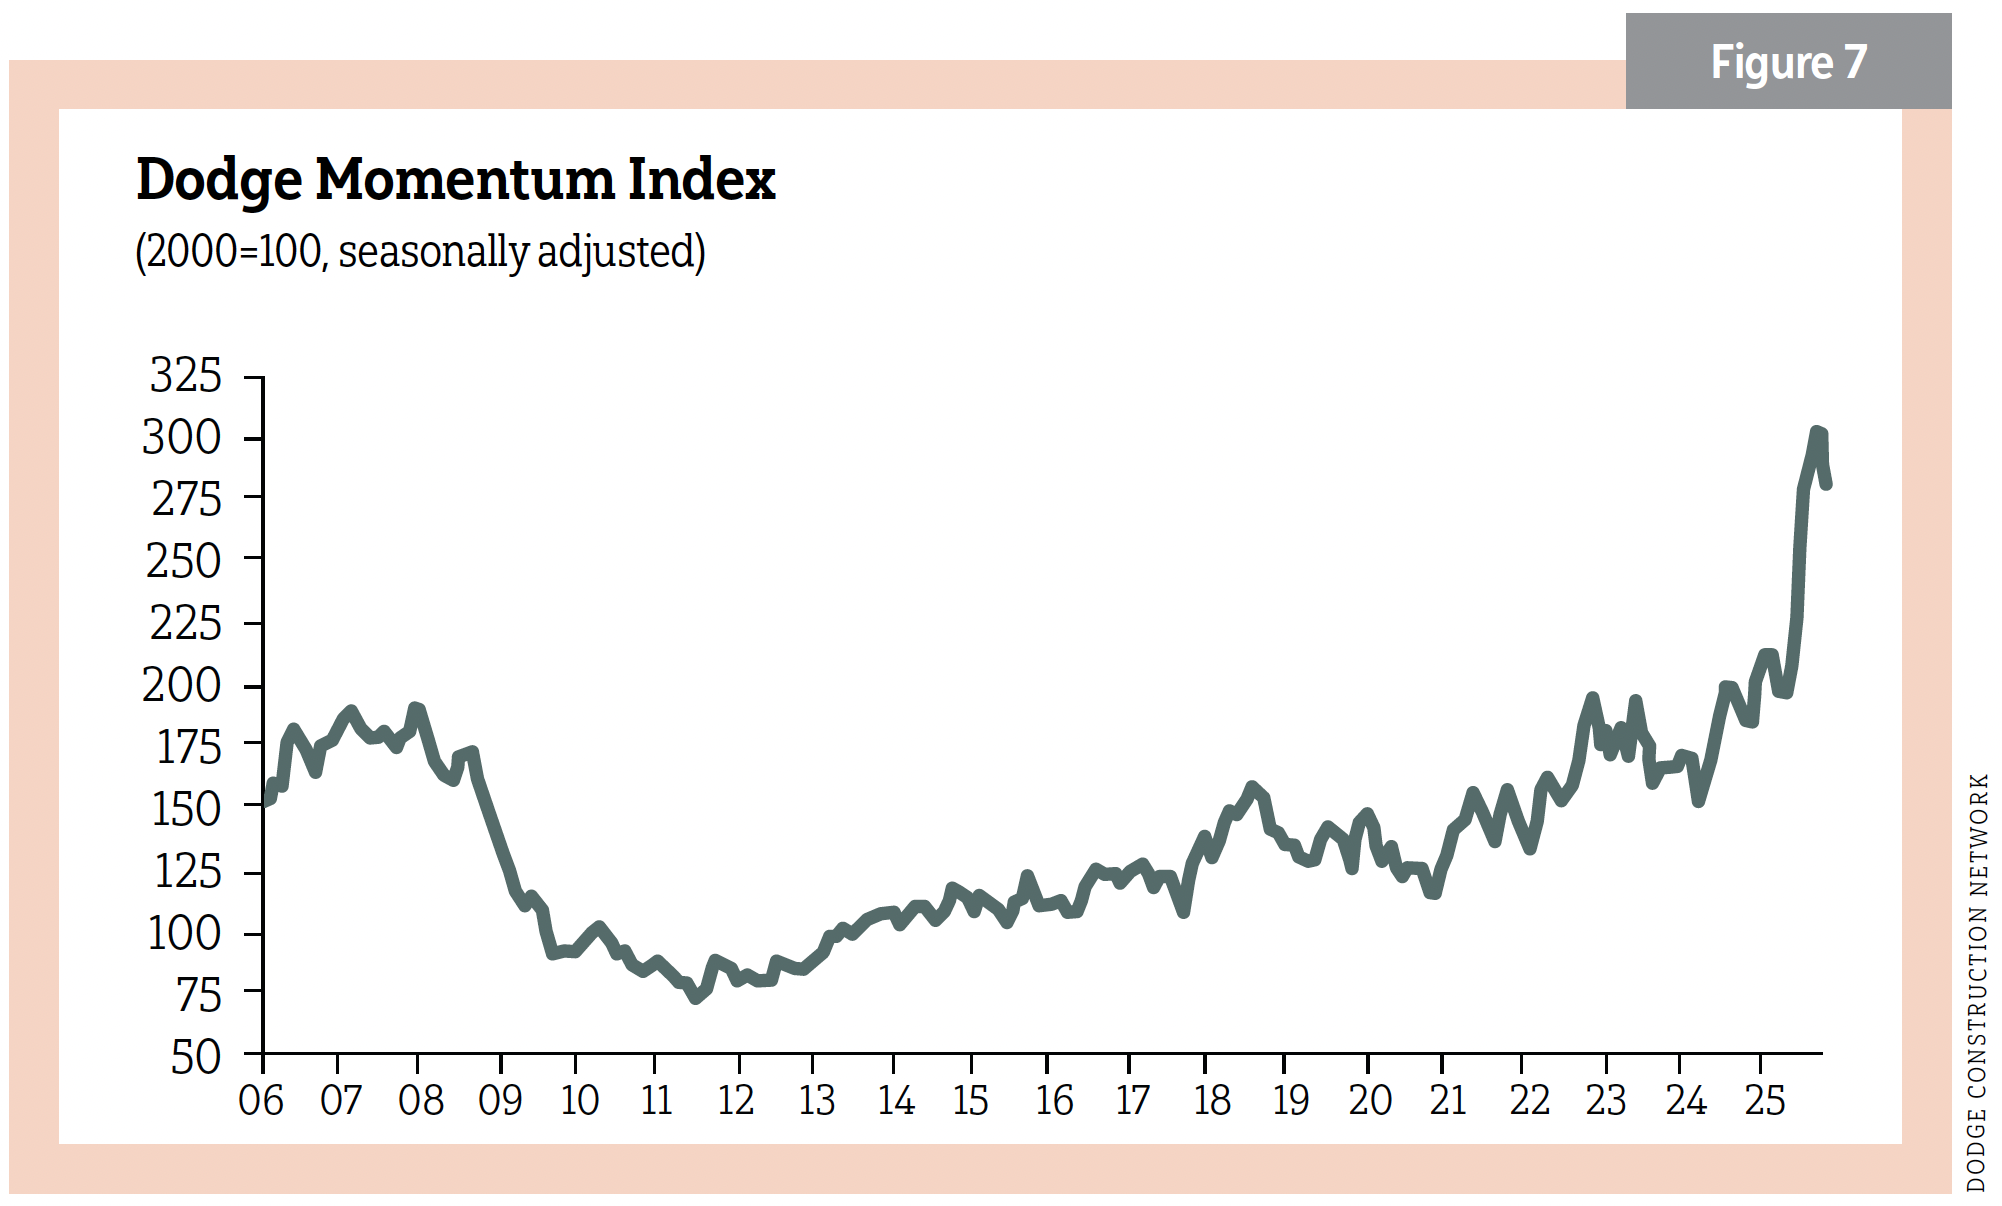
The Dodge Momentum Index (DMI) enjoyed some healthy tailwinds in 2025. It is a monthly measure based on the three-month moving value of nonresidential building projects going into planning and is shown to lead construction spending for nonresidential buildings by a 12–18 months. The DMI did decrease by 1.1% in November to 276.8 (2000=100), but was up YTD 36% over the same period in 2024. See Figure 7.
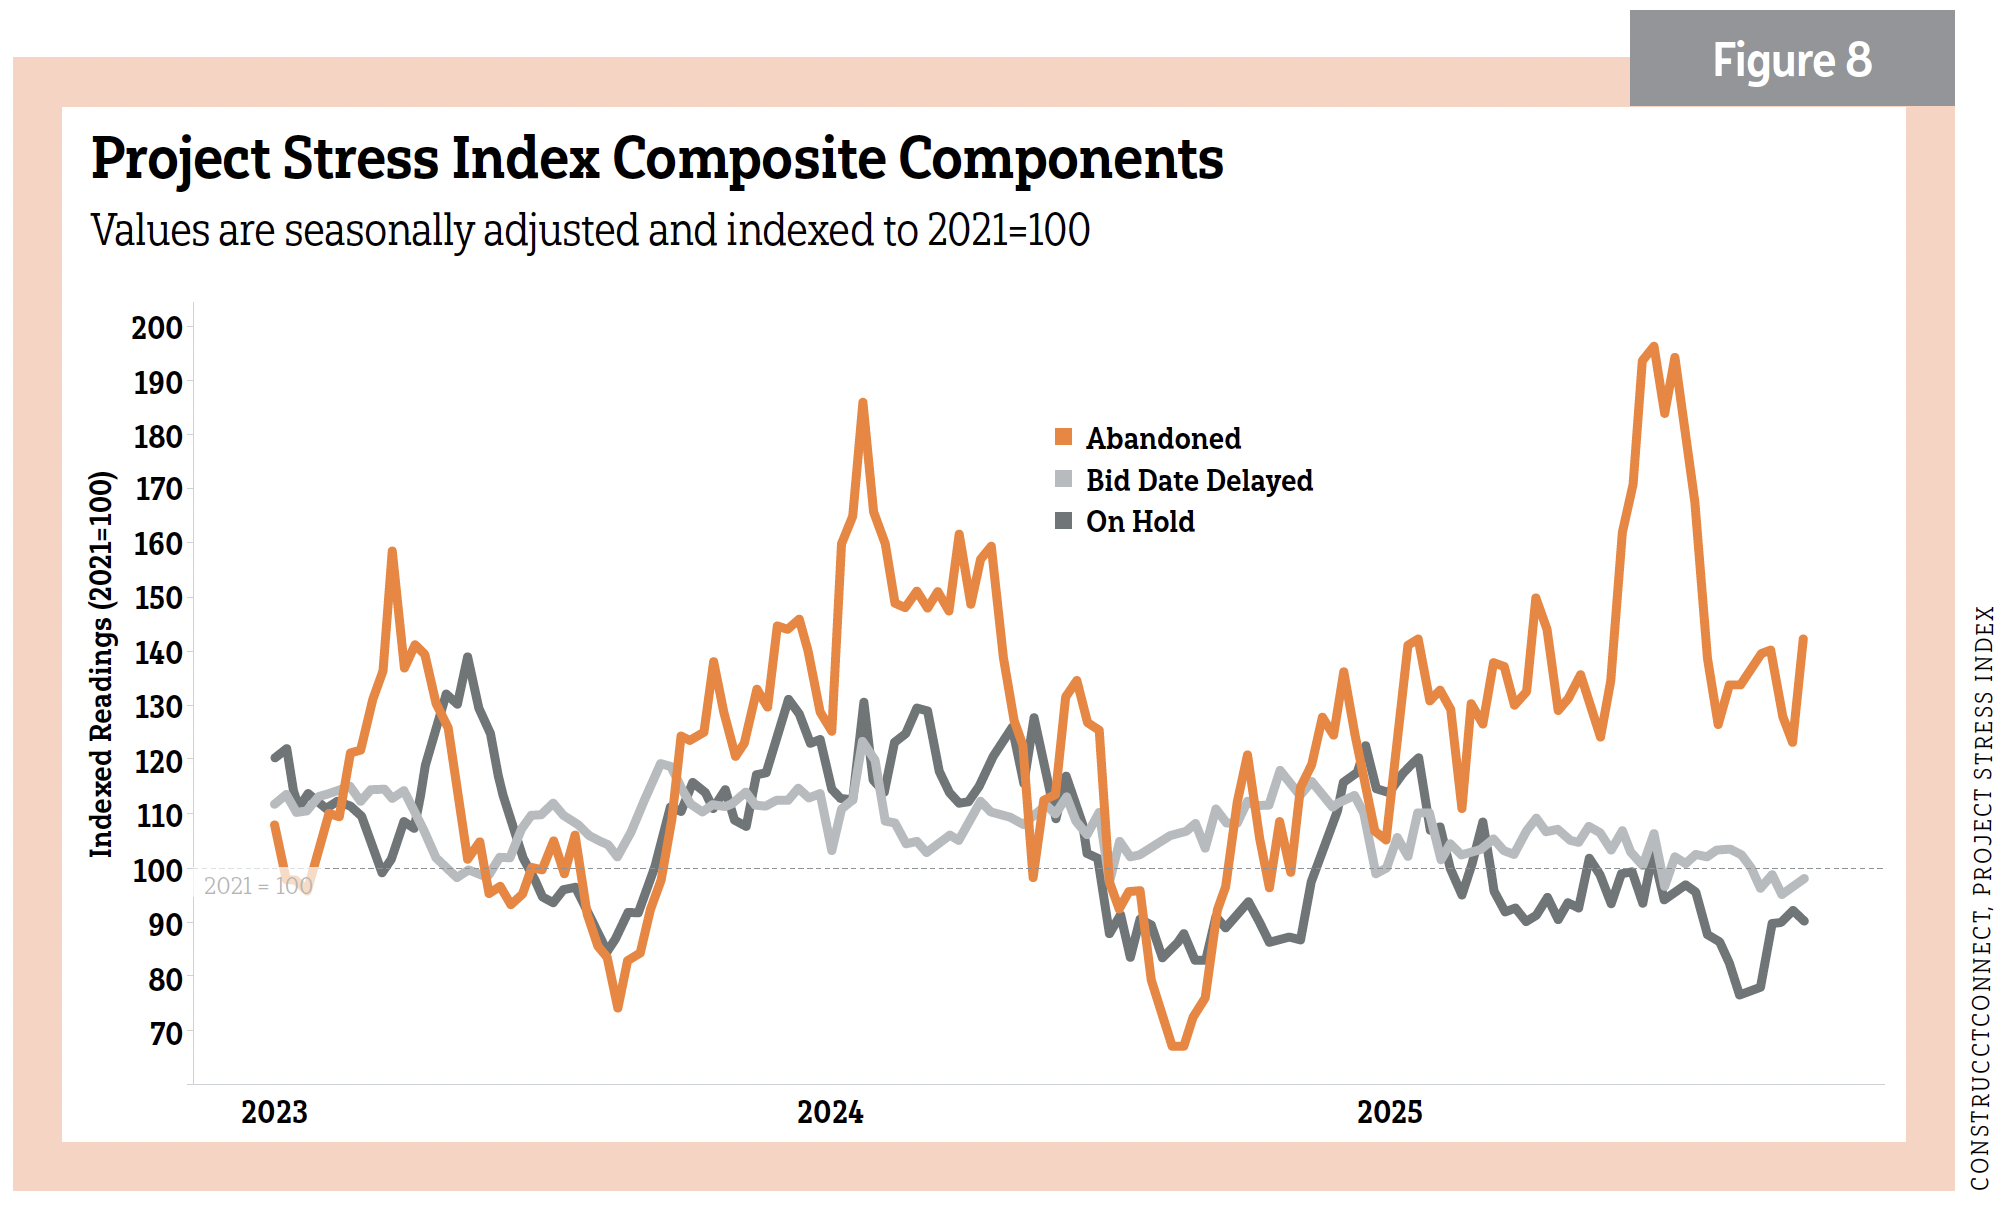
ConstructConnect’s Project Stress Index (PSI) stood at 125.8 as of November 2025, up 20% from October. Another measure of projects in the design phase, the PSI showed a rise of 16.5% in on-hold activity. Bid date delays decreased a modest 2.9%. Unfortunately, there was a 41.1% leap in abandonments. On a y/y basis, November’s increase pushed the index 9.9% higher. See Figure 8.
Gaus said neither Dodge’s nor ConstructConnect’s numbers indicate a recession.
“Nothing in the economic and financial variables is really screaming at us right now,” he said. “Economic policy uncertainty is the biggest threat. In the business community, people get used to the uncertainty and start making decisions. That means that they are likely to attach premiums. That becomes the cost of doing business.”
Unfortunately, the One Big Beautiful Bill Act has only compounded deficits and debt, Gaus said. According to Dodge’s 2026 Outlook ebook, “The Congressional Budget Office estimates that The One Big Beautiful Bill Act will add $3.4 trillion to budget deficits over 10 years, increasing the debt-to-GDP ratio from around 100% now to about 130% in 10 years.”
The bill’s quality opportunity zones (QOZ) are expected to provide a “modest short-term economic boost,” but QOZ construction projects don’t begin until 2027. Any immediate benefits of the bill will come up against its cost-cutting measures kicking in after the 2026 midterms.
Gaus said there is a “ton of cash” sitting on the sidelines, adding that, “people are happy to keep their available cash in some markets short-term. Money might start to free up as the short end of the yield curve comes down.”
He sees the nonbuilding and residential sectors supporting growth in the future.
Data centers and megaprojects
Data centers remain the talk of the town, and for good reason. They represent a big and successful part of the office market. Through September 2025, YTD data center spending soared to $32.9 billion, a remarkable 92.8% increase. More than $400 billion represents future projects being eyed or committed. The drive for A.I. and cloud computing, for now, seems insatiable.
Guckes publishes a Data Center Report for ConstructConnect News. In November 2025, he reported on 39 late-stage preconstruction projects (total estimation of $25.5 billion), which had planned start dates before the end of 2025. Regionally, Southern states have dominated data center construction. Louisiana, Virginia and Texas collectively accounted for over two-thirds of all U.S. starts spending through September 2025.
Western states have also recorded strong starts. Arizona leads the region at $2.4 billion in starts, followed by Utah at $2 billion and Oregon at $1.5 billion. And then there is Wisconsin. The Milwaukee Journal/Sentinel reported ground was expected to be broken in late 2025 for a data center campus in Port Washington, Wis., scheduled for completion in 2028. The project is estimated at more than $15 billion. It is one part of a $300 billion deal that Oracle entered with OpenAI to power its ever-growing need for data centers.
“We need a lot more power, and creative solutions to building these sites without damaging the local communities through increased power rates or increased water usage [big for data centers],” Gaus added. He expects constraints to “plateau” data center growth looking out five years.
An interesting market within data centers might grow, too.
“We’re seeing a huge increase in medium-scale data center projects [and] smaller data centers,” Gaus said. “These are really targeted toward the end-user and edge computing.”
While several data centers are megaprojects, other projects continue to play an outsized role in nonresidential building.
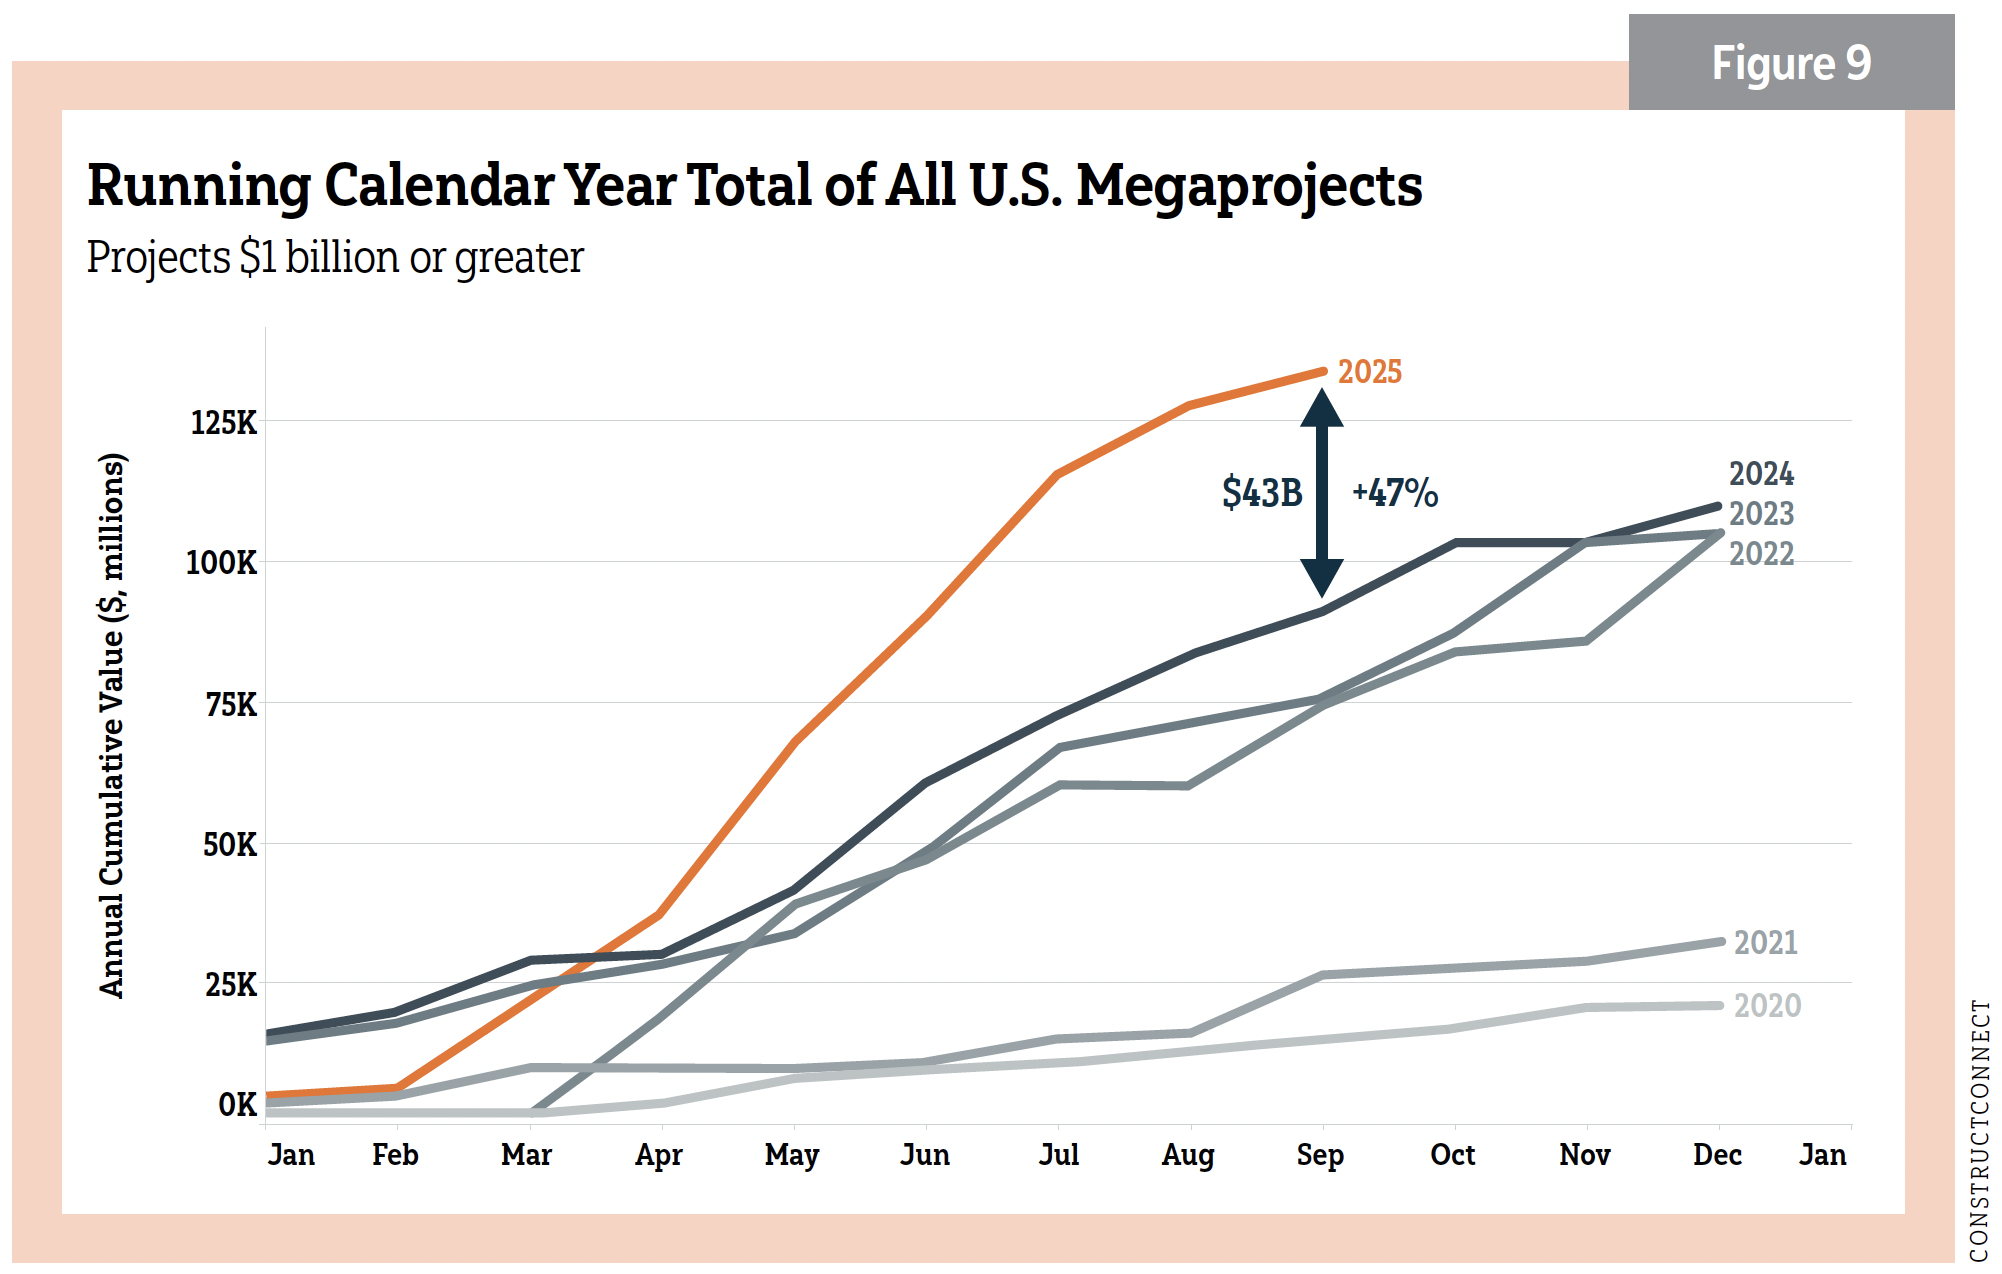
“The sheer number of megaprojects continue to move through the pipeline in preconstruction,” Guckes said. “On average, we are seeing about $10 billion of megaprojects per month. Those in the planning pipeline may be delayed, but the pipeline is very encouraging.” A megaproject represents a $1 billion or more start. In the third quarter of 2025, ConstructConnect reported 12 projects totaling $46.6 billion were initiated. See Figure 9.
“The CHIPS Act, IIJA and the Inflation Reduction Act all led to a dramatic rise in megaprojects,” Guckes said. “About two-thirds of those megaprojects are manufacturing.”
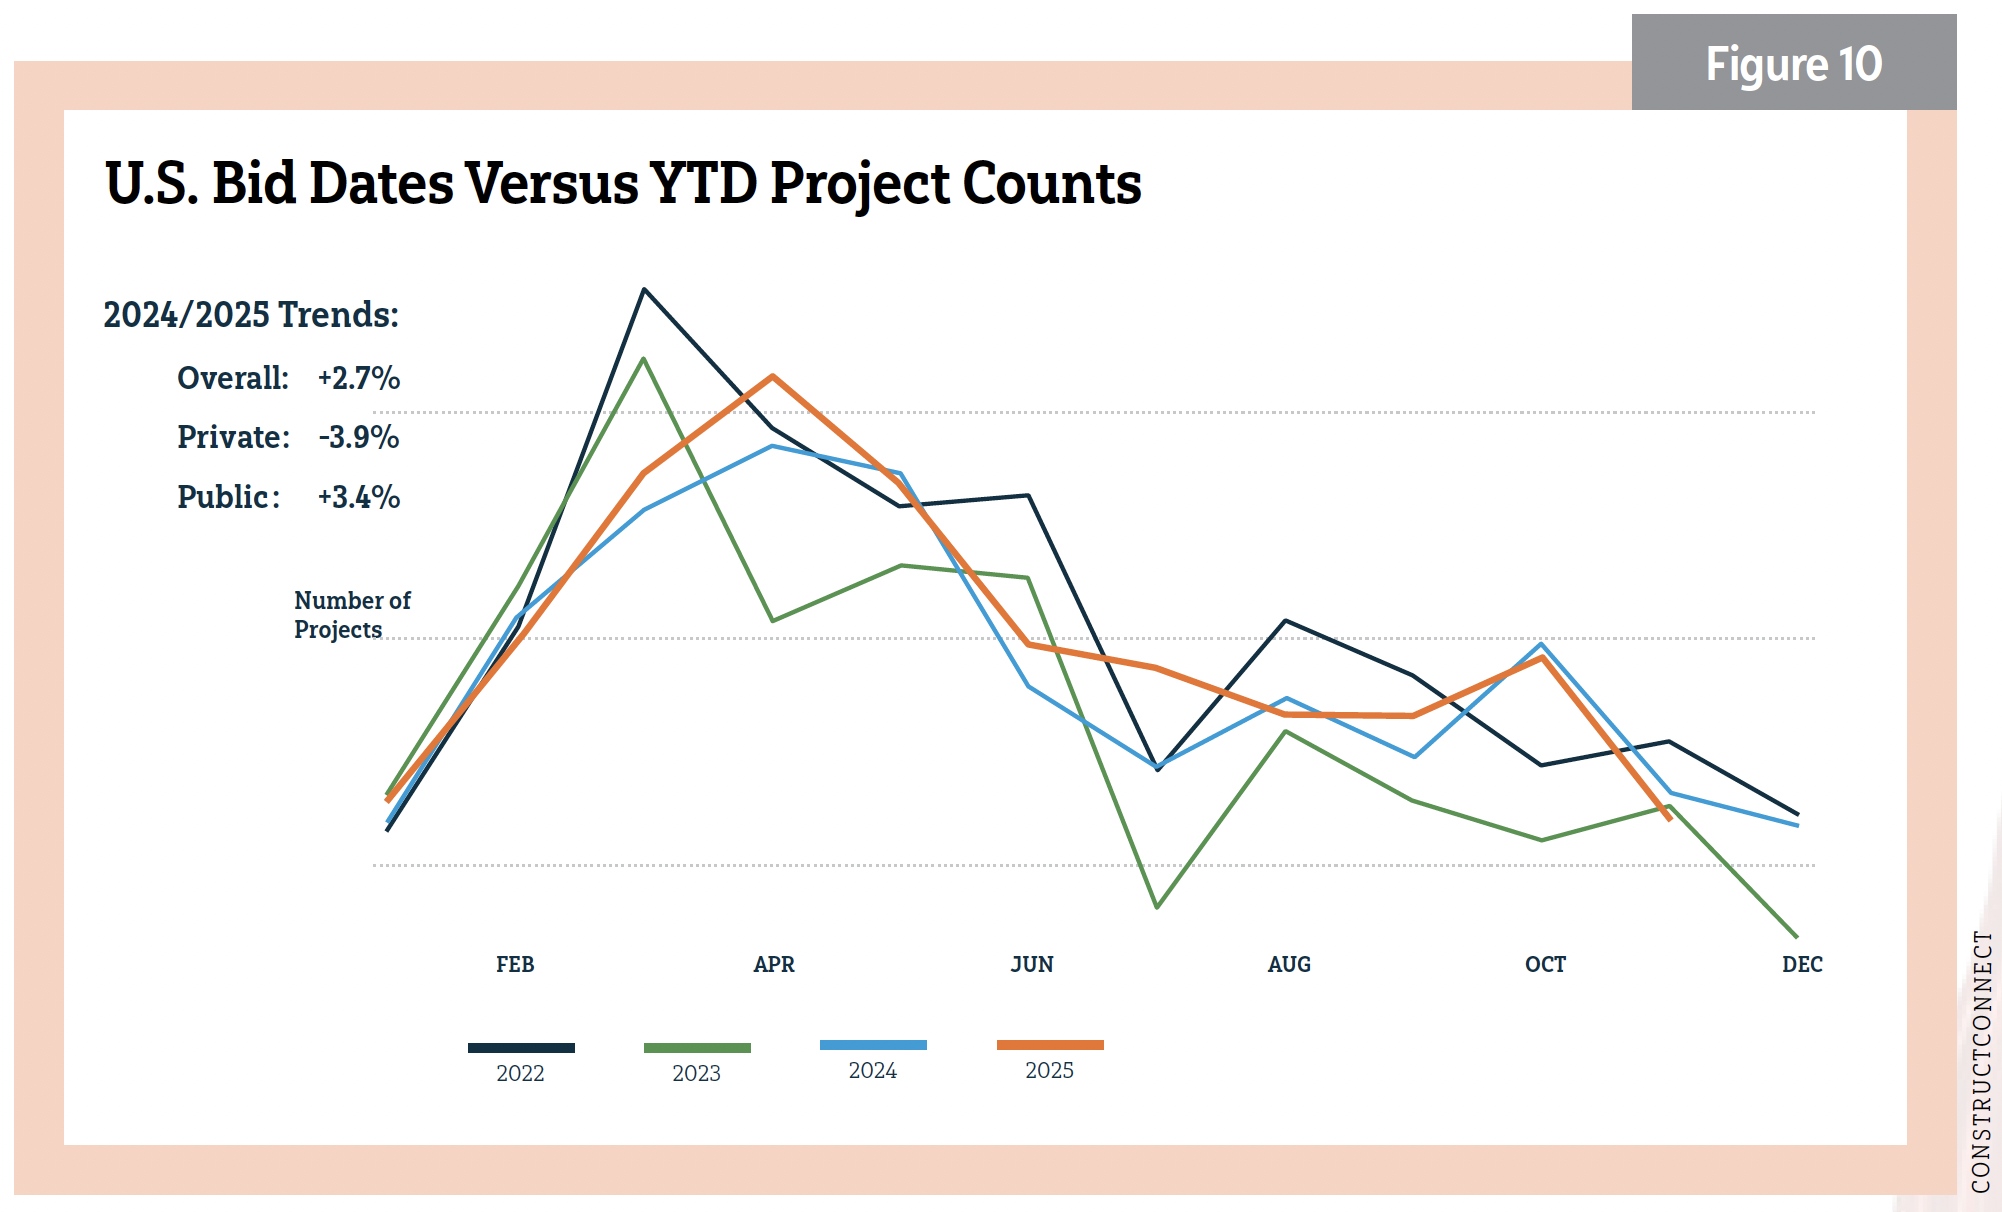
In commercial trends other than data centers, Kristy O’Brien, ConstructConnect’s director of private content acquisition, shared this outlook through the lens of bids: “In the United States, we continue to witness growth in sectors like retail and restaurants. We have seen an upswing in activities such as new grocery stores being constructed and companies repurposing existing locations from one brand to another. Former office spaces are being converted into residential and other commercial use. Several experts suggest repurposed spaces could be prime candidates for healthcare facilities. That may contribute to the observed increase in medical building uses. Additionally, there has been a rise in construction for educational and new medical facilities. In the last three months alone [September to October 2025], we have seen a 25% increase in civil bidding work, too.” See Figure 10.
The workforce
The Bureau of Labor Statistics (BLS) reported construction employment increased by 19,000 positions in September 2025, which is the latest data available. The demand for public construction, including a large civil demand, helped. Unemployment among workers with recent construction experience reached 3.8% in September, below the nonfarm rate of 4.3% (not seasonally adjusted).
“Despite some significant economic uncertainties, construction firms remain optimistic enough to continue adding to their payrolls,” said Jeffrey D. Shoaf, CEO of the Associated General Contractors of America (AGC), Arlington, Va. “The best way to sustain that momentum is by providing clarity about tariff levels, stabilizing materials prices and developing a more robust workforce.”
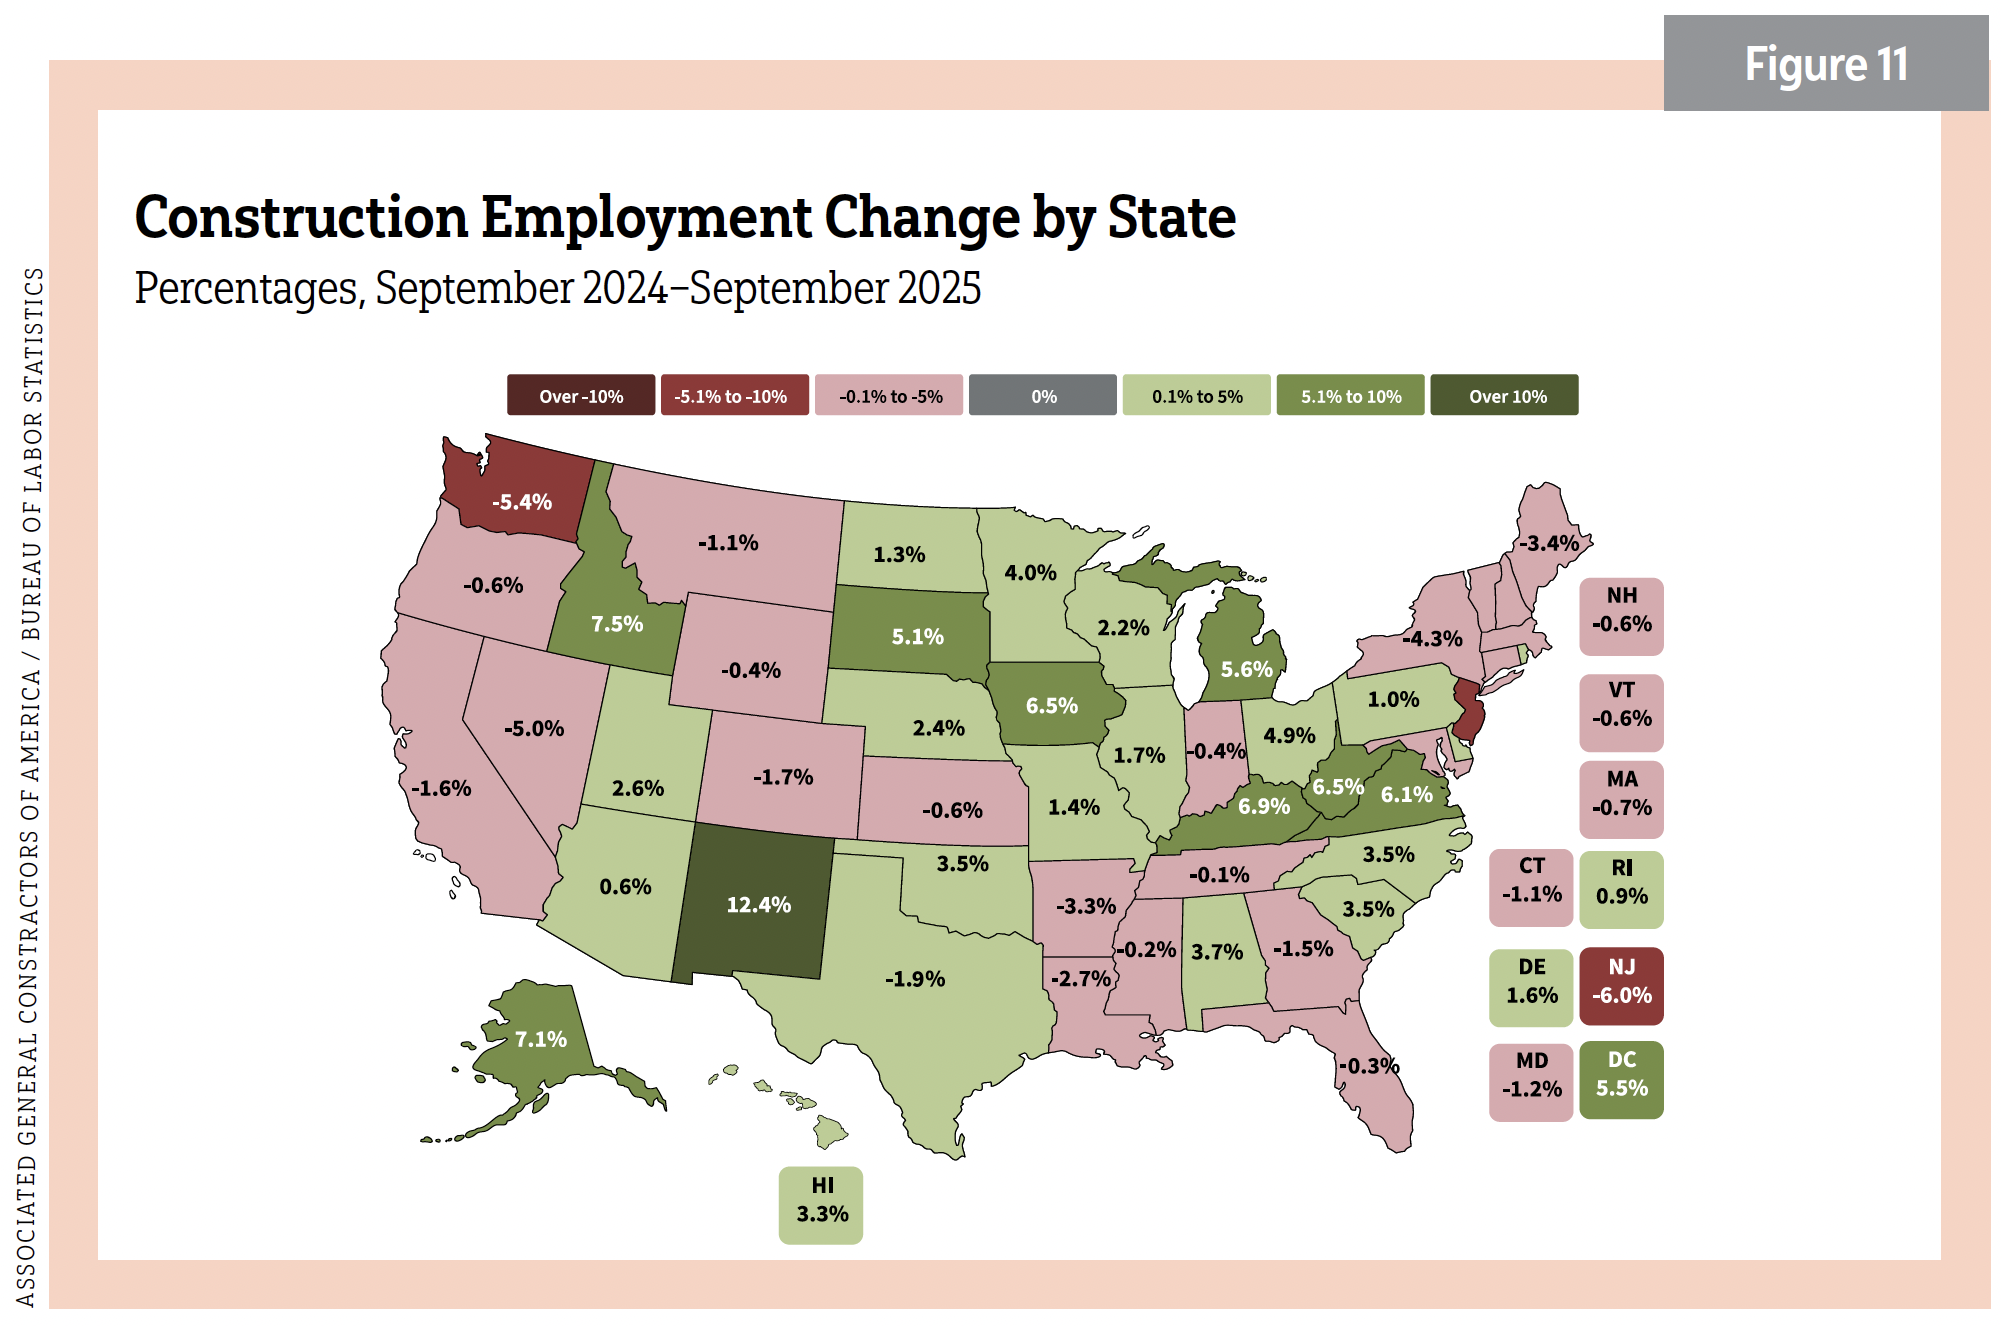
Ken Simonson, chief economist for AGC, reported that while 27 states had an increase in employment (September 2025 y/y), a softness has taken hold. Texas and New Mexico recorded the largest y/y gains, while New York and New Jersey experienced the steepest annual declines. On a monthly basis, Texas and Michigan posted the biggest job increases, while Florida and Mississippi reported the largest losses. Other states have been back and forth. See Figure 11.
“Contractors tell us that finding workers is still their No. 1 challenge,” Simonson said. “We conduct a survey [almost 1,500 responses from every state] that recently showed us that 94% of the firms who had an opening for craft workers say they were hard to fill, as did 92% of the firms with openings for salaried workers.”
AGC supports an organization called the Construction Labor Research Council, which analyzes all union settlements across the trades. January through September 2024 was up 4.7%.
“Three years ago, wage increases were typically under 3%, so this is building a wages floor not just for union workers, but crafts workers overall,” Simonson said. He expects wages for craft workers to rise 4.5%–5% in 2025.
“I think immigration policy will be an extremely important factor in the next several years,” Simonson said.
According to a Nov. 20, 2025, BLS press release, “Job losses occurred in transportation and warehousing and in federal government.” Meanwhile, the nonfarm unemployment rate stood at 4.4% in September 2025. The consensus is that a weakened labor market is taking hold. Dodge expected 4.2% unemployment on average in 2025 and 4.7% in 2026.
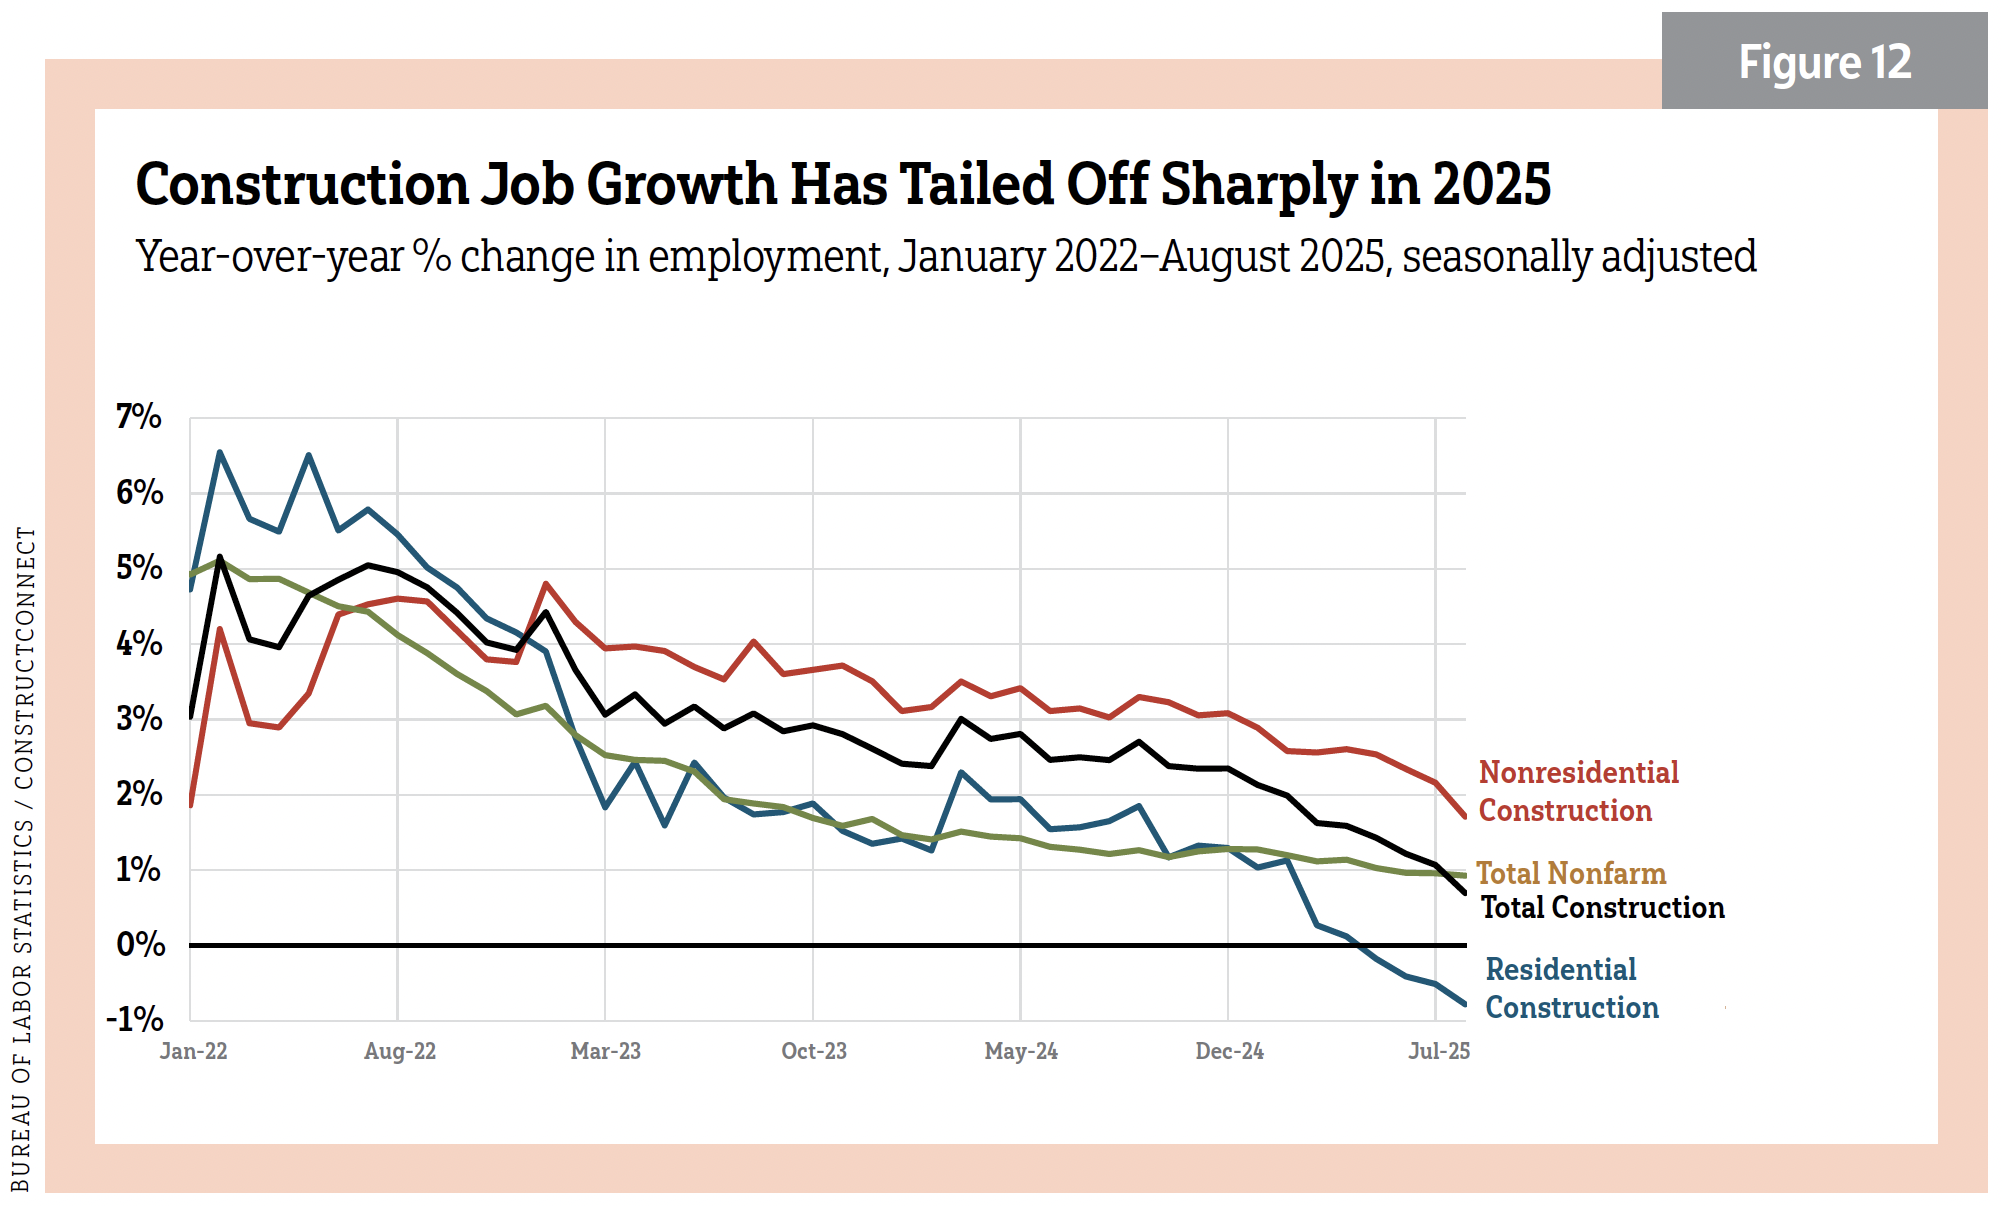
Meanwhile, growth in construction employment has been trending downward over the past three years. See Figure 12.
Product costs are steady-ish
Simonson found construction-related Producer Price Index costs in 2025 reflected some moderate price increases from 1%–3%, but the effect of tariffs looms.
“The index for copper and brass mill shapes went up 11% y/y [September 2025],” Simonson said. “Steel mill products and diesel fuel, however, had huge double-digit declines on a 12-month basis. The futures prices for copper and diesel fuel have continued to drop sharply in the last week or two [November 2025].”
While Simonson reported a healthy supply chain, a shortage of transformers and switchgear continues.
Residential leveling up for 2026?
In December 2024, economists for the National Association of Homebuilders (NAHB), Washington, D.C., estimated end-of-year starts for residential would reach 1.3 million in 2025. Last November’s figures had already reached that number.
“I was pleasantly surprised,” said Danushka Nanayakkara-Skillington, assistant vice president for forecasting and analysis for NAHB. “We were optimistic a year ago regarding single-family. We thought we would hit a million but came in at 950,000. I blame the unanticipated 7% mortgage rates from earlier in the year, which really hurt the housing market. Conversely, we were more pessimistic regarding multifamily, expecting 320,000 starts in 2025. Instead, we estimate 400,000. Household formations are taking place in this sector as demand continues with young adults as single-family purchases.”
The National Association of Realtors reported the average age of first-time homebuyers is now 40. Further, the organization expects home sales to jump 14% in 2026, as it anticipates easing mortgage rates, continued job gains and improved market stability.
“Holding steady” looks to be the housing theme for 2026. NanayakkaraSkillington expects flat conditions for residential overall forecasting at 1.35 million starts; 950,000 again for single-family and 396,000 for multifamily.
“I think single-family this year [2025] hit its bottom,” she said. “In our forecast when looking at the quarterly levels, numbers rise from the first quarter of 2026.”
Nanayakkara-Skillington hopes that mortgage rates stabilize. See Figure 13.
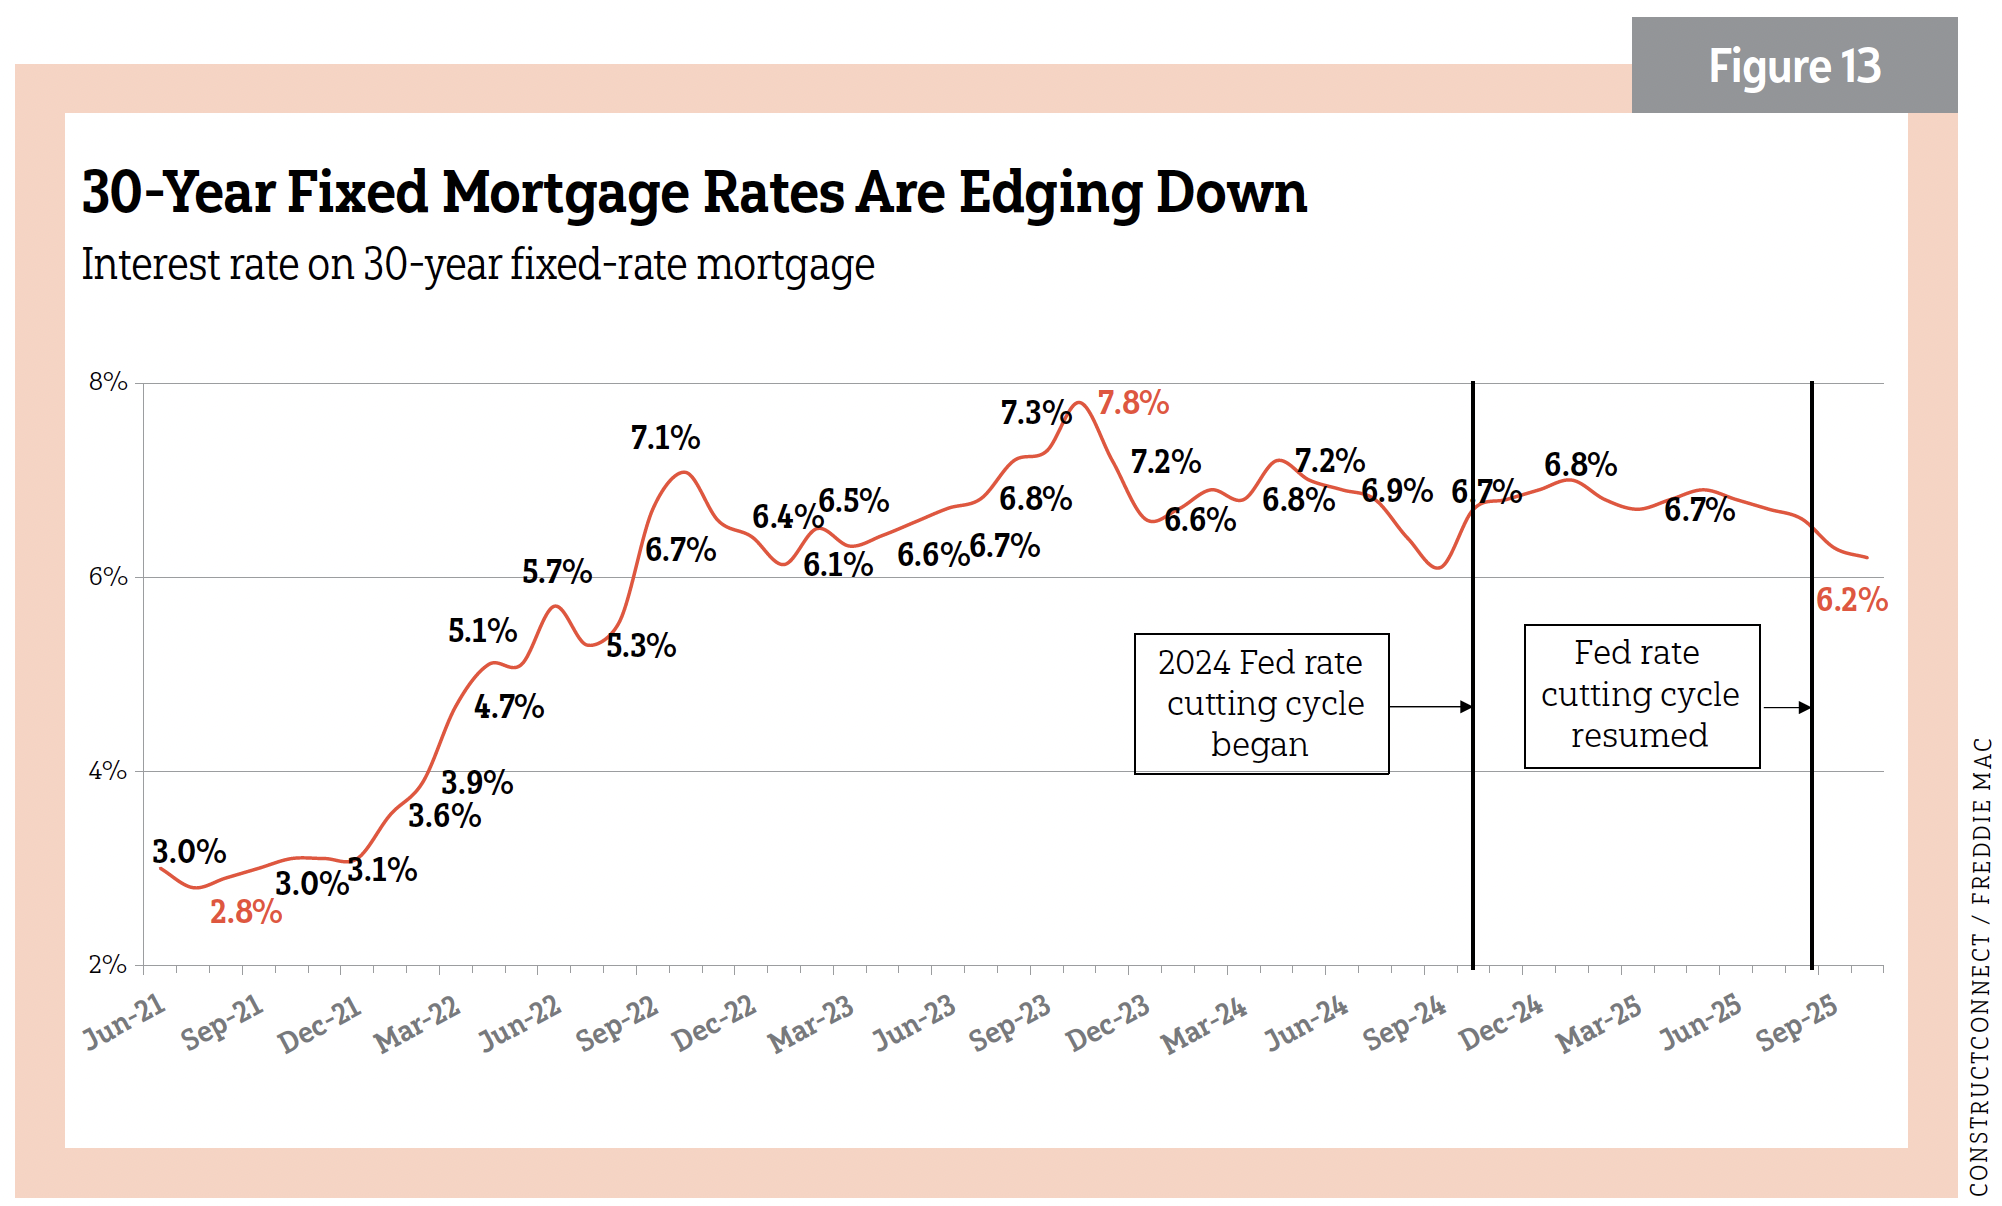
“Right now [first half of November 2025], the 30-year rate is 6.2%, the lowest level in about a year. We expect around the same rate for 2026. We don’t expect 6% or just below 6% until 2027. I do think single-family will lift off by the end of 2026 into 2027. Multifamily [starts] should settle between 383 to the 390s [thousands] by that time,” she said.
Continued easing by the Federal Reserve would push along residential construction.
“That’s going to help construction through an improved climate for acquisition, development and construction financing,” Nanayakkara-Skillington said.
In what could be a gradual tailwind, states and cities are starting to more aggressively enact favorable zoning to promote housing affordability. California and Chicago are doing so for multifamily.
“Our motto is let the builders build,” she said. “We need housing at every level. It’s not just single-family detached. We need multifamily housing. We need garden-style and town homes. Whatever the localities are open to, that is a win.”
Nanayakkara-Skillington added the federal government can help with regulatory barriers. She shared the regulation cost for single-family construction is about $94,000, about one-quarter of a new home’s construction cost. For multifamily developments, regulation is roughly 41% of the development cost.
“This is where the government can directly have an influence and bring those costs down. These are regulations at federal, state and local levels. If we tackle that, a huge cost barrier will be eliminated,” she said. “You can’t remove all regulations, but we are an overly regulated industry right now. And we can tackle the fact that we don’t have enough starter homes, affordable options.”
Sector performance and forecast
Starts information is supplied by Dodge (cited first) followed by ConstructConnect, unless otherwise noted. Some data can differ widely between the firms. Many are attributable to different vertical mixes and in how the data is collected. We try to reconcile those differences or cite them when they occur.
RESIDENTIAL
Single-family poised for recovery; multifamily marches on
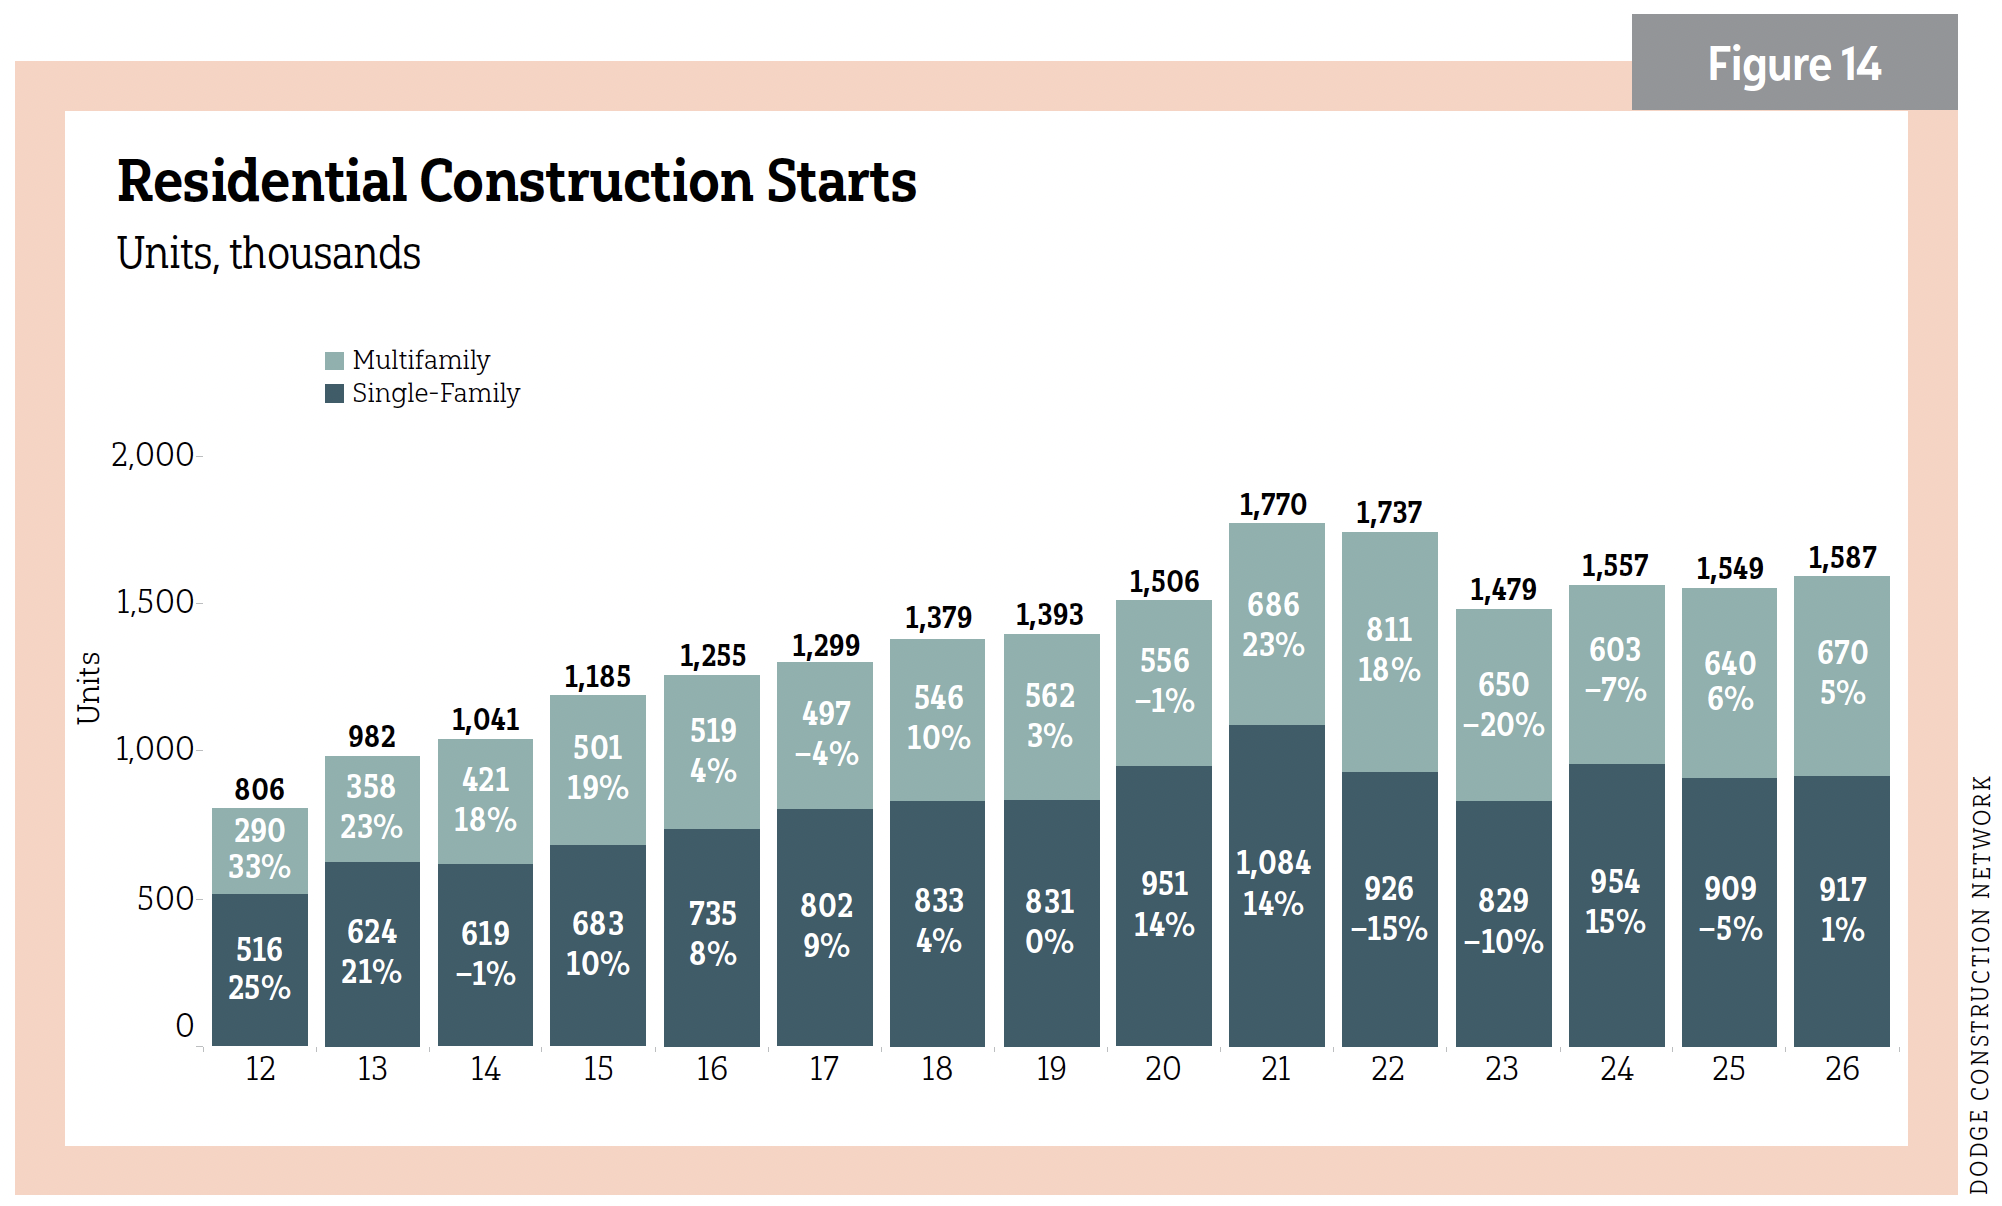
In January 2025, forecasters were optimistic that residential would turn a corner. Single-family went in the wrong direction as it contracted. Growth will return this year. Multifamily stayed true to growth in 2025, though projections for 2026 are a little less than previously predicted. Support will be needed, including 30-year fixed rates remaining closer to 6%, more favorable rezoning for multifamily, a collective housing affordability effort and improved builder financing. See Figure 14.
Residential (overall)
- 2025 (Dodge) 1%/1,549 million units and 0%/$395 billion; (ConstructConnect) –8.8%/$285.58 billion*; (NAHB) 1,354 billion units**
- 2026 (Dodge) 6%/1,587 million units and 6%/$418 billion; (ConstructConnect) 9.9%/$313.80 billion*; (NAHB) 1,346 billion units**
*ConstructConnect did not provide units
**NAHB did not provide dollar amounts
Single-family
- 2025 (Dodge) –5%/909,000 units and –6%/$418 billion; (ConstructConnect) –6.9%/$189.75 billion; (NAHB) 944,000 units
- 2026 (Dodge) 1%/917,000 units and 4%/$262 billion; (ConstructConnect) 11.8%/$211.45 billion; (NAHB) 950,000 units
Multifamily
- 2025 (Dodge) 6%/640,000 units and 13%/$144 billion; (ConstructConnect) –15%/$95.8 billion; (NAHB) 410,000 units
- 2026 (Dodge): 5%/670,000 units and 9%/$156 billion; (ConstructConnect) 6.7%/$102.3 billion; (NAHB) 396,000 units
RentCafe listed the Top 10 metros for new apartments. The Top 5, including estimates of total deliveries, are New York City (30,023); Dallas (28,958); Austin, Texas, (26,715); Phoenix (21,188); and Atlanta (17,512). A project of note under construction is Skytown, a 34-acre former office park in St. Petersburg, Fla. It is being redeveloped into a mixed-use center with 2,084 apartments, 69,000 square feet (sf) of retail, a farmers’ market and 120,000 sf of self-storage.
COMMERCIAL
All hail data centers
- 2025: (Dodge) 8%/$183 billion; (ConstructConnect) 4.5%/$170.5 billion
- 2026: (Dodge) 7%/$195 billion; (ConstructConnect) –3.2%/$165 billion
Growth in commercial was evidenced by what Dodge saw as 8% gains in 2025 and an expected 7% this year. ConstructConnect saw gains of 4.5% in 2025 but expects a contraction at 3.2% this year. Data centers were the thumb on the scale. ConstructConnect reported in November 2025 that U.S. data center starts were up 15.1% y/y. See Figure 15.
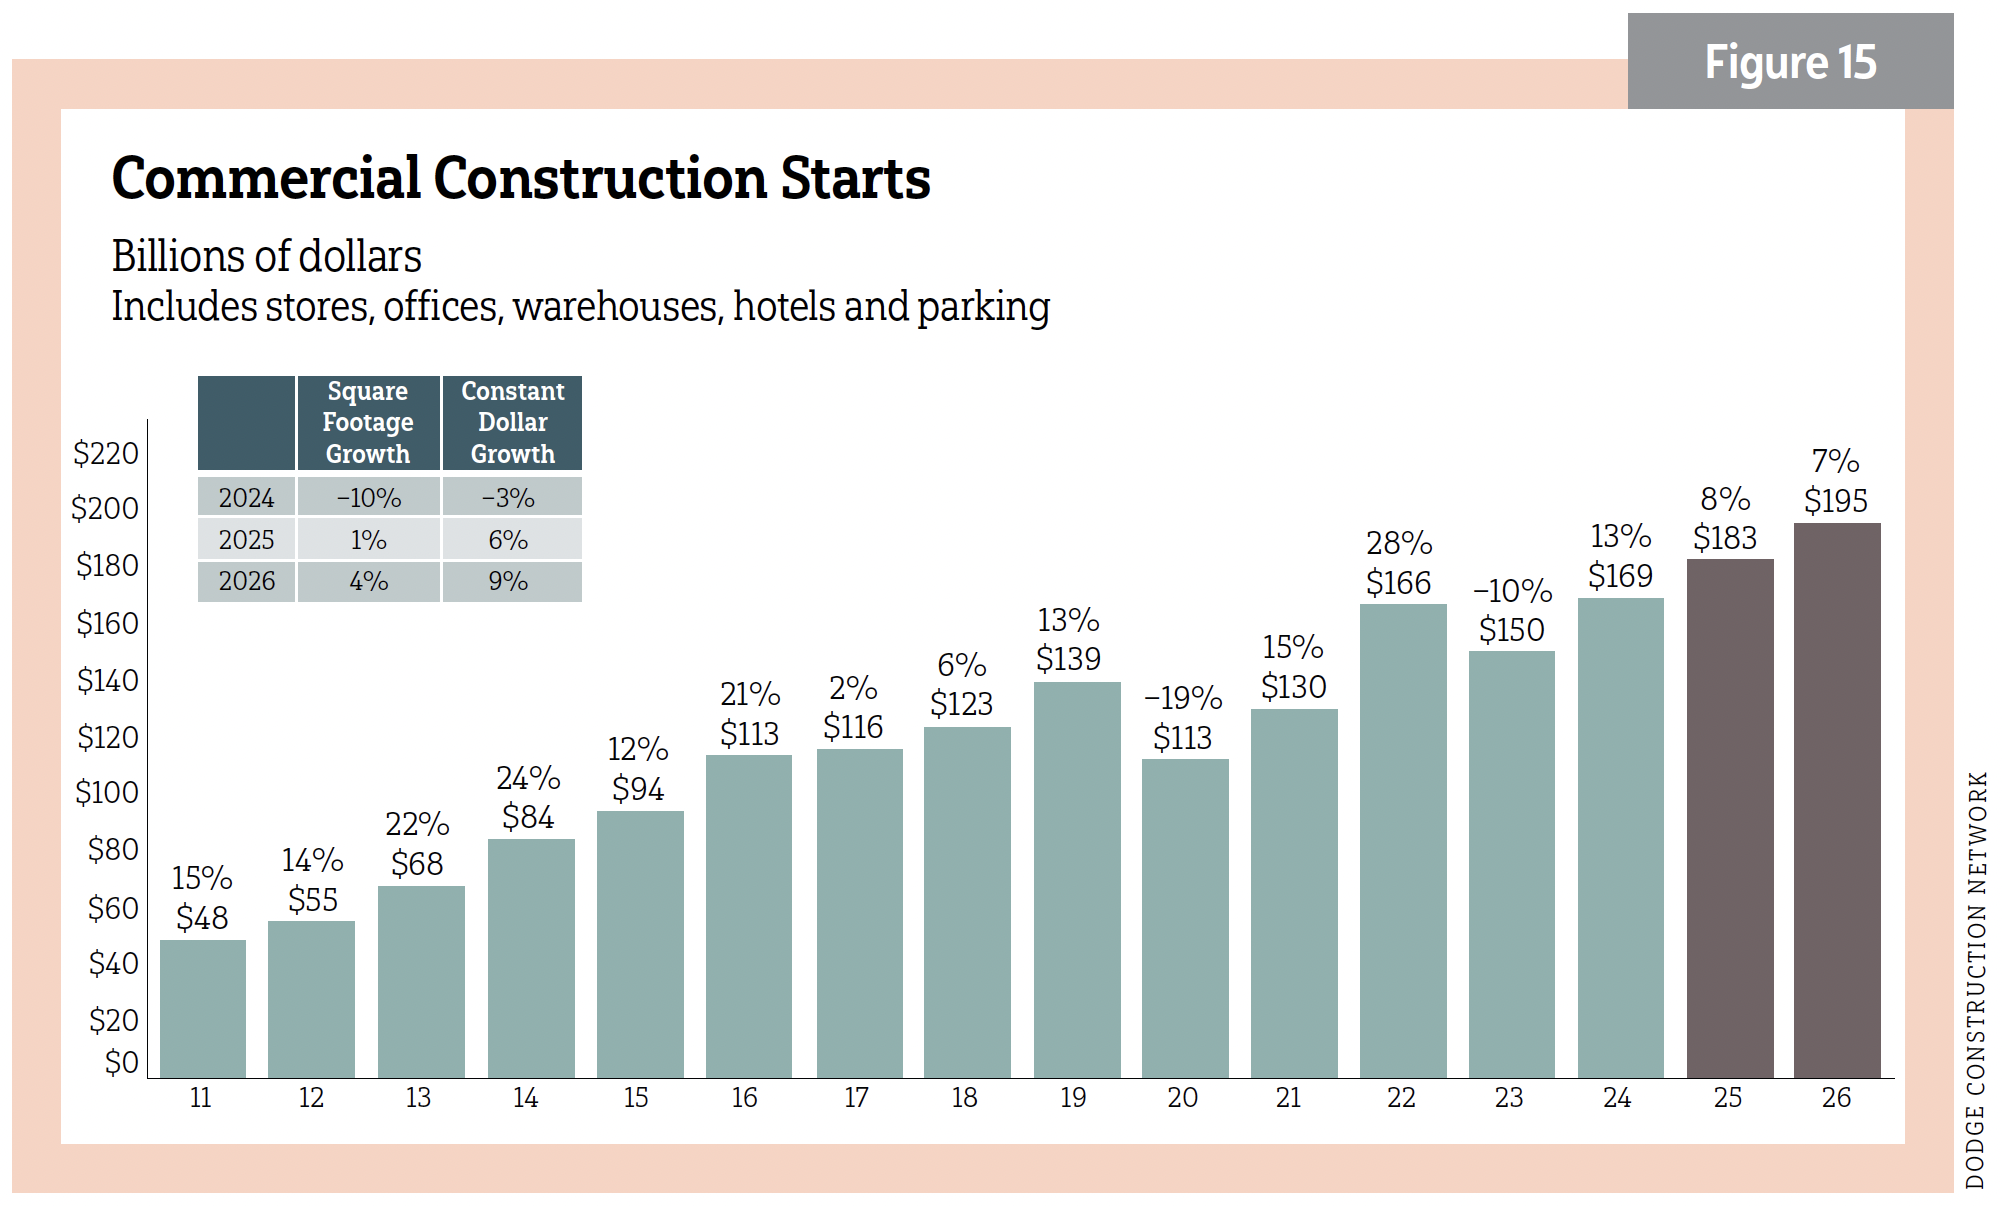
Further, while the average data center currently costs $193 million, billion-dollar megaprojects are becoming increasingly common, breaking ground each month. Dodge expects commercial construction growth to be more diversified in 2026, calling out retail, warehouse and hotel activity. That is good news for warehouse and hotel starts activity, both of which contracted in 2025. Commercial starts growth stood at 15% y/y. ConstructConnect saw a –6.5% y/y contraction. There were some mixed results in various subcategories. Winners as of September 2025 included sports stadium/convention centers, offering 63.3% y/y growth. The new $1.5 billion Las Vegas Stadium for Major League Baseball’s Athletics moved the needle.
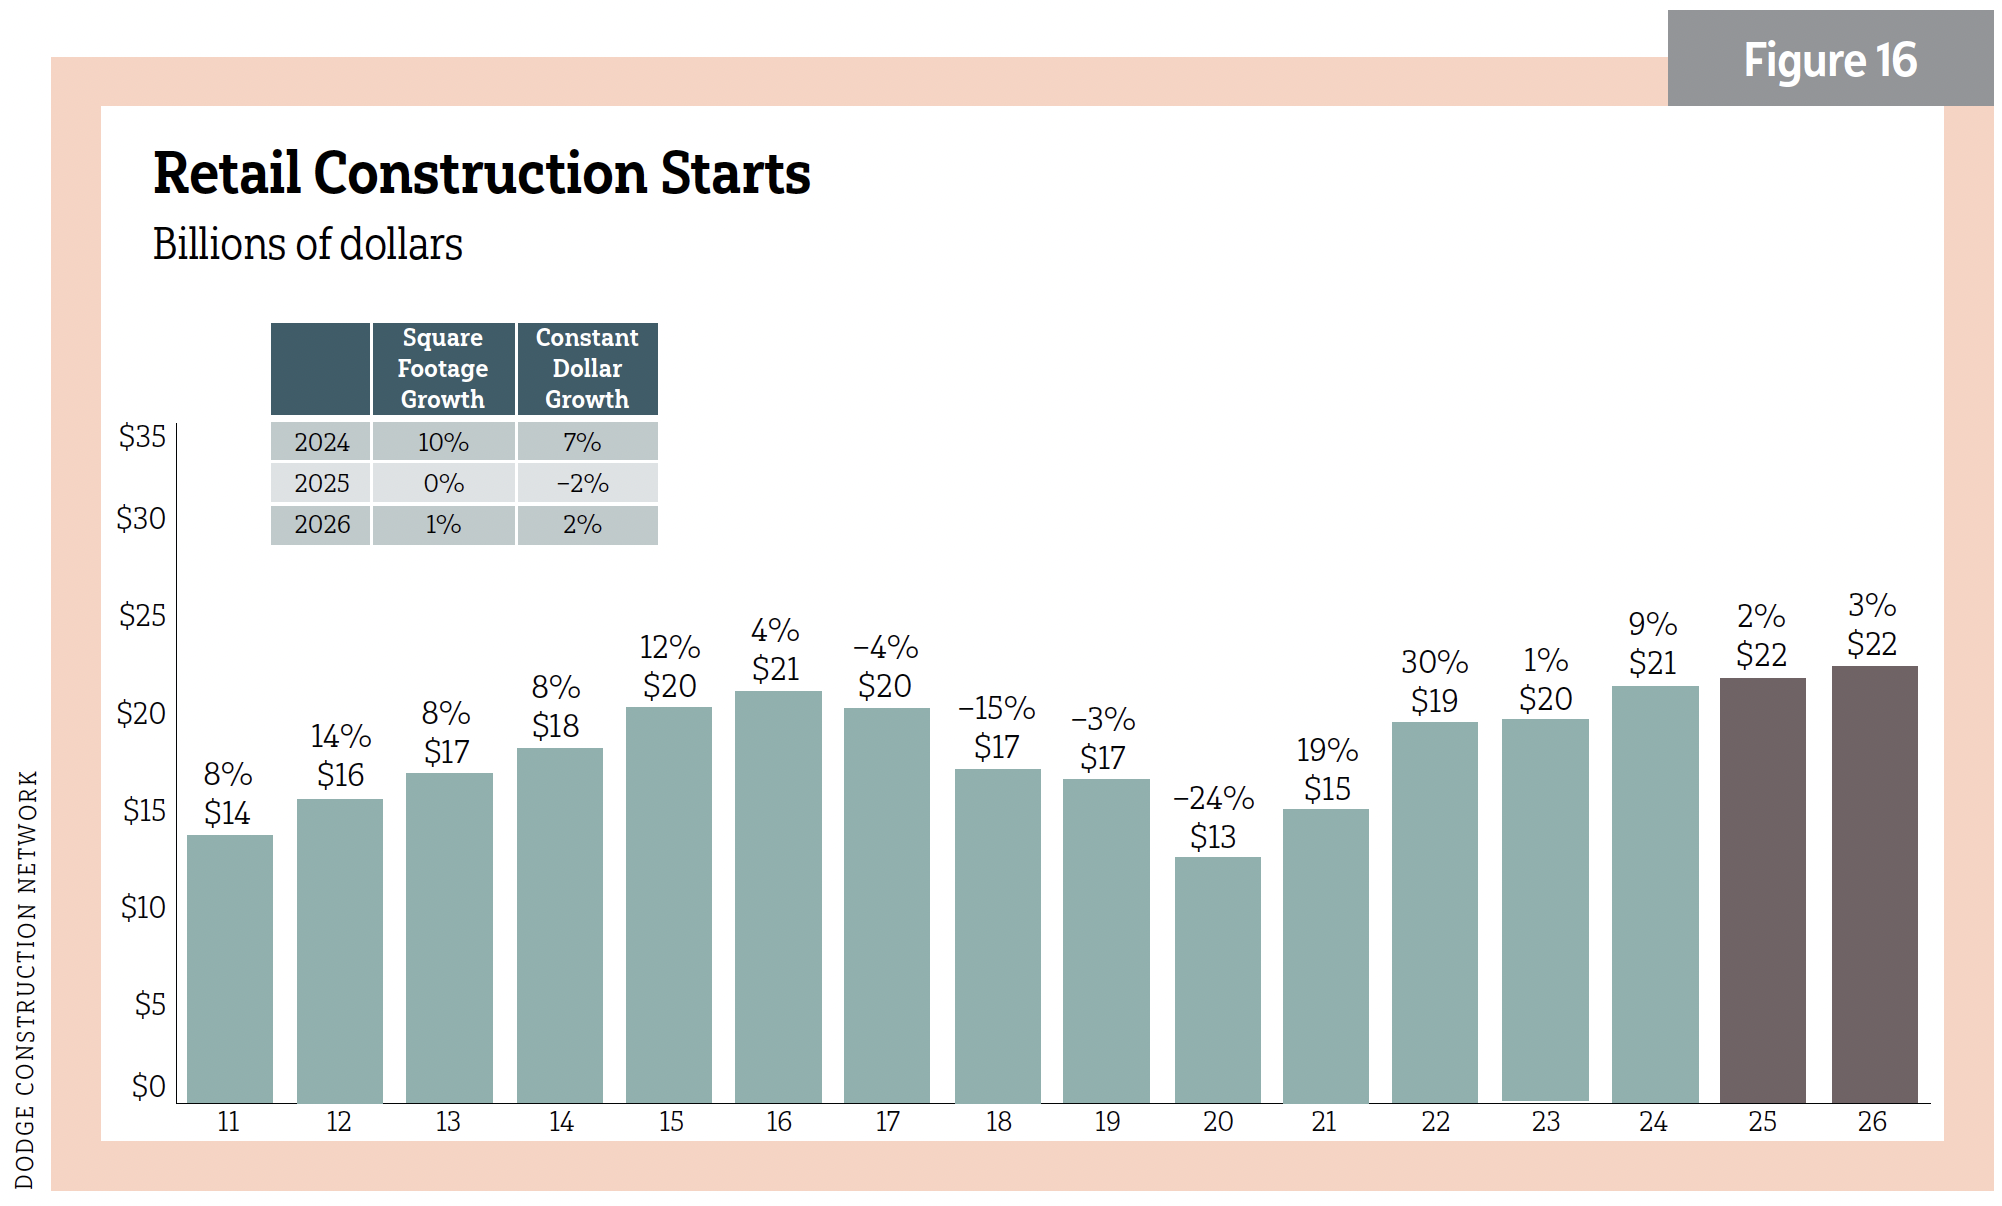
Retail
- 2025: (Dodge) 2%/$22 billion; (ConstructConnect) 1.5%/$14 billion
- 2026: (Dodge) 3%/$22 billion; (ConstructConnect) 3.6%/$14.6 billion
See Figure 16.
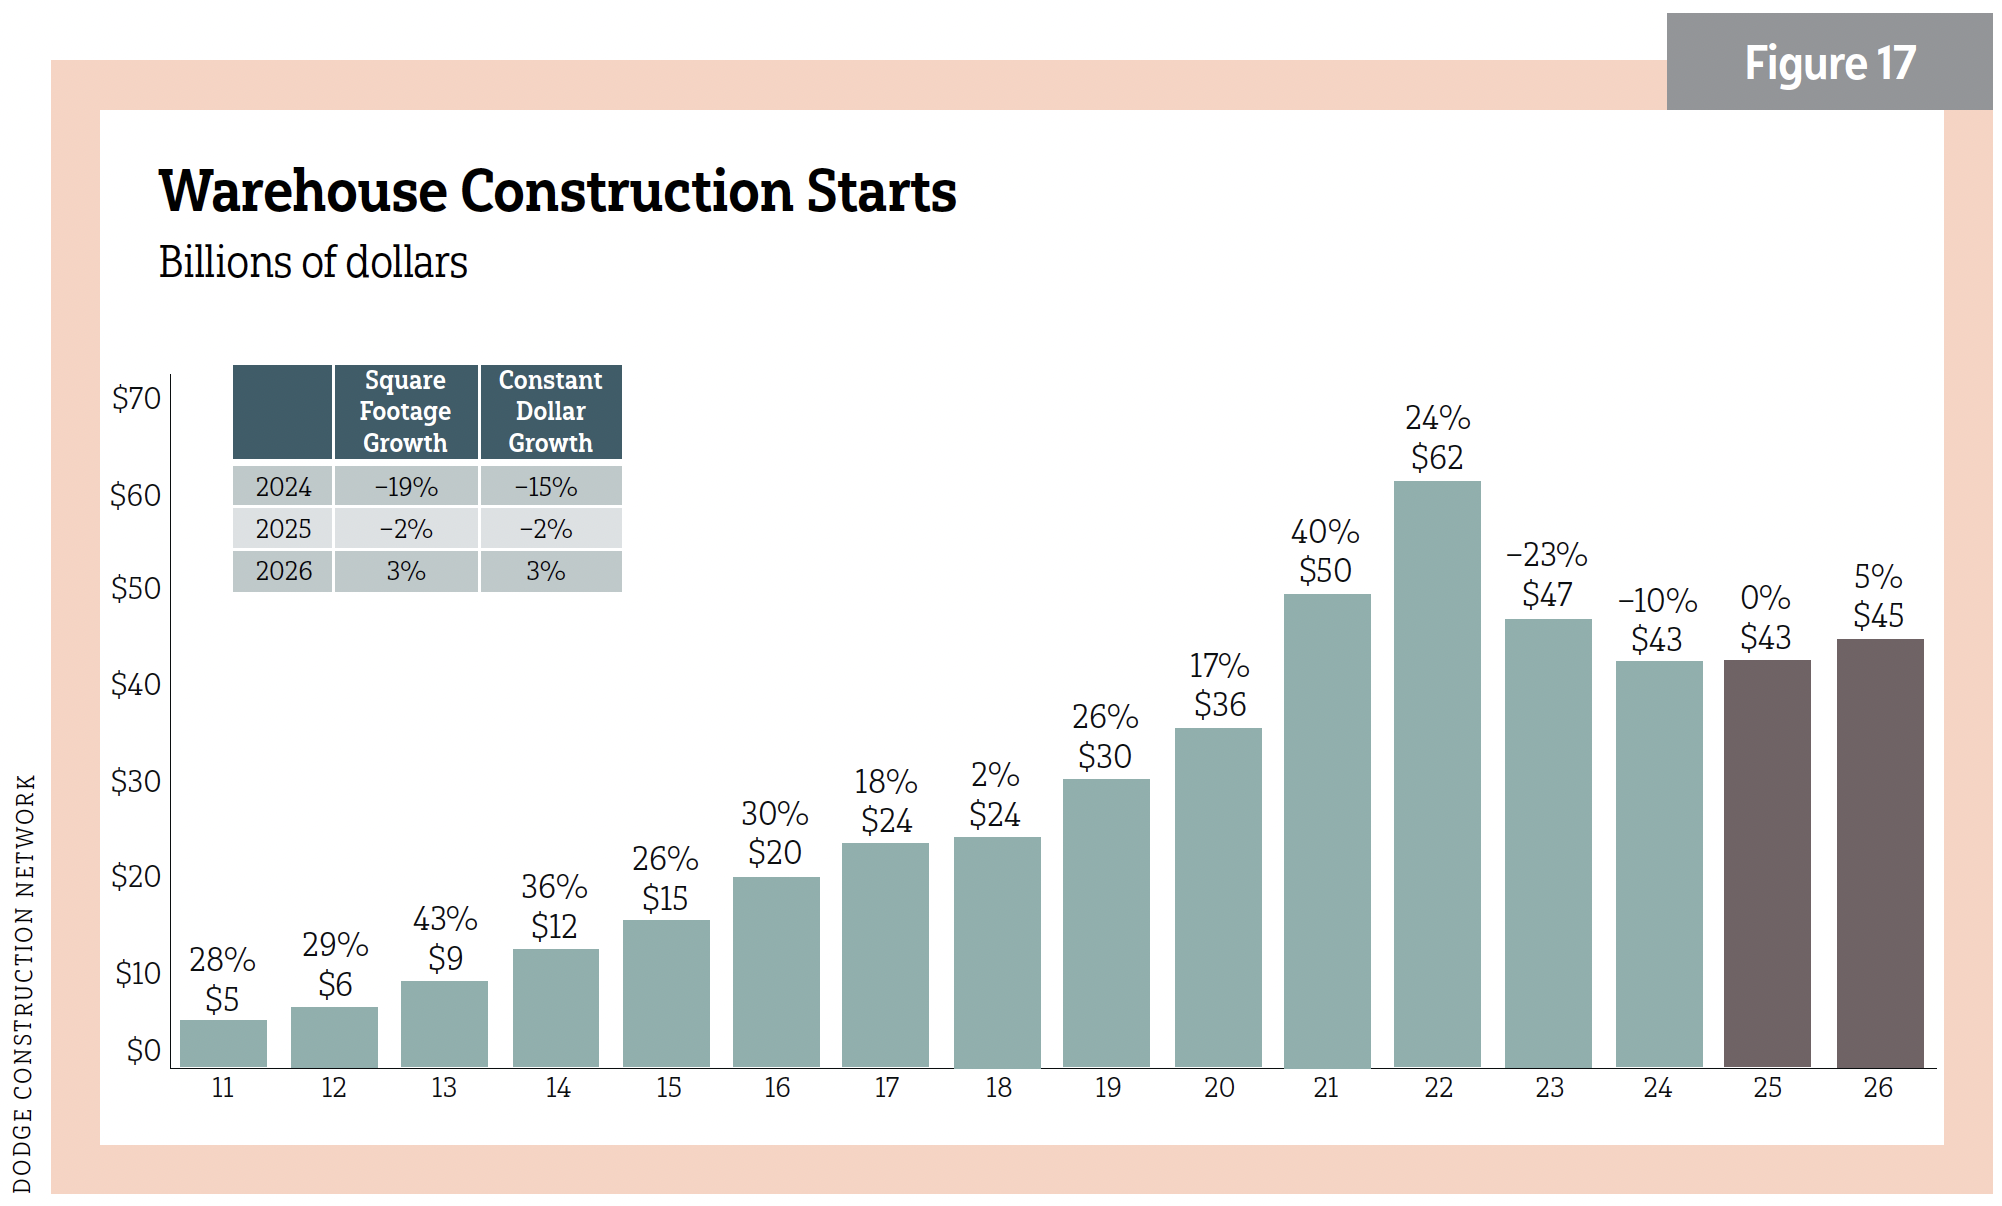
Warehouses
- 2025: (Dodge) 0%/$43 billion; (ConstructConnect) –22.6%/$19.17 billion
- 2026: (Dodge) 5%/$45 billion; (ConstructConnect) 2.4%/$19.64 billion
See Figure 17.
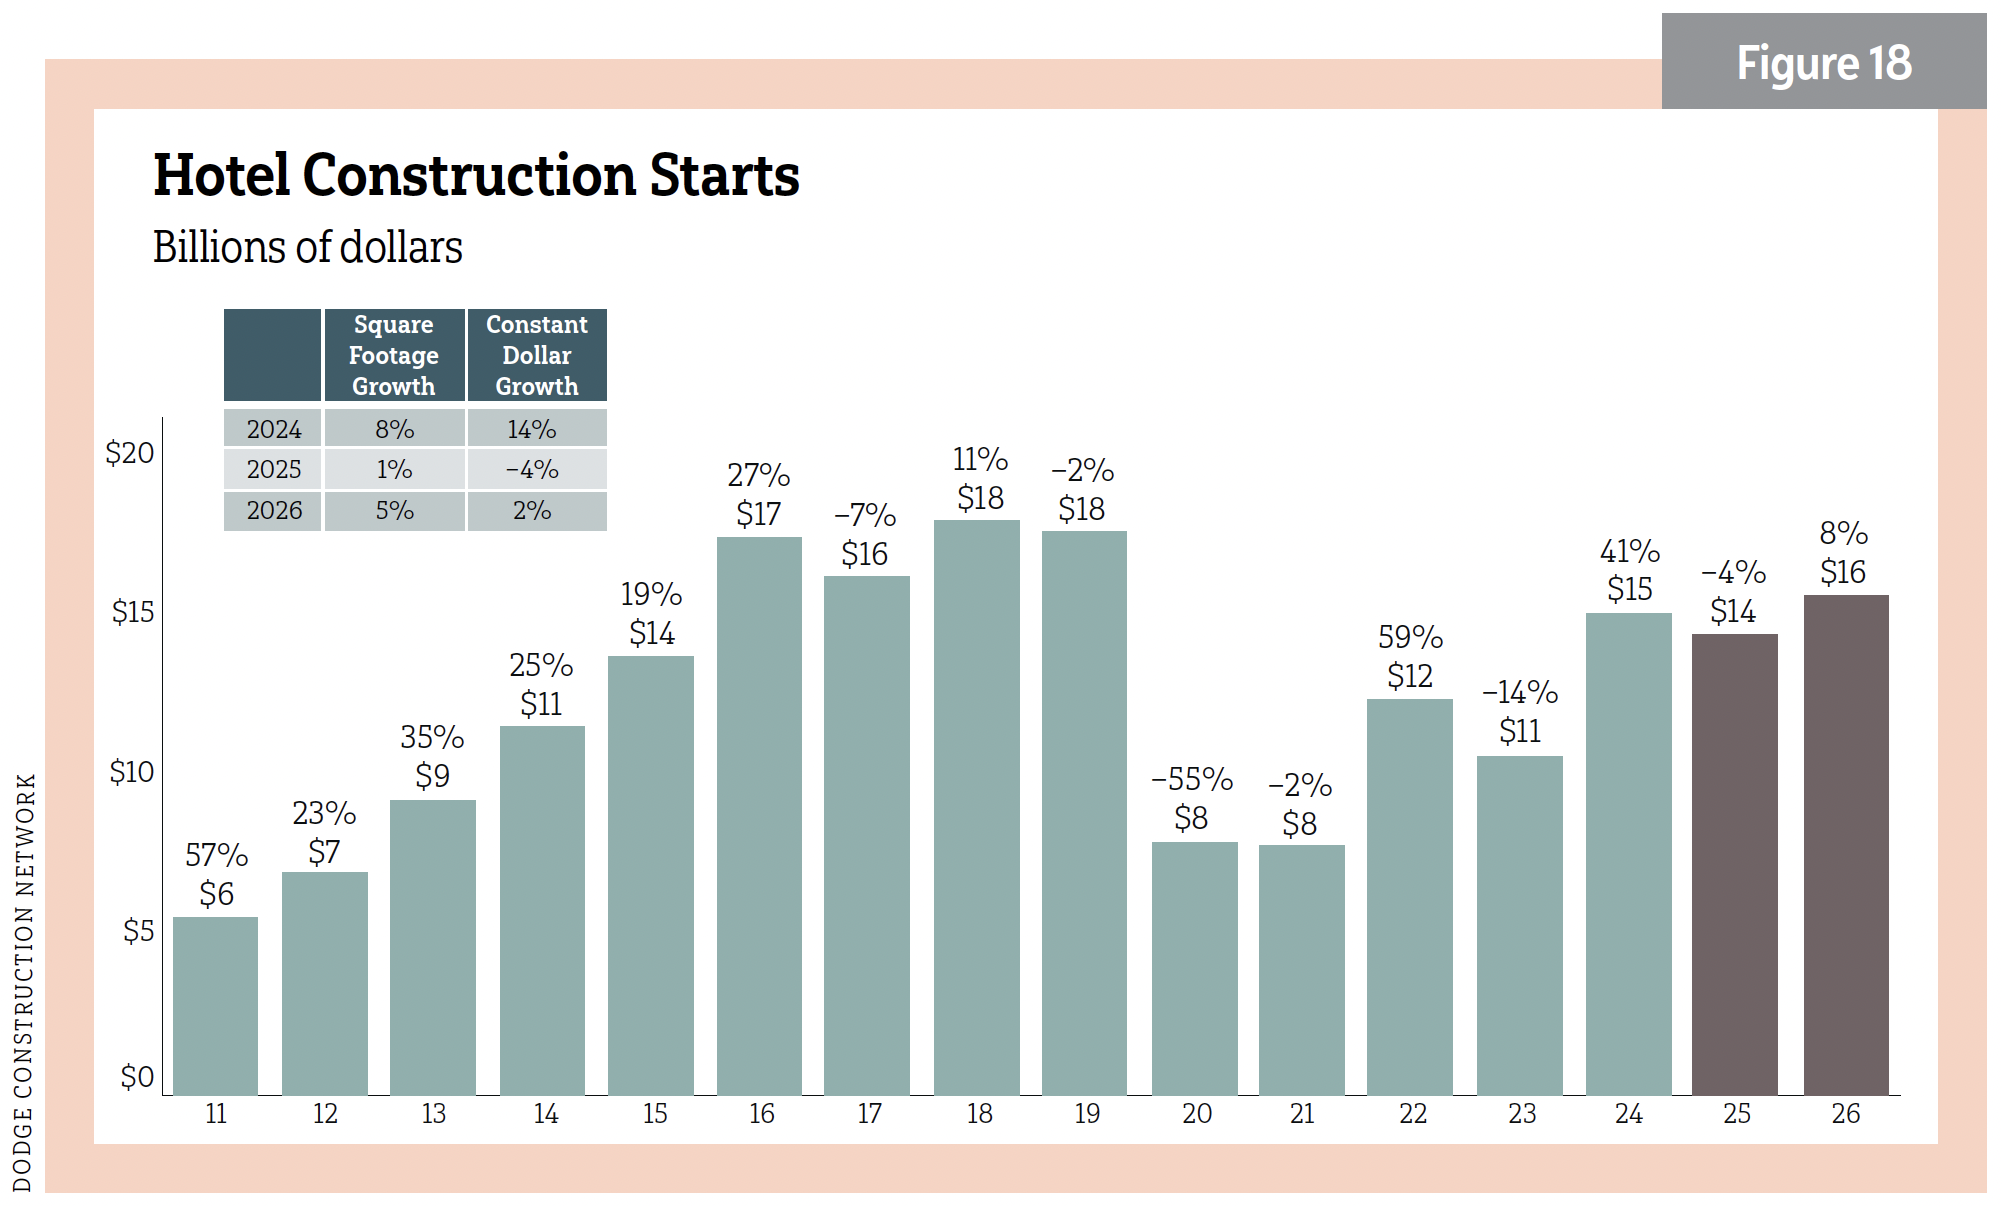
Hotels
- 2025: (Dodge) –4%/$14 billion; (ConstructConnect/with motels) –26.8%/$10.54 billion
- 2026: (Dodge) 8%/$16 billion; (ConstructConnect/with motels) 5.6%/$11.13 billion
See Figure 18.
Office buildings
- 2025: (Dodge) 16%/$85 billion; (ConstructConnect/private offices only) 36%/$55.7 billion
- 2026: (Dodge) 8%/$92 billion; (ConstructConnect/private offices only) –1%/$55.1 billion
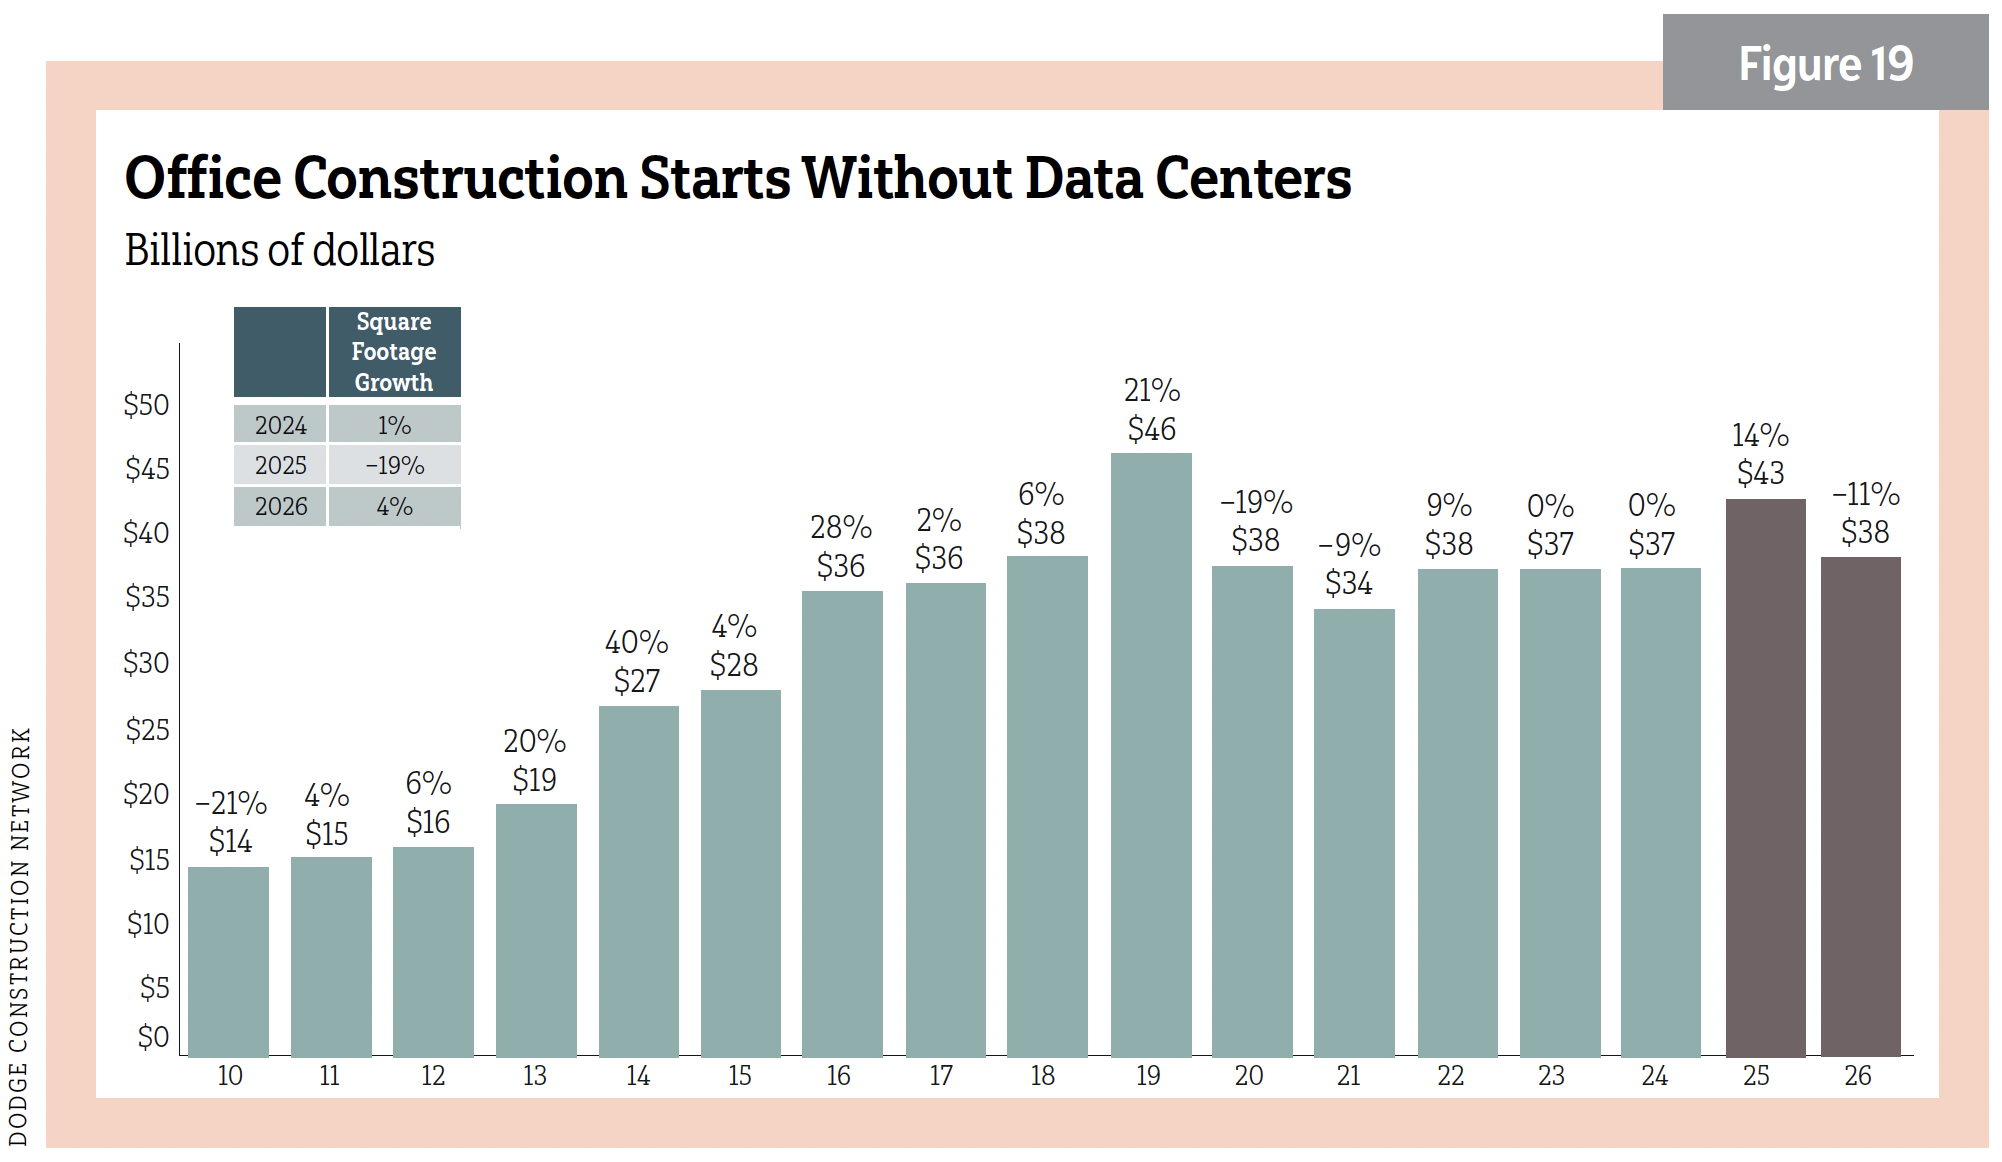
Office buildings without data centers
- 2025: (Dodge) 14%/$43 billion
- 2026: (Dodge) –11%/$38 billion
See Figure 19.
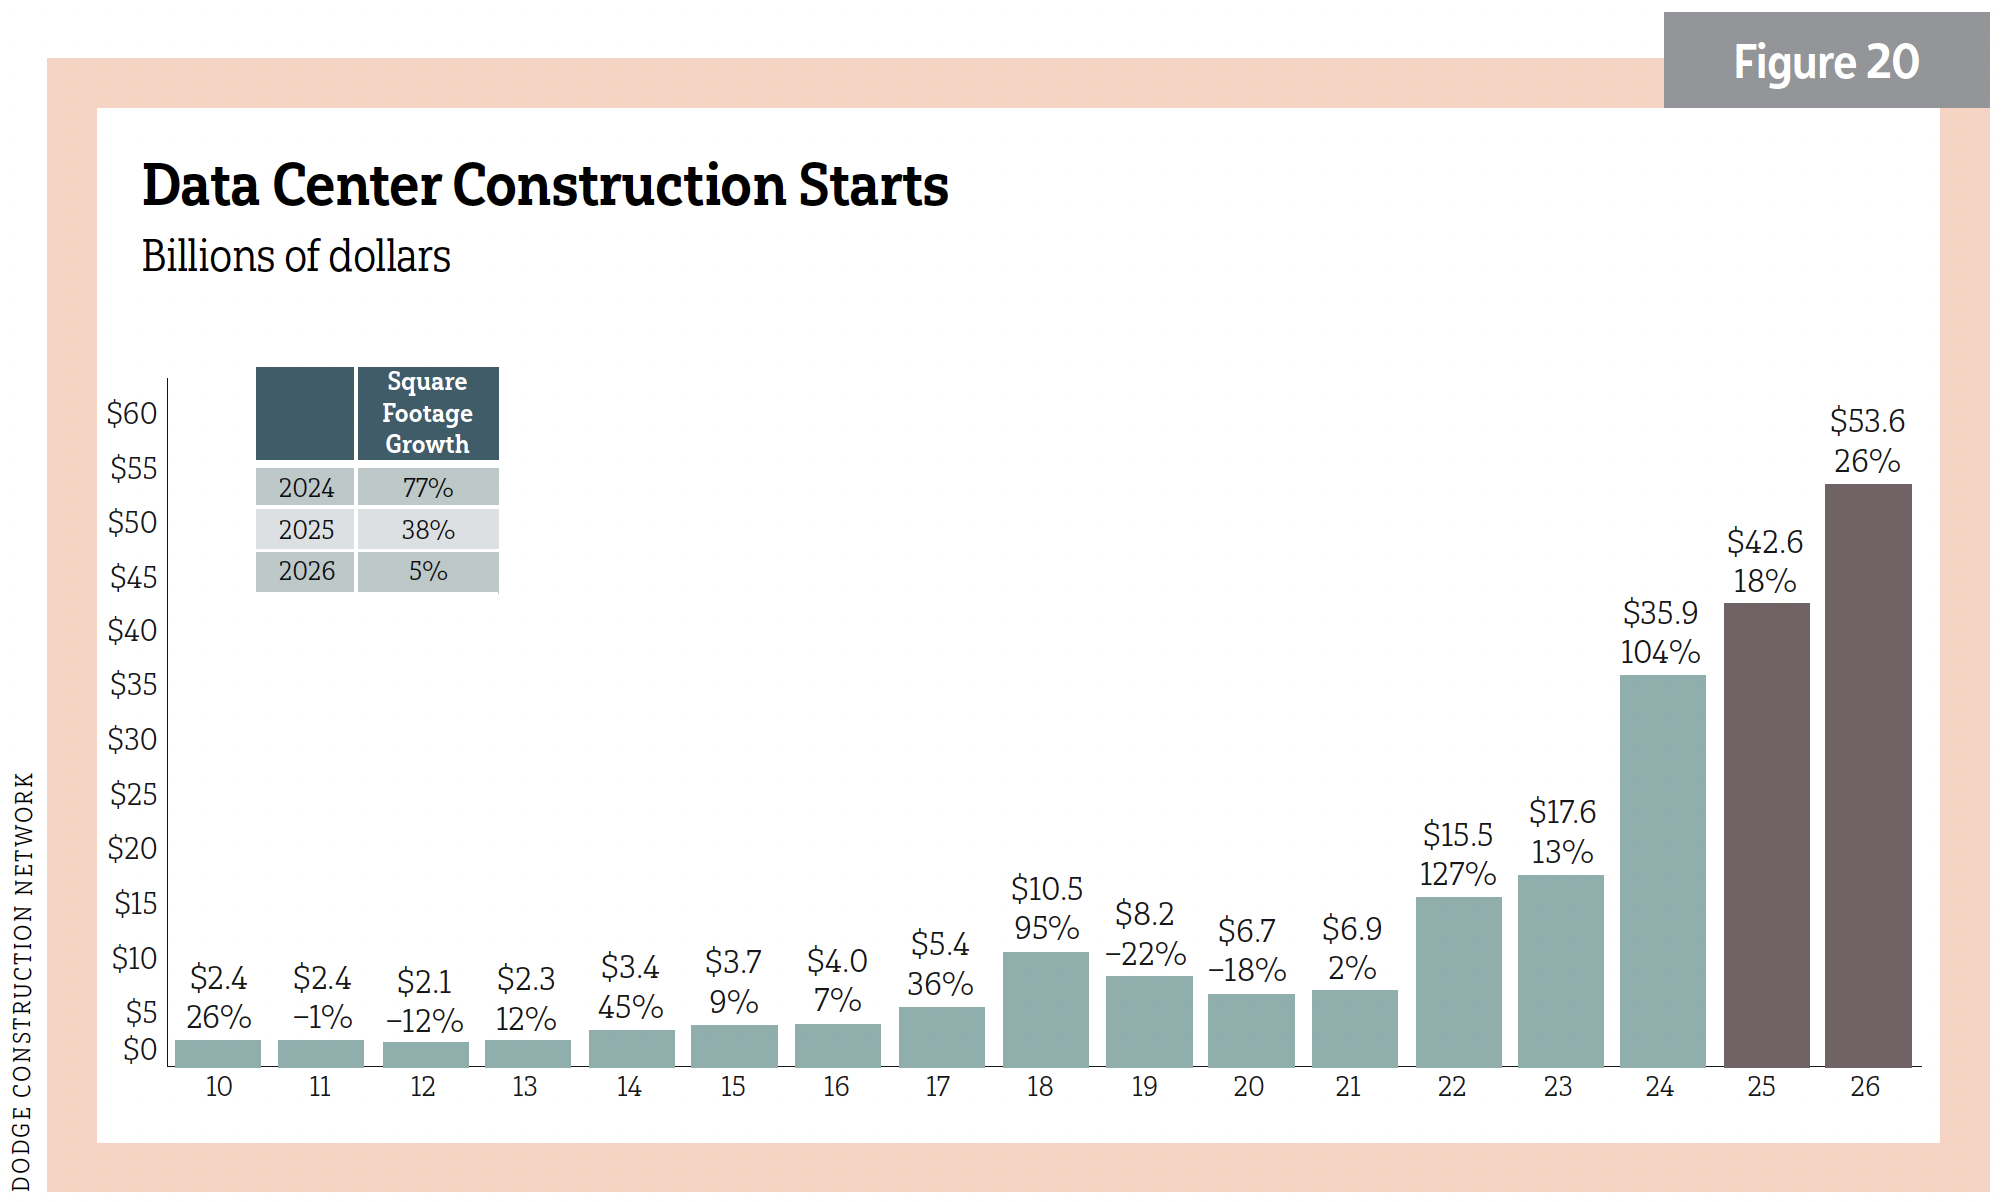
Data centers only
2026: (Dodge) 18%/$42.6 billion
2026: (Dodge) 26%/$53.6 billion
See Figure 20.
The top three commercial projects in October 2025 were the Avaio Data Center in Brandon, Miss. ($6 billion/600,000 sf); Hut 8 A.I. Data Center in Saint Francisville, La. ($2.5 billion/900,000 sf); and Grand Sierra Resort Expansion, Phase One in Reno, Nev. ($786 million/300,000 sf).
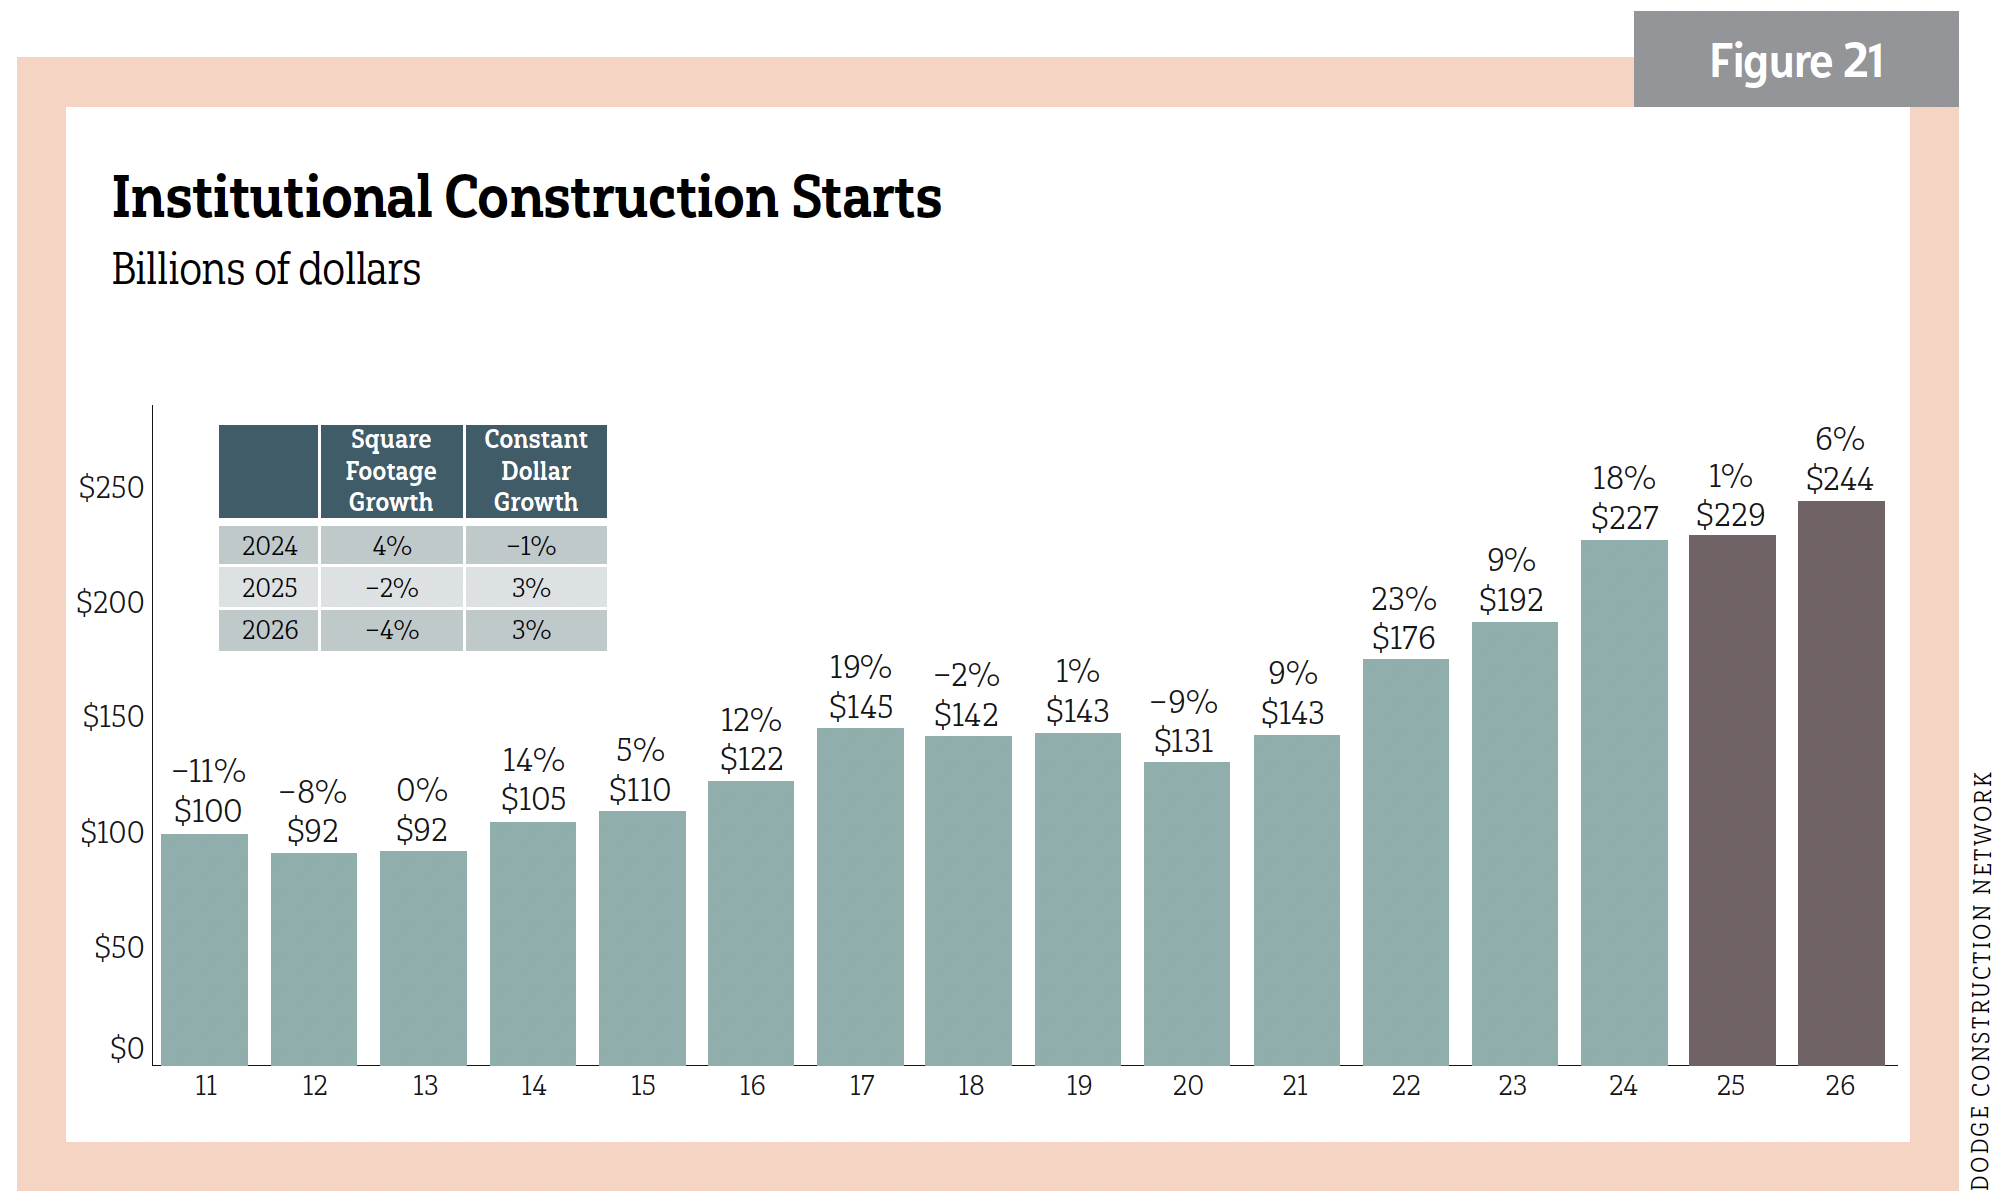
INSTITUTIONAL
Short-lived contraction
- 2025: (Dodge) 1%/$229 billion; (ConstructConnect) –8.8%/$168 billion*
- 2026: (Dodge) 6%/$244 billion; (ConstructConnect) –2.2%/$164.4 billion*
*ConstructConnect projections for this sector are harder to neatly quantify alongside Dodge. The estimates addressed below are largely within related Dodge subsectors.
Institutional growth fell to 1% as measured by Dodge. ConstructConnect saw a contraction of 8.8%. In 2026, Dodge sees 6% growth while ConstructConnect expects a lesser contraction of 2.2%. Pandemic-related cash has largely run its course. Education K–12 was boosted by state and local funding and is holding steady for now. Looming headwinds include states being responsible for a bigger share of disaster relief due to FEMA reorganization. Markets showing strength in 2025 included hospitals/clinics and police/fire stations. Prison funding fell after record 2024 spending. Military construction spending dropped, too. See Figure 21.
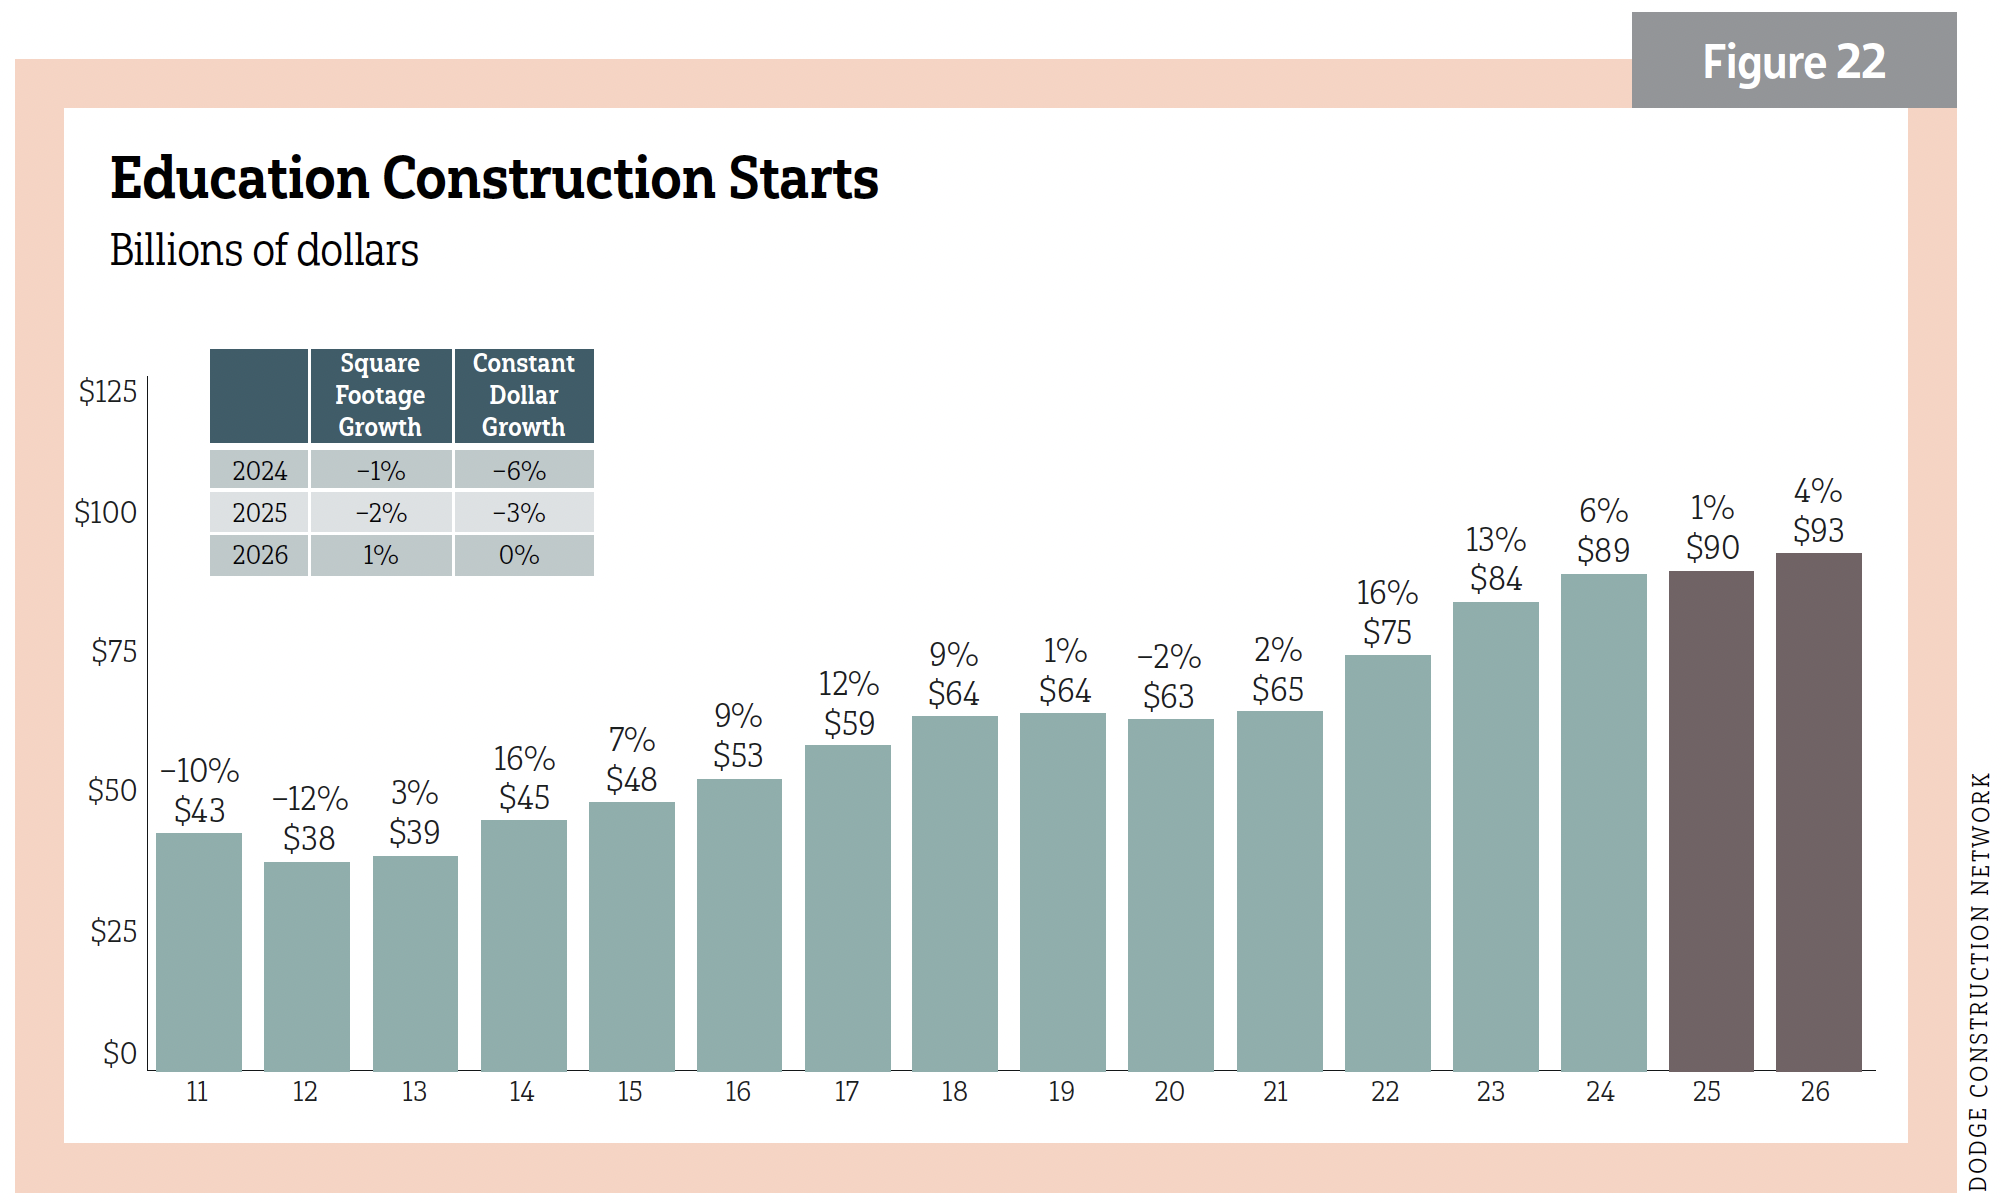
Education
- 2025: (Dodge) 1%/$90 billion; (ConstructConnect) –4.7%/$101.67 billion
- 2026: (Dodge) 4%/$93 billion; (ConstructConnect) –9.6%/$92.73 billion
See Figure 22.
College and universities
- 2025: (ConstructConnect) –16%/$27.1 billion
- 2026: (ConstructConnect) –14.5%$23.7 billion
Note: Dodge did not provide a segment-specific forecast.
K–12
- 2025: (ConstructConnect) 0.9%/$71.82 billion
- 2026: (ConstructConnect) –8.92%/$66.32 billion
Note: Dodge did not provide a segment-specific forecast.
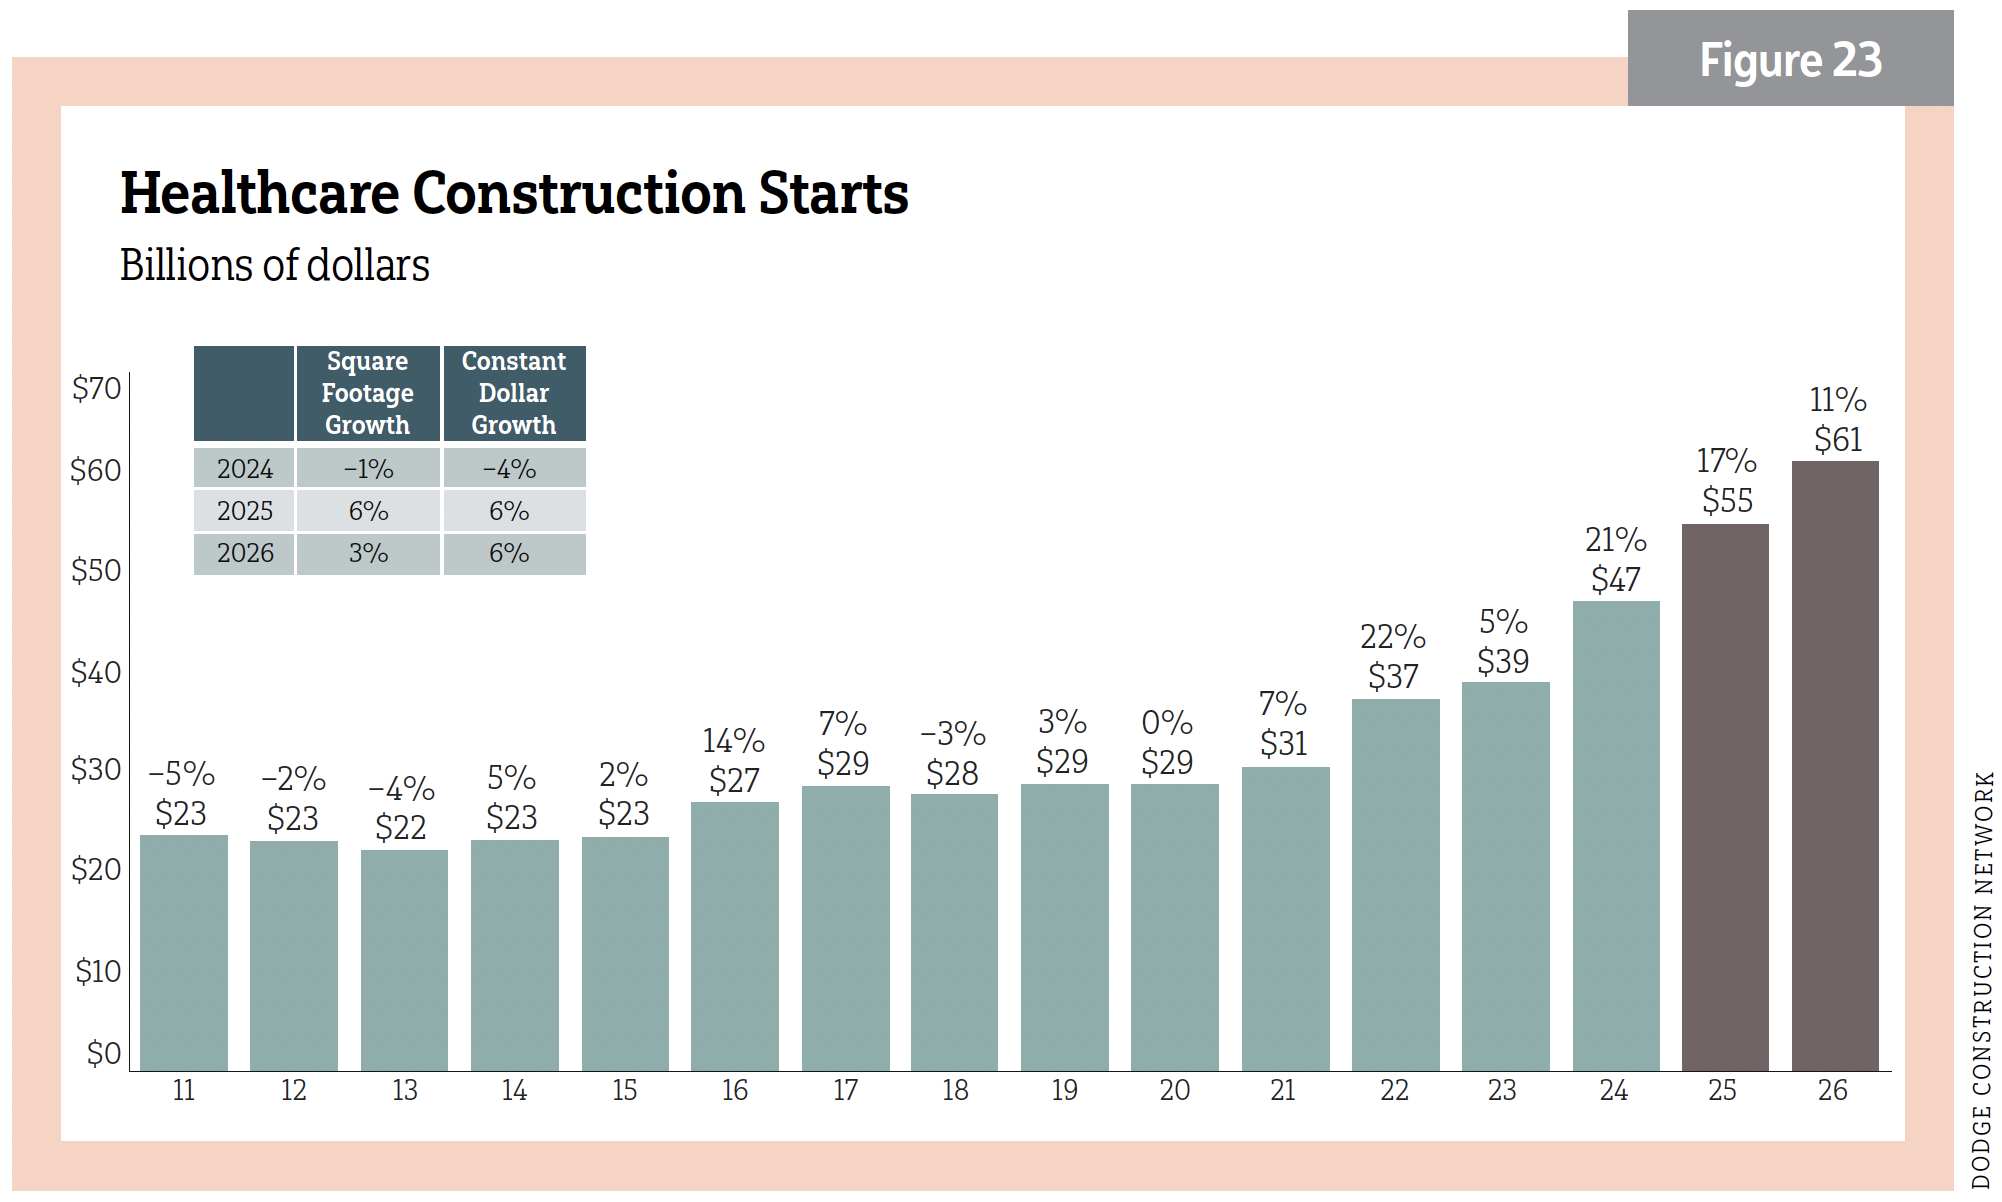
Healthcare
- 2025: (Dodge) 17%/$55 billion; (ConstructConnect) –27.1%/$28.64 billion
- 2026: (Dodge) 11%/$61 billion; (ConstructConnect) 11.1%/$31.84 billion
See Figure 23.
Transportation
- 2025: (ConstructConnect) 86.6%/$14 billion
- 2026: (ConstructConnect) –11%/$12.6 billion
Recreation
- 2025: (ConstructConnect) 5.7%/$14.9 billion
- 2026: (ConstructConnect) –2.7%/$14.5 billion
Note: “Recreation” refers to sports arenas and convention centers.
Miscellaneous institutional
- 2025: (ConstructConnect) –11.6%$39.7 billion
- 2026: (ConstructConnect) –5.25%/$37.72 billion
Note: “Miscellaneous” encompasses religious buildings and public buildings, including capitols, courthouses, police and fire buildings, detention and other government buildings.
The top institutional project as of September 2025 was the Geisinger Medical Center Danville Expansion in Danville, Pa. ($880 million).
MANUFACTURING
- 2025: (Dodge) 4%/$55 billion; (ConstructConnect) 67.3%/$97.67 billion
- 2026: (Dodge) –24%/$42 billion; (ConstructConnect) –20.4%/$77.79 billion
Manufacturing buoyed its fortunes with megaprojects in 2025. By September 2025, its y/y growth was a whopping $253%, with lesser but impressive growth of 73.6% y/y in October. Much of this, as reported by ConstructConnect, was due to the completion of the third fabrication facility at the TSMC campus in Arizona—“the largest megaproject ever”—and other advanced manufacturing. Transportation terminals also exhibited strong growth y/y. Declines were in laboratories: –58.3% y/y. See Figure 24.
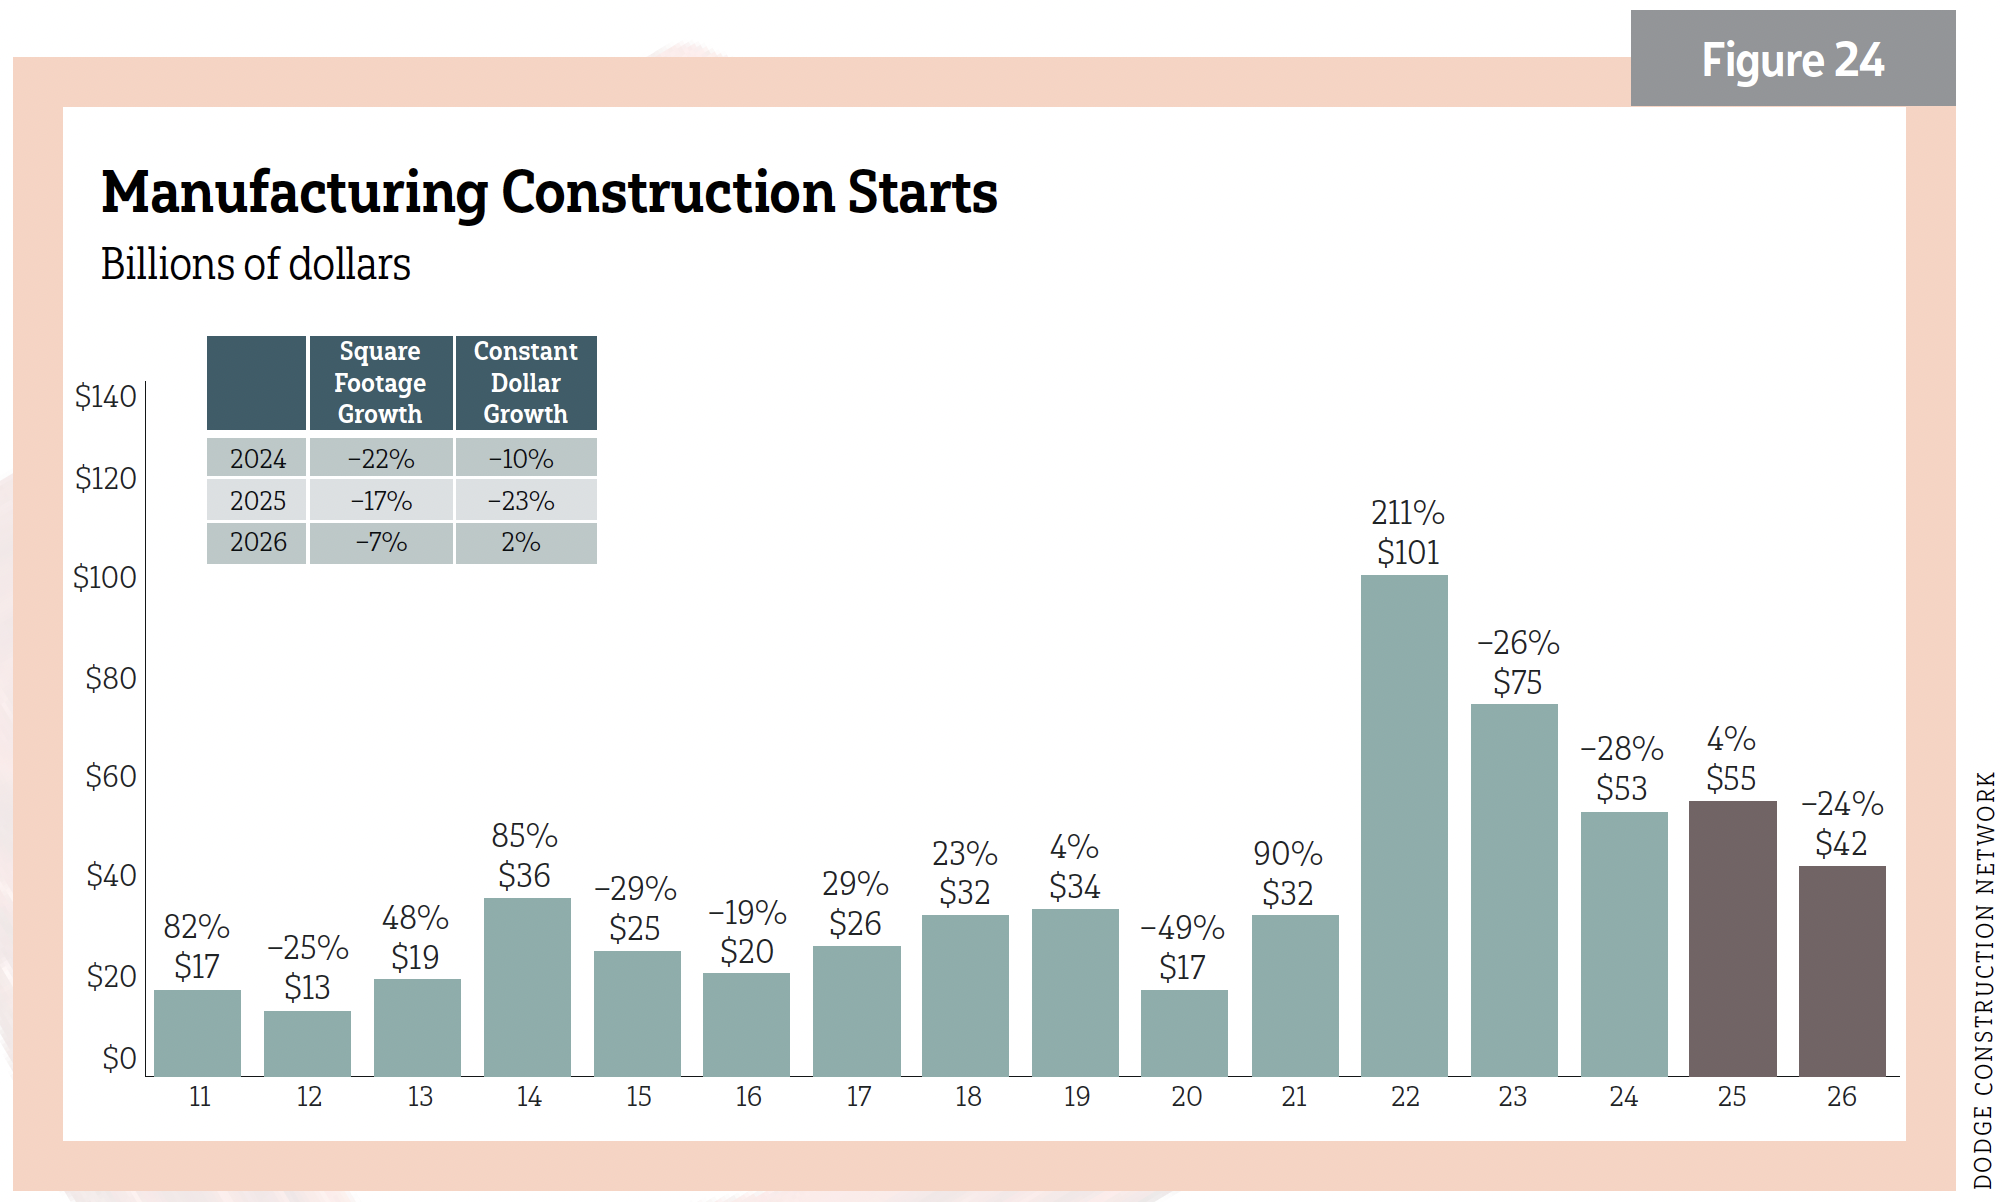
Noted manufacturing starts in October 2025 were the Amkor Technology Semiconductor Packaging Facility in Peoria, Ariz. ($7 billion/500,000 sf) and the Amgen Biomanufacturing Facility Expansion in New Albany, Ohio ($900 million/418,000 sf).
NONBUILDING
Maintained growth, but less ahead
- 2025: (Dodge) 6%/$346 billion; (ConstructConnect) 3%/$284.3 billion
- 2026: (Dodge) 4%/$361 billion; (ConstructConnect) 3.4%/$293.95 billion
Civil spending in the construction industry in 2025 outpaced previous years. ConstructConnect reported that as of November 2025, civil work expanded in six of nine American regions, with the west-central Plains and New England leading. Roads and bridges, dams, water supply and sewer/waste disposal systems seem safe from any funding clawback. Dodge sees added growth in 2026, except for dams and reservoir work. ConstructConnect expects some growth. Last year was a good year for new airport runways and taxiways (14.7%).
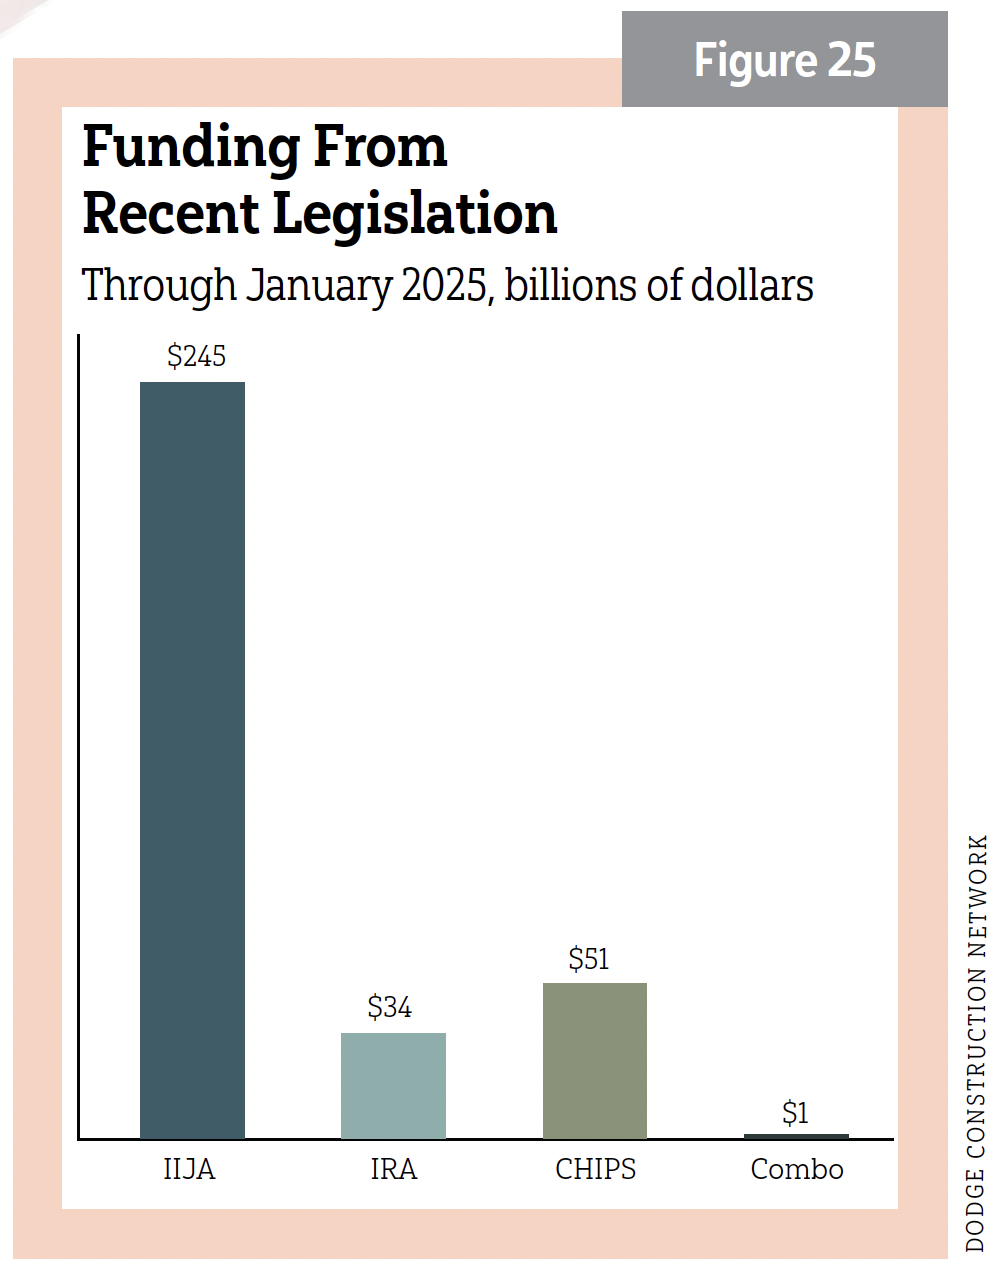
Many of the recently passed infrastructure bills—The IIJA, the IRA and the CHIPs act—have led to huge expenditures and outlays that have bolstered the nonbuilding sector. It's unclear if cuts to these programs will affect future spending. See Figure 25.
Renewable energy projects had a year, as well. The U.S. energy storage market set a quarterly growth record in Q2 2025 with 5.6 gigawatts (GW) of installations, according to the latest U.S. Energy Storage Monitor. The Solar Energy Industries Association reported solar installations added nearly 18 GW of new capacity in the first half of 2025. Solar and storage accounted for 82% of all new power added to the grid in its first six months. Meanwhile, the U.S. Energy Information Association found U.S. exports of liquefied natural gas (LNG) represent the largest source of natural gas demand growth, estimating LNG gross exports to have increased by 19% to 14.2 billion cubic feet per day (Bcf/d) in 2025 and by 15% to 16.4 Bcf/d in 2026.
Bridges and streets/highways
- 2025: (Dodge) 7%/$275 billion
- 2026: (Dodge) 3%/$283 billion
Note: Dodge combines numbers for streets/highways and bridges and environmental public works as "public works."
- 2025, Bridges: (ConstructConnect) 7.8%/$32.91 billion
- 2026, Bridges: (ConstructConnect) 10.5%/$36.39 billion
- 2025, Streets and highways: (ConstructConnect) 7.7%/$109.3 billion
- 2026, Streets and highways: (ConstructConnect) 4.1%/$113.9 billion
Dodge did not provide specific dollar values for these subsectors. It did expect an 11%/$33 billion gain in its early 2025 estimates for bridges and a 14%/$116 billion gain for streets and highways. It expects the total value of street and bridge construction to improve by 10% in 2025 and by another 3% in 2026.
Environmental public works
- 2025, Dams and Reservoirs: (ConstructConnect) 2.9%/$13.08 billion
- 2026, Dams and Reservoirs: (ConstructConnect) –17.2%/$11.16 billion
- 2025, Water and sewage treatment: (ConstructConnect) 3%/$61.37 billion*
- 2026, Water and sewage treatment: (ConstructConnect) –1.1%/$60.26 billion*
*ConstructConnect combines water and sewage treatment.
Power and utilities
- 2025: (Dodge) 1%/$72 billion; (ConstructConnect) –13%/$48.63 billion
- 2026: (Dodge) 9%/$78 billion; (ConstructConnect) 17.2%/$57 billion
Notable nonbuilding projects in October 2025 included the Sempra Infrastructure Liquefied Natural Gas, Phase 2, Trains 3 & 4 in Port Arthur, Texas ($1.4 billion); Energy Transfer Hugh Brinson Pipeline in Dallas ($2.7 billion); and Nashville International Airport Concourse A Reconstruction Project in Nashville, Tenn. ($855 million).
Conclusion
Ending last year’s 2025 construction forecast, we wrote, “Expect a few bumps in 2025 but growth, as well.” This year will be similar, and a return to stronger growth is expected in 2027. Remember, the carnival of uncertainty will eventually pack up and leave—but opportunity never does. Growth is a strategy. Turn change into your advantage. In this shifting landscape, clarity and confidence are your greatest tools.
This forecast is derived from information shared by ConstructConnect, Cincinnati, Ohio, in “The Construction Economy Outlook: 2025 Fall Webcast”; Dodge Construction Network, Boston, in its “Outlook 2026: Forecast Overruns: Navigating Structural Change” webinar and “Dodge Outlook 2026” ebook; and updates as available from both firms and other sources.
STOCK.ADOBE.COM/АНЖЕЛИКА МЕЛЬНИЧУК, GETTY IMAGES/KMATTA, GINGER WILSON | dodge construction network |constructconnect | bureau of labor statistics | associated general constractors of america | AIA | Wall Street Journal quarterly economic forecasting survey
About The Author

GAVIN, Gavo Communications, is a LEED Green Associate providing marketing services for the energy, construction and urban planning industries. He can be reached at [email protected].