In Part 1 of the 2026 Profile of the Electrical Contractor, we noted a decline in revenues and firm sizes since our 2024 findings. Average earnings decreased and more companies now fall into the 1-9 employee size category. In Part 2, we cover how electrical contractors do their work, with information on team structures and product specification. Read on to learn more.
Bidding details
In our biennial surveys, we ask about work your firms have done over the previous year, including experience with different bidding formats. This year, 77% of you reported having some experience with time and materials bidding during 2025, virtually unchanged from what was reported for 2023. Other options included maintenance, service and repair (MSR), traditional bid-build, design-build (D-B) or design-assist (D-A), collaborative basis, construction management (added this year) and the catchall “other basis” option (see Figure 1).
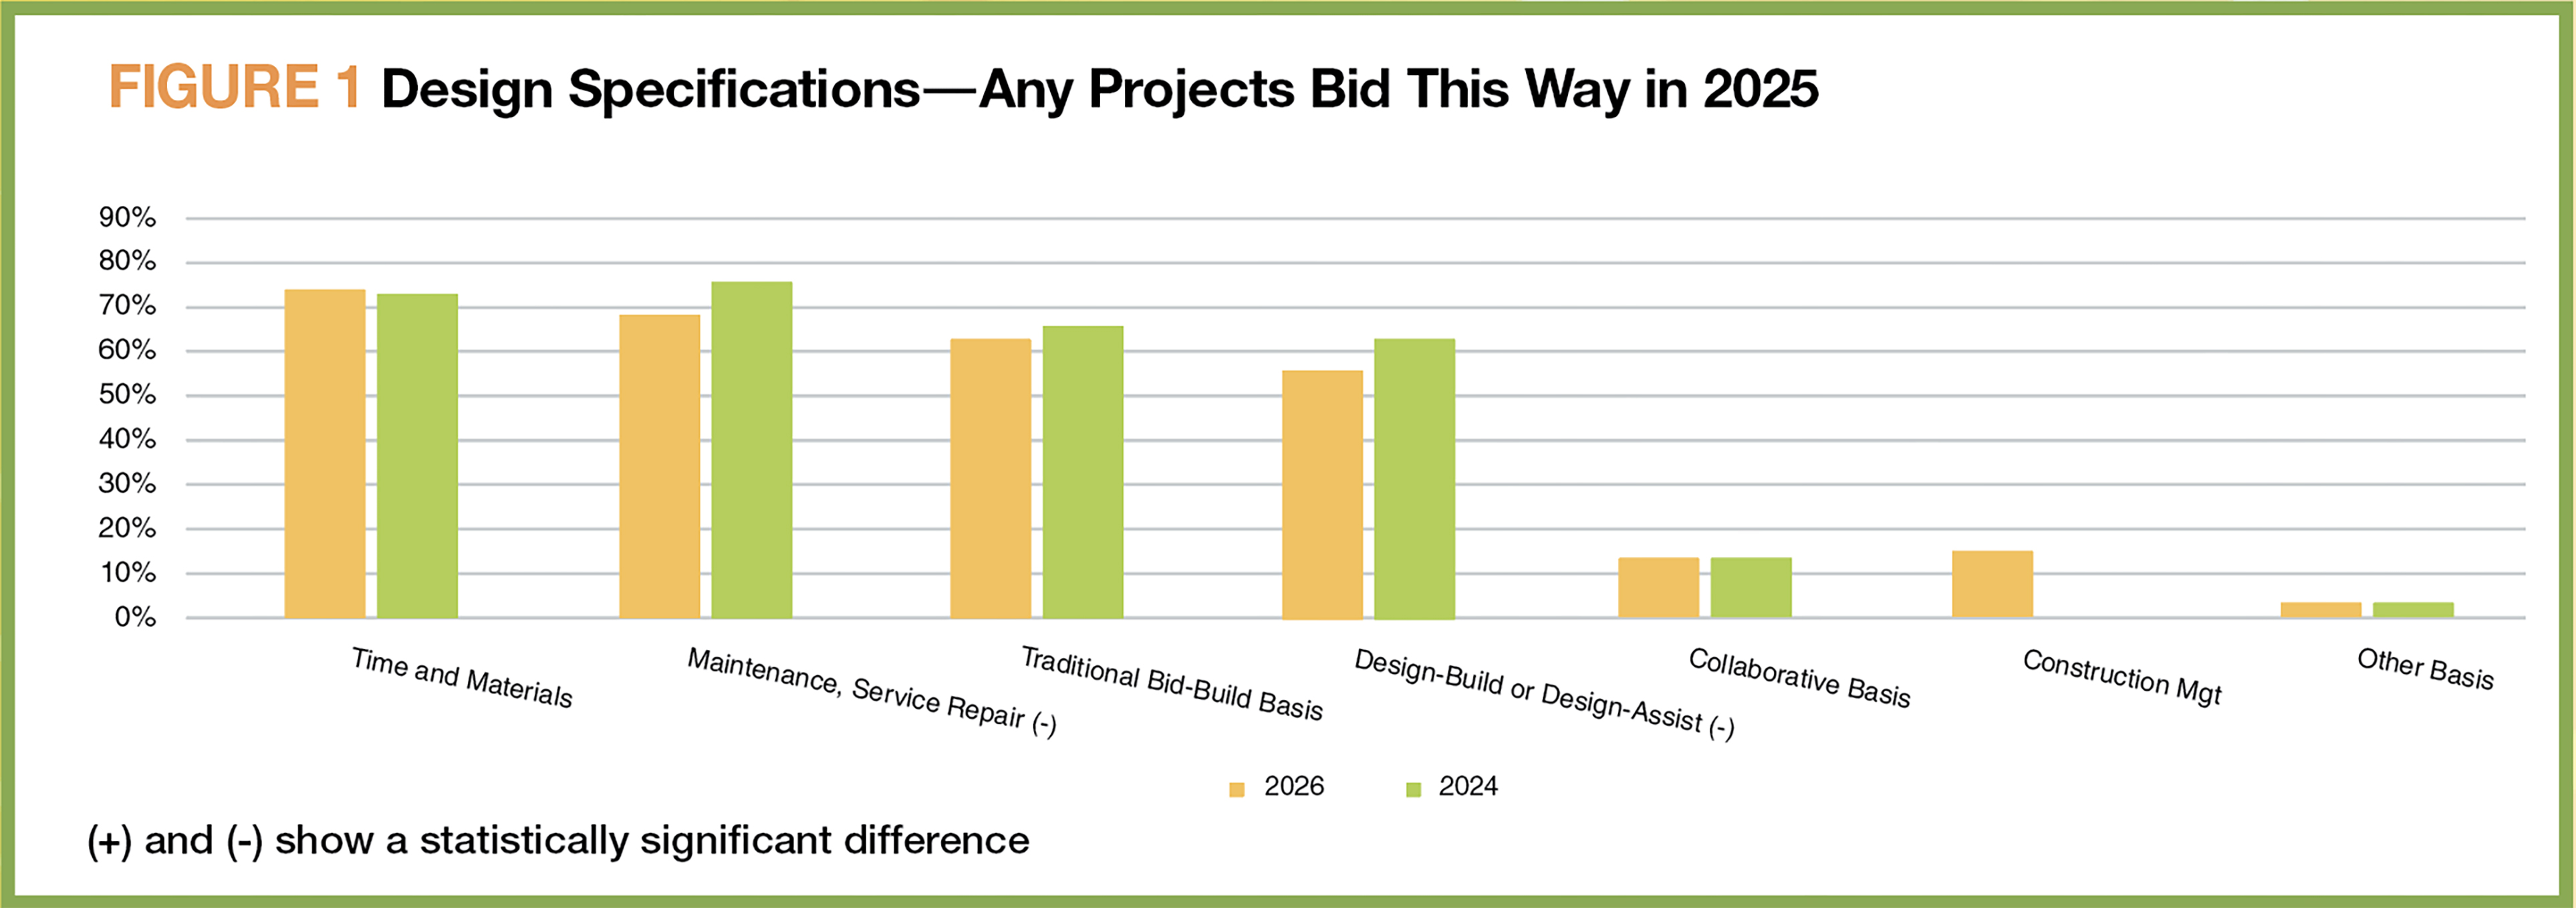
Figure 1
Though MSR remained in second place, it fell back a bit from our previous survey, from 75% to 71%, as did D-B/D-A (62% to 57%). The new construction management category debuted at 15% on an “any” basis. The remaining formats held consistent with what was reported for 2023. Traditional bid-build slipped a bit, from 65% to 62%, but this isn’t a statistically significant move and represents a reset to levels reported in our 2022 Profile.
These figures represent the variety of bidding types that electrical contractors work with. Figure 2 presents their relative importance to their business. As noted in previous years, this importance varies by firm size. So, for example, time and materials bids were used in 38.8% of projects for the smallest firms, but only in 12.1% of projects for those with 100-plus employees.
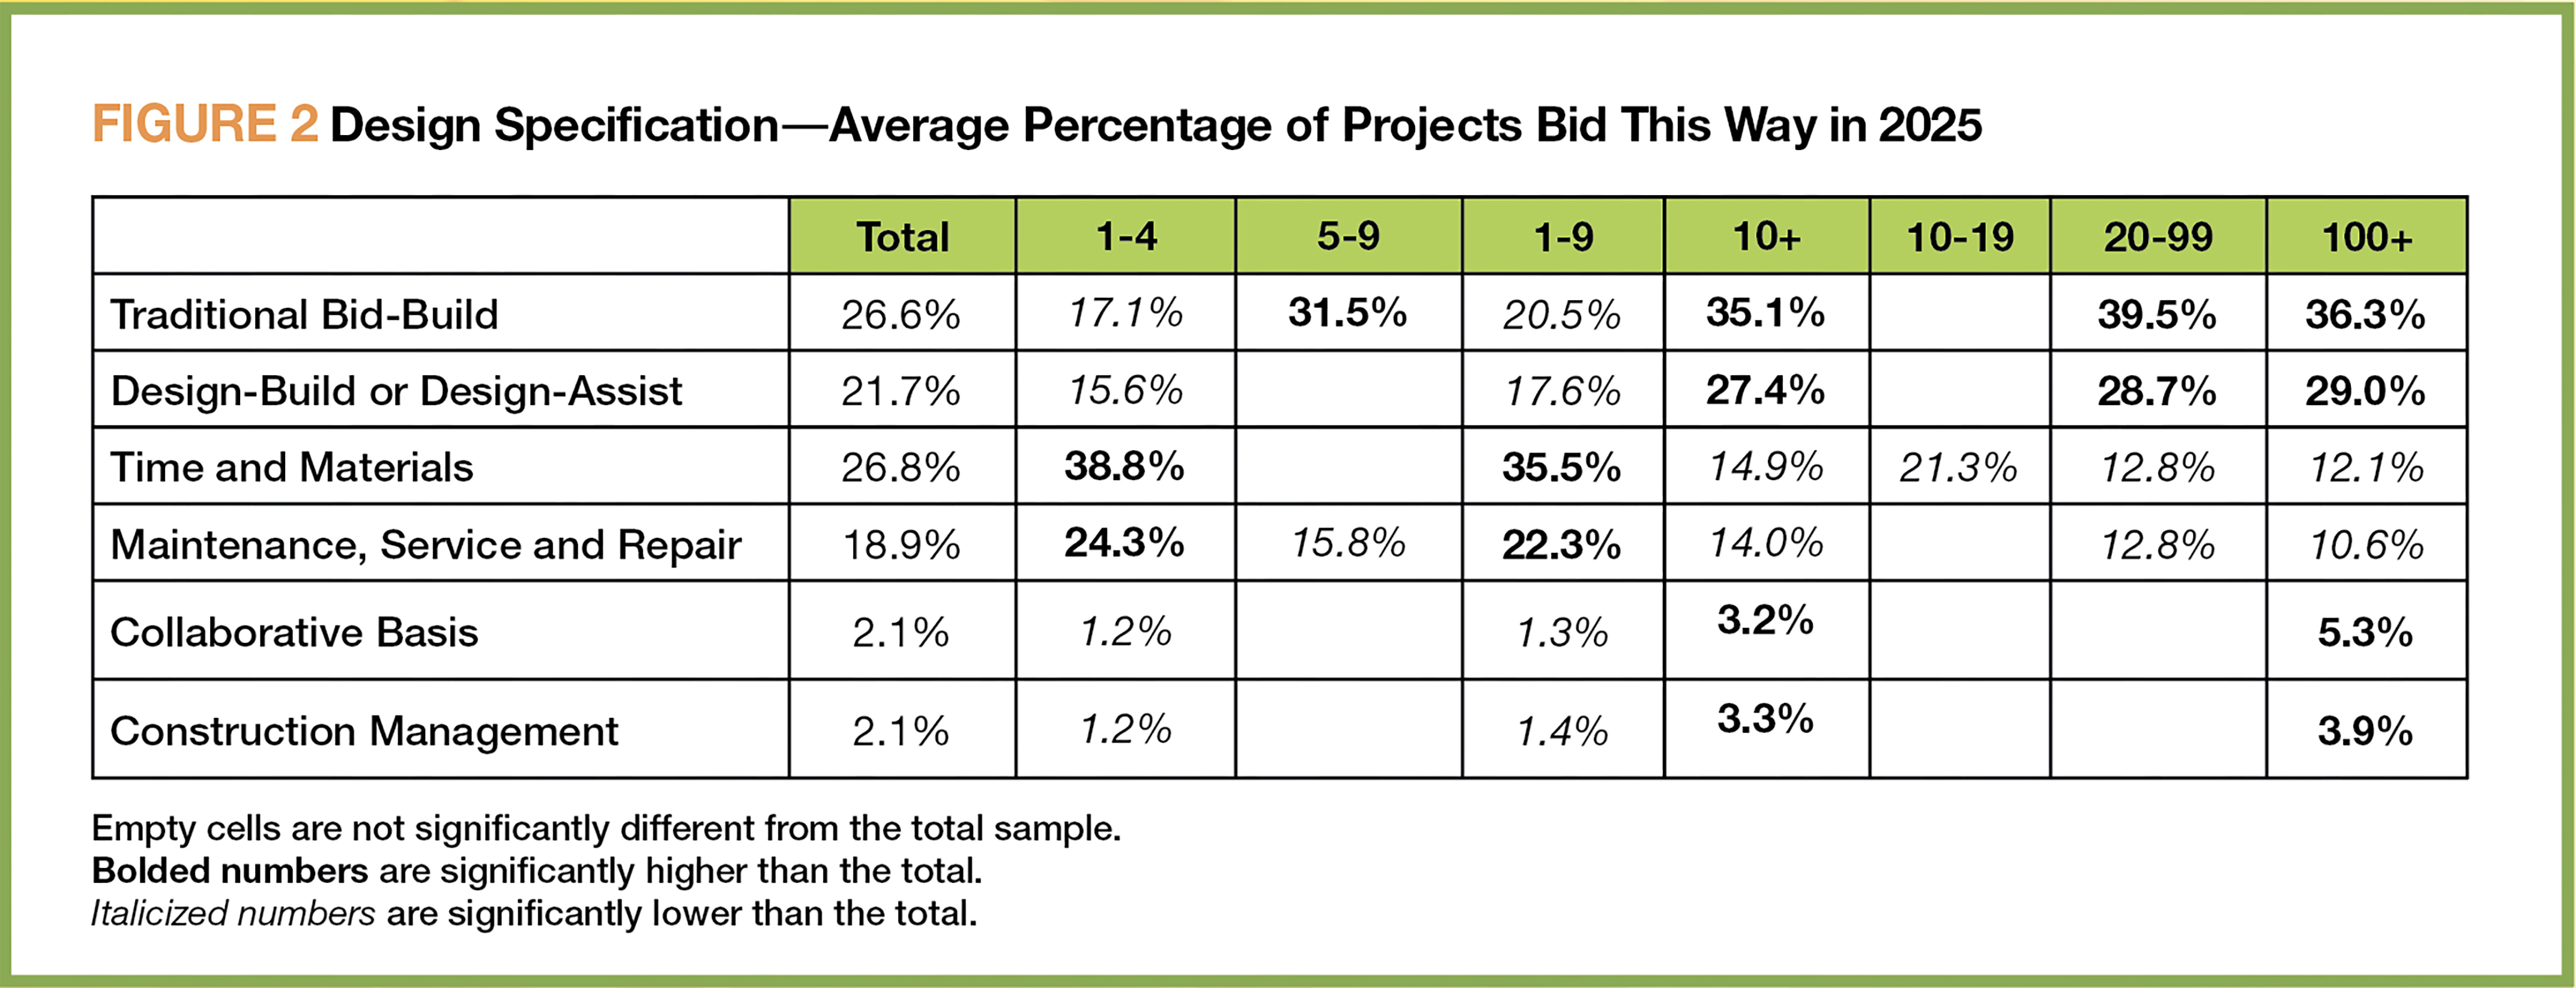
Figure 2
There was also a difference—from 24.3% to 10.6%—in MSR’s importance to small versus large companies. Traditional bid-build and D-B/D-A methods, on the other hand, are much more important to the largest companies than to those with 1–4 employees. Collaborative basis and construction management methods are also more than twice as important for large firms than small ones, though at a significantly lower level, topping out at 5.3% and 3.9%, respectively, for companies with 100-plus employees.
Although not shown in the figure, the relative revenue importance of D-B and D-A also differs by firm size. D-B/D-A averages 16.2% of revenues across all companies, compared to 5.6% for D-A. However, in the smallest firms, these figures are to 13.1% for D-B and 2.6% for D-A, and they climb to 18.2% for D-B and 10.9% for D-A in companies with more than 100 employees.
We’ve been asking about the use of building information modeling (BIM) since 2012, and it’s been on the rise since our 2020 report—until now, at least. Across the whole sample of this year’s survey, 31.1% of respondents reported using BIM (down from 35.8% in 2024), with average use coming in at 10% (down from 12% two years ago). This situation changes for the largest firms, though. In these companies, 80% of respondents noted using BIM, with the average hitting more than 30%. These figures are both statistically unchanged from 2024’s responses (not shown).
Where you’re buying
Where you make your purchases this year showed a significant shift back from a change we noted in our 2024 Profile. In that survey, as shown in Figure 3, respondents had signaled a move away from electrical distributors: the average percentage of purchases made at those locations was 48%, a drop from 65% in 2022. This year, though, that figure moved back to 63%. And the rise in this year’s responses were consistent among firms with 1–9 employees and those with more than 10. Retailers (including big box and local hardware stores) also saw more business, increasing to 15% from 10% of purchases, largely thanks to the buying patterns of smaller firms.
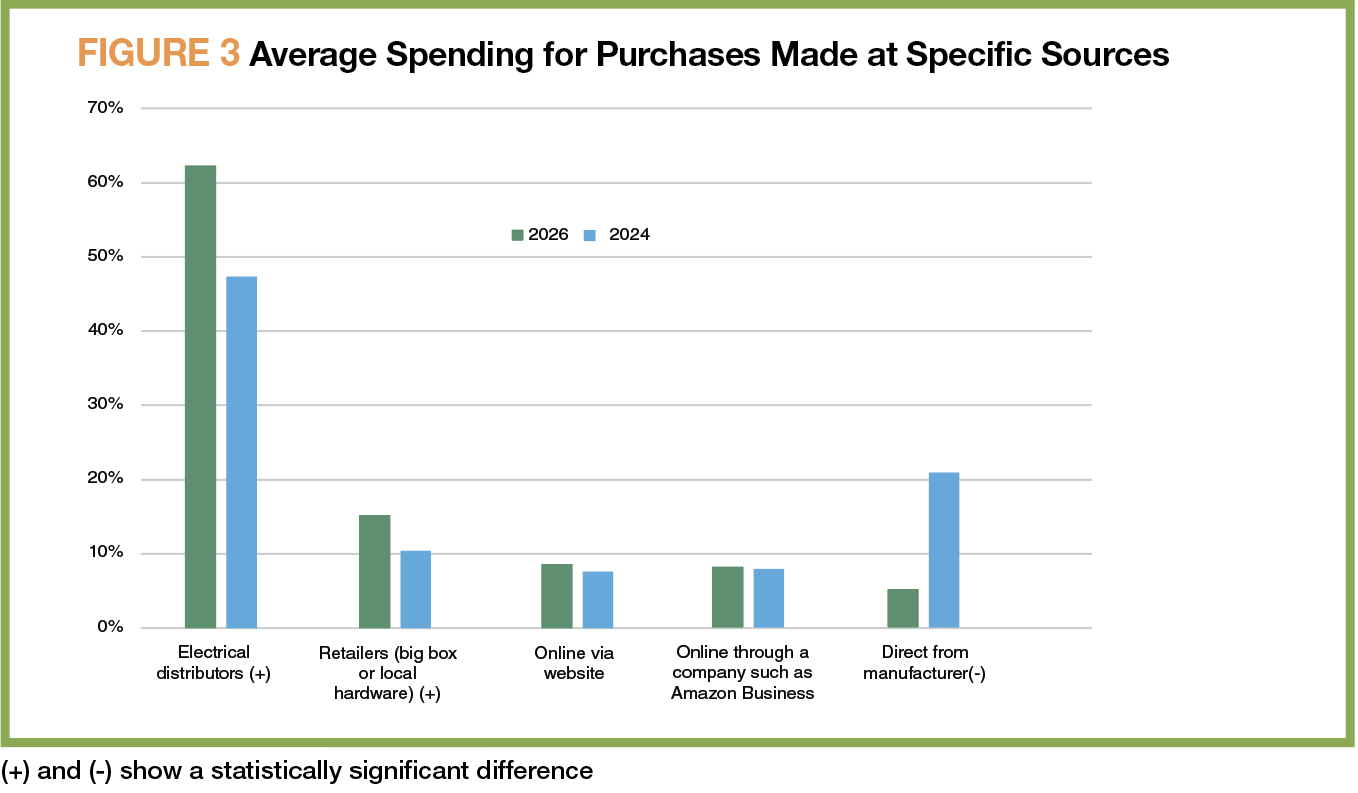
Figure 3
Direct-from-manufacturer sales took a hit compared to 2024’s results, falling to 5% from 21%. This is a return to historical levels, however, which could be an indication that supply chain issues common during and after the pandemic have righted themselves.
Engineering solutions
Since 2016, we’ve been asking participants about whether their firms worked with engineers. We’ve asked whether their firm has a staff engineer, a dedicated engineering division or a consulting relationship. We ask questions about each of these separately, in case firms use internal and external engineering services.
As Figure 4 shows, results remained steady in this year’s responses, with 59% reporting having a professional relationship with an engineer. Similarly, consulting relationships predominated, at a statistically unchanged 52% across the sample. The 22% that reported having either an engineer on staff or a separate division also is consistent with 2024’s findings, as is the 15% response from those working with internal and consulting engineers.
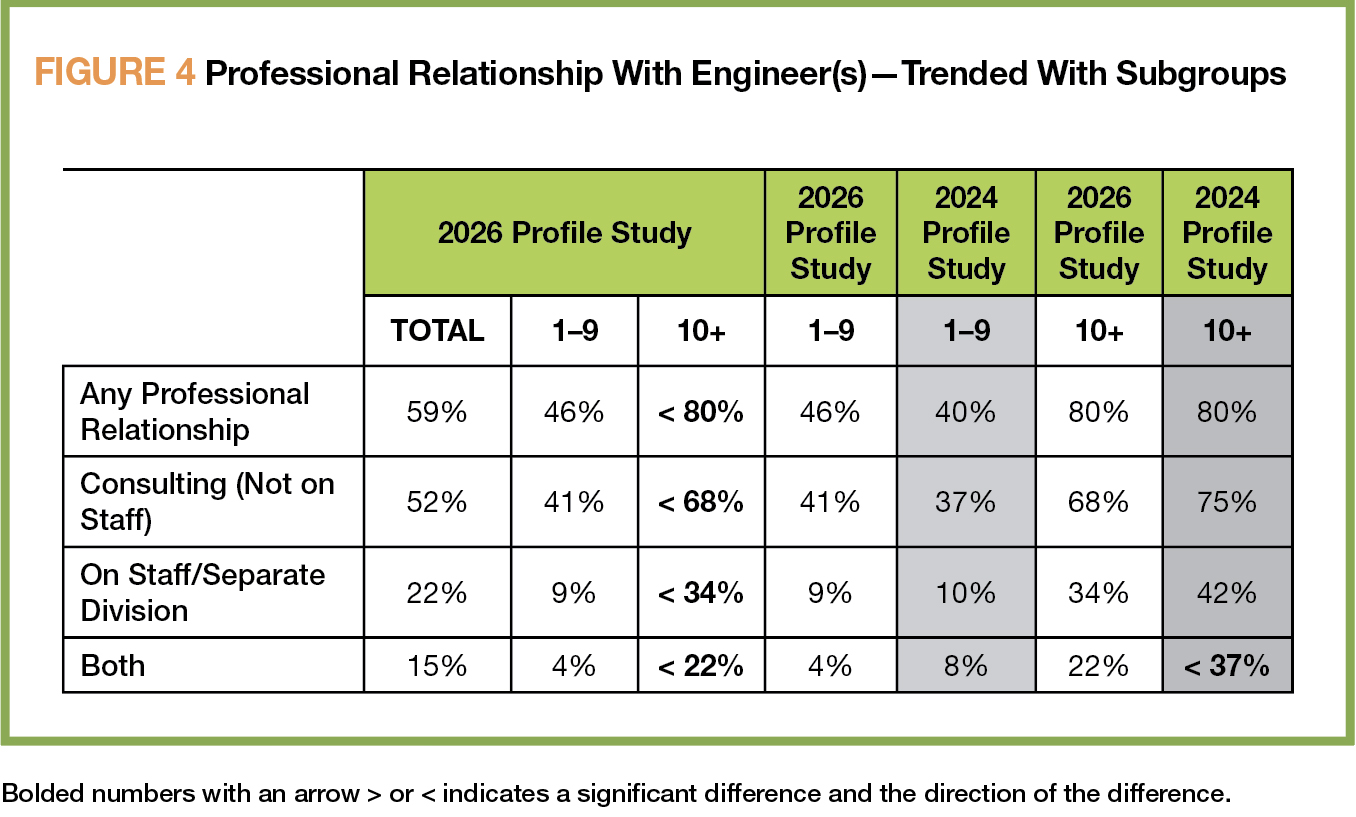
Figure 4
Unsurprisingly, larger firms—those with 10-plus employees—are more likely to work with engineers than smaller companies. Though not shown in the figure, 90% of companies with 100-plus employees reported working with engineers. Also not shown, even the smallest firms still call on engineering services, with 40% of companies with only 1–4 employees reporting such professional relationships.
Influencers
Electrical contractors aren’t just installers, as our survey results confirm; they’re also valued consultants. This is clear in the results illustrated in Figure 5, with 79% of respondents reporting they have a high or medium ability to influence overall electrical designs or specifications with building owners or other design team members.
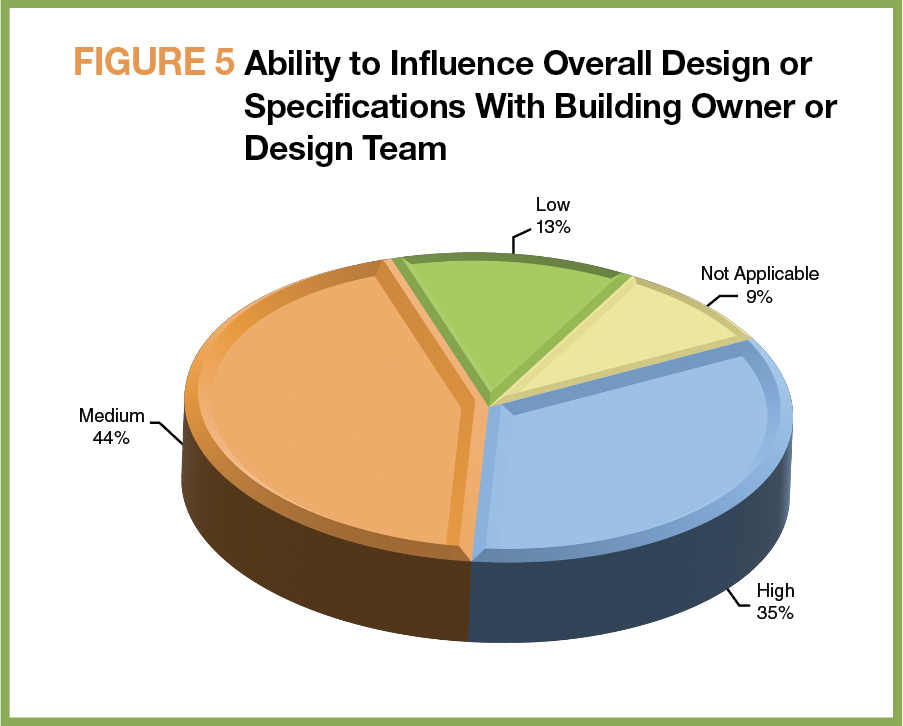
Figure 5
These overall figures include 35% who describe their influence level as high (statistically unchanged from 42% in 2024) and 44% who describe it as medium (also statistically unchanged from 35% in 2024). Interestingly, those from firms with 1–9 employees report having more influence than their larger-firm counterparts, at 44% versus 25%. Echoing that, those from larger firms are more likely to rate their influence as low, compared to smaller firms, at 19% versus 8%.
Having some influence on project design could be an important advantage for electrical contractors, given the high percentage reporting experience with incomplete and incorrect specifications and plans. We first noted a jump in frequency of less-accurate documentation in our 2022 survey, with the observation that it could have been pandemic-related disruptions. But problems have remained steady even four years later, with responses remaining statistically unchanged in 2024 and 2026.
As with other questions, we asked respondents to consider their work in the previous year. Across the entire sample:
78% reported receiving incomplete plans or specifications.
83% reported receiving incorrect plans or specifications.
These figures can shift by project type, as shown in Figure 6, which uses the example of incomplete documentation. In this year’s responses, commercial projects had the highest percentage of any incomplete projects, at 52.7%, while single-family and multifamily residential jobs came in at 36.5% and 33.3%, respectively. Industrial (48.1%) and institutional projects (45.3%) fell between these two extremes.
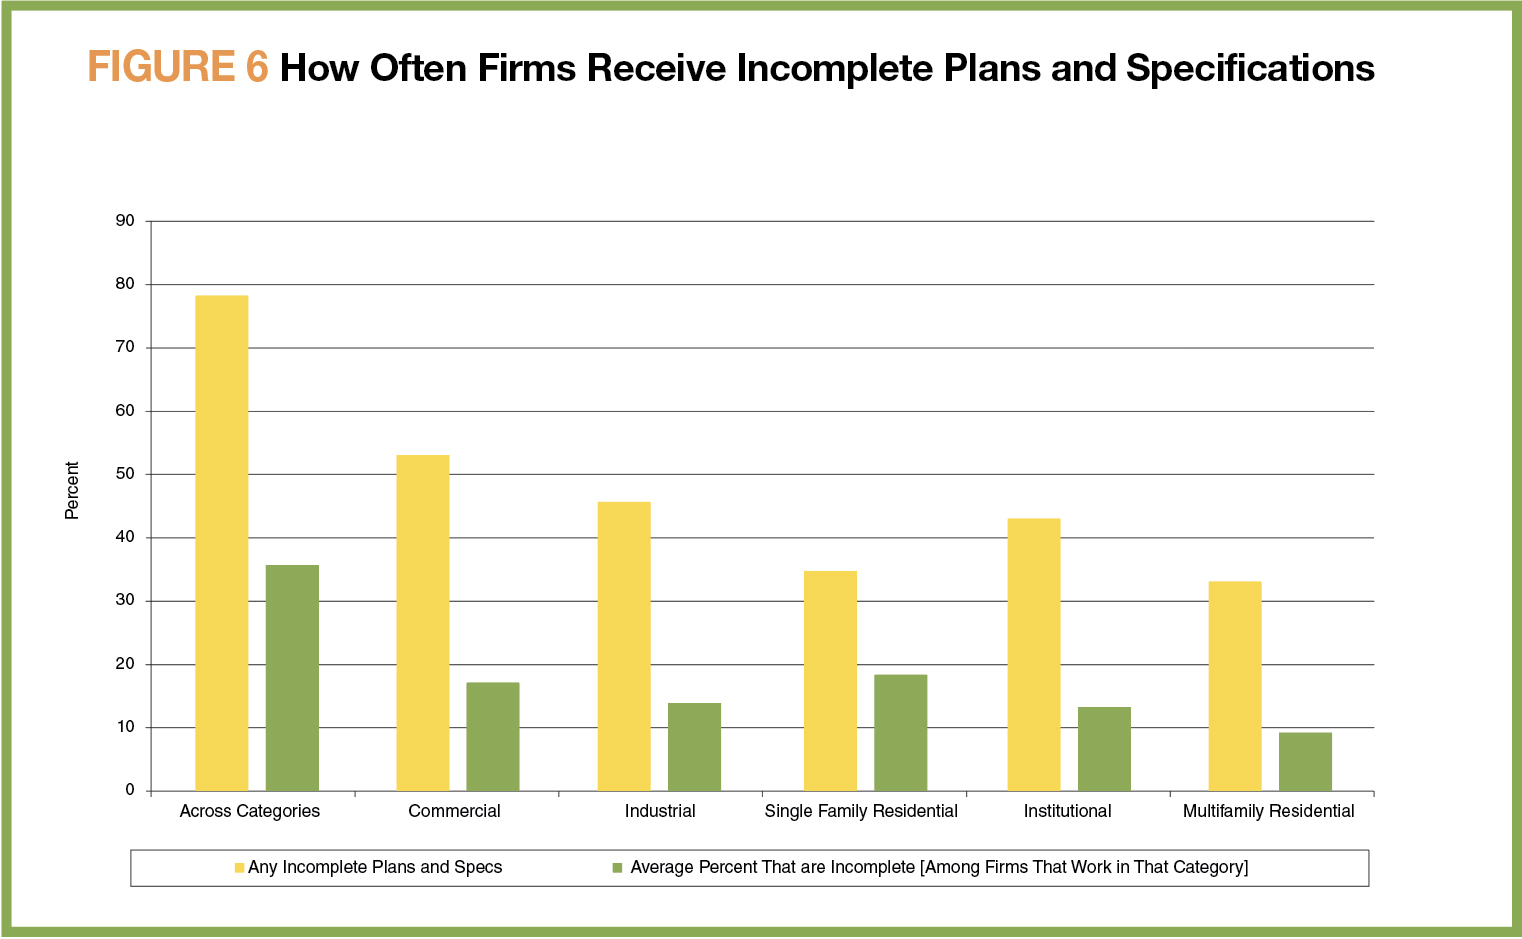
Figure 6
There were some project-type shifts in the percentage of incomplete plans and specifications from 2024’s survey in this year’s results. For example, commercial and industrial projects tied at about 54% in 2024. Single-family and multifamily residential pegged higher percentages of incomplete documentation, at 44% and 49%, respectively.
Specifications fall into one of four categories: single/proprietary brand; multiple brands; “or equal to” (proposing alternative products if they match the standards); and performance-specified. As in previous surveys, we asked respondents to tell us the frequency of each type they generally receive. Across the whole sample, single/proprietary brand and multiple brands each were specified 34% of the time, while “or equal to” accounted for 20% of specifications and performance-specified hit 12%.
Only the “or equal to” category registered a statistically significant shift from our 2024 survey, when it came in at 28% (not shown). And only one statistically significant difference showed up when we looked at this year’s results by company size: single/proprietary brand specifications are more the rule with firms having 1–9 employees (39%) than for those with 10-plus (28%).
But not all jobs come with product specifications—electrical contractors continue to have discretion in making brand decisions. Overall, our respondents said they were able to make these choices 67% of the time. This figure shifted by firm size, though, rising to 73% for companies with 1–9 employees and falling to 60% for those with 10-plus workers. These figures are consistent with 2024.
So, how do electrical contractors make those decisions? Figure 7 provides some answers. We supplied respondents with a list of options and asked which were the three most important factors in their decision-making. In initial selection scenarios, availability and price remained the top two factors most likely to show up on these lists. Compatibility with existing systems came in at a solid third place. This ranking has held steady for the last several surveys.
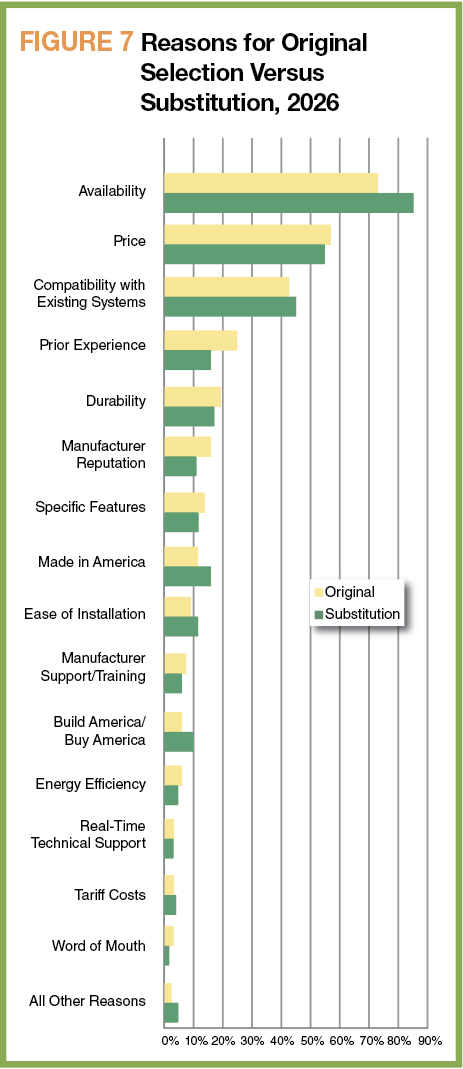
Figure 7
In 2026, the top three reasons for brand substitution mirror those for original brand selection; specifically, availability and price are also the most important factors in decisions when swapping out products. Not surprisingly, availability emerges as even more important in the brand substitution process. Compatibility with existing systems was in the list for 44% of respondents, consistent with 2024.
There were no significantly different changes among small companies (1-9 employees) compared with two years ago (not shown).
Price dropped significantly among large firms with more than 10 employees. In addition, manufacturer reputation and manufacturer support and training rose significantly among firms with 10-plus employees (not shown).
What comes next
Our biennial surveys offer snapshots of how ECs view their businesses at certain points in time. We'll continue covering issues that have the electrical construction industry at a crossroads, including tariffs, fuel costs, the economy and more. Stay tuned to these pages for information on what's happening in the industry.
stock.adobe.com/Asta Desain, BrightSprout
About The Author

ROSS has covered building and energy technologies and electric-utility business issues for more than 25 years. Contact him at [email protected].