As long as ohm’s and Kirchhoff’s laws remain in effect, we’ll have voltage sags. As a quick review, voltage is equal to the current times the impedance, and the sum of the voltages around a closed-loop circuit equals zero, as does the sum of the currents into a node or junction point.
Except in the early pages of ELE 101 textbooks where there are ideal voltage sources that provide all of the output voltage to the loads, the electrical generator (referred to as the source) provides a voltage with amplitude and frequency that are affected by the current demand of the loads. The output impedance of rotational generators is primarily made up of an inductive and resistive component. That changes when the generators are inverters fed by photovoltaic panels or wind turbines. These have a different output impedance and potential harmonic frequencies in the voltage output. The lower the output impedance of the source, the less its voltage is affected by the current. A stiffer source with power inertia is obviously preferred.
Since the generator is not typically located at the load, the wires connecting them have resistive, capacitive and inductive components in the impedance. In most power quality analyses, we consider the generator output impedance to be negligible compared to the impedance of the wiring. As far as the load is concerned, those get summed up as source impedance, which should be at least 100 times less than the load impedance.
In a simple example with the source impedance being 1 ohm and load impedance being 100 ohms, the 100V generated results in approximately 1A of current flowing through the source impedance and load. This leaves 99V for the load. However, when a large motor starts up and the load impedance drops to 8 ohms, 11A flows and the 11V is dropped across the source impedance, leaving 89V at the load. Since a voltage sag limit is typically 90% of nominal, this would be classified as a sag.
There are many potential causes of increased current levels on the distribution system that aren’t caused by the loads, such as vegetation contact, wind moving conductors together and downed lines due to motor vehicle accidents. These can increase the current in the feeders significantly, resulting in sags. The duration of the sag is often a factor of the protection scheme of the substation breakers. A typical operating time is 5-10 cycles, which are two of the larger bars on the graph in Figure 1. The 0.5-second to 5-second bars are typical of sags caused by large load changes, such as the aforementioned large-horsepower motor starting.
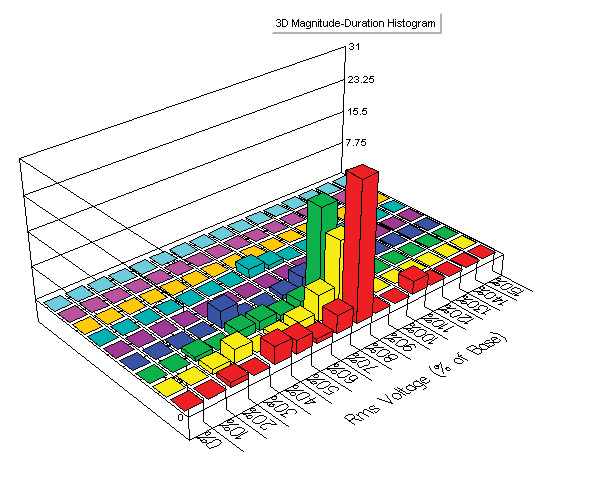
Figure 1: Magnitude and duration of
voltage sags in a 3D graph
Based on where the measuring point is within a facility or on the grid, the magnitude of the same event would be different. Further down, a faulted feeder would have less remaining or residual voltage than on a parallel feeder from the same substation. Similar results would occur within a facility, though not as extreme. Note that there are no bars in the 90–100 area, which is actually 90%–109.9%, as these are typically within the normal range, not considered as a voltage sag or swell. The swell is represented by the bar at 110%.
This doesn’t mean that rms voltage variations don’t occur in the 90%–109.9% range. They are far more numerous than the ones shown on the graph. But since they are not considered to be outside the limits that the recording instruments are set to trigger on, none were recorded. Again, this doesn’t mean that some equipment will not be affected by these variations. There are voltage contacts that trip off at 93% of nominal. When that equipment is in the system, the limits on the instruments should be adjusted accordingly.
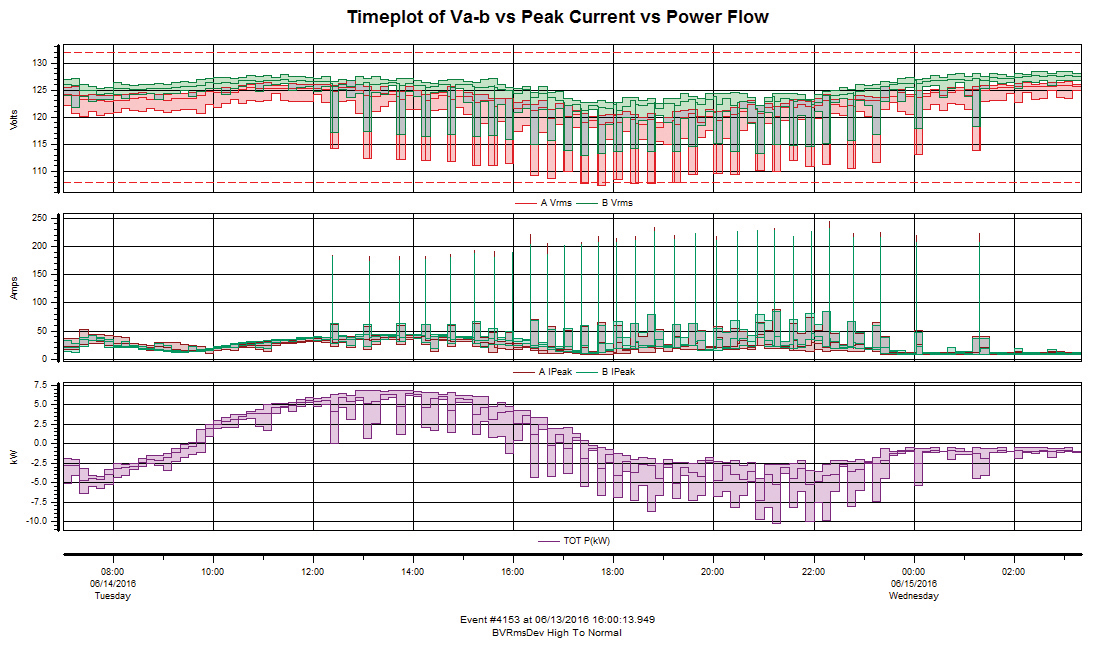
Figure 2: Vrms variations caused on HVAC in a
residence with solar panels on the roof
Figure 2 shows another factor in the PQ world that has complicated analysis. The mathematical calculations for determining what the effect of having rooftop solar panels on a residence are in minimizing the rms voltage variations caused by the start up of a 5-ton HVAC unit are beyond my pay grade. One would think that having a voltage source within 50 feet of the source of the voltage reductions that even cross the voltage sag limit would lessen the effect considerably. This wasn’t the case. The current peak value of the current during the energization of the compressor was marginally reduced, which, according to Ohm and Kirchhoff, would say that the voltage drop should be proportionally less (with all other factors remaining constant). But it clearly didn’t mitigate the problem, for reasons unknown at this point.
Bottom line: voltage sags are still the reigning champs, and that reign looks like it will continue for some time, even in the proposed DC voltage grid.
richard p. bingham
About The Author

BINGHAM, a contributing editor for power quality, can be reached at 908.499.5321.