
In my previous article about OTDRs, I covered the basics of how the instrument works and how it is used to make basic measurements of attenuation, splice or connector loss and reflectance. If you need to, go back and review that article because now I'm going to get into some more details.
In my first article, I showed how OTDRs can measure fiber attenuation, splice or connector loss and connector reflectance. I used schematic diagrams to show how these measurements are made between the two markers on the OTDR display. But real-world OTDR traces sometimes are not so neat looking.
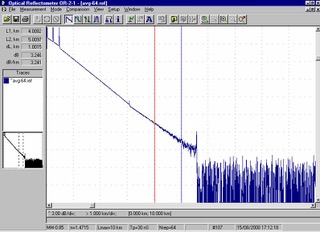
Here is an actual OTDR trace with a noisy fiber at the end. On long OTDR traces, the attenuation of the test pulse causes the OTDR trace to look noisy as it reaches the OTDR's measurement limit. The noise will make measuring the fiber attenuation very uncertain.
The OTDR has a method of compensating for the increased noise in the trace. It’s called the “least-squares analysis” (LSA). This method uses a mathematical (least squares) analysis to fit a straight line to the fiber's slope to calculate the fiber's attenuation. Since noise in the fiber trace is random, averaging the data reduces the effect of the noise and makes for a more accurate measurement.
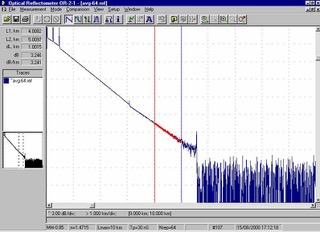
Here is how the OTDR fits a straight line (shown in red) to the fiber trace to measure the slope and calculate the attenuation coefficient of the fiber in decibels per kilometer (dB/km).
The LSA also can be used to make splice or connector loss measurements more accurate. Remember, on the OTDR display, we can see the fiber joint and measure its loss. A splice looks like this:
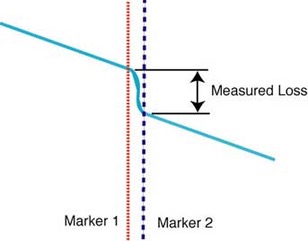
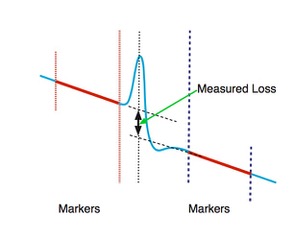
Sometimes the position of the markers can cause measurement errors. The shape of the OTDR trace limits how the markers are placed for measuring splice loss. They must be placed on sections of the fiber before and after the splice where the fiber trace is straight, so the loss measured is not affected by the splice shape.
On long cables, the markers might have to be placed 50 or 100 meters apart. Between marker locations is a length of fiber, and that fiber has loss. So if the markers are 100 meters apart, not unusual for typical OSP single-mode links, the measured loss includes the splice plus the loss of 100 meters of fiber. That 100 meters of fiber is 0.1 km and at 1,310 nanometers (nm) has about 0.04 dB of loss (0.1 km at an attenuation of 0.4 dB/km). The loss of that 100 meters of fiber is about the same as the typical fusion splice loss for single-mode fiber, so the measured loss is twice as high as it should be.
The OTDR uses the LSA to correct the loss measurement for the marker positions. The LSA uses its mathematical analysis to calculate the straight-line approximation of the slope of the fibers on each side of the splice and then extrapolates those straight lines to the loss location to calculate the splice loss. The separation of the two extrapolated lines allows the OTDR to measure the splice loss at the exact splice position. This removes the errors caused by the OTDR trace shape at the splice location.
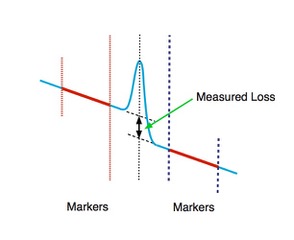
The LSA method has other advantages, too, especially in complicated traces. It allows more accurate measurements of fiber attenuation and connector losses when a connector has a big reflectance peak that affects the width and shape of the event in the OTDR trace. This would normally require the markers to be widely spaced.
Using the LSA method is fairly simple, but you have to set several extra markers. One marks the location of the event (splice or connector), and two markers set the length of the LSA straight line approximation section of the fiber on each side. The little extra time required is well worth it for the more accurate measurement you get.
About The Author

HAYES is a VDV writer and educator and the president of the Fiber Optic Association. Find him at www.JimHayes.com.