In last month’s article, I launched into a PQ investigation of why the customer’s uninterruptible power supply (UPS) for his computer system would alarm every Saturday at 5 p.m. when nothing else in the house seemed to be affected. A PQ monitoring instrument was used over two separate multiweek periods, which showed no abnormal voltage or current variations during the time the alarm went off. The next step was to look into the UPS operation to see if there were any more clues.
The operation manual for the small VA UPS said it has the capability to do weekly self-checks to determine the system’s health. Two LEDs provide a status code after the test to indicate if all systems passed or what major component was out of specification, but the homeowner never saw this.
Testing the UPS
A simple setup was used to test the UPS. A test box with a switch was plugged into the 120V wall receptacle, and the receptacles on the box’s output were used to plug the input into the UPS and voltage channel A on the PQ monitor. The test box has the line conductor brought out in a loop for a current probe to be clamped on to monitor the input current to the UPS. The UPS output had multiple receptacles, so the computer system was plugged into one and the other was used for voltage channel B. There was no easily accessible point to monitor the output current to the computer system.
Everything was running as usual, with the computer and monitors all on. The PQ monitor was set up to record journal valves of voltage, current, power, frequency and harmonics every second. It was also set up to capture any voltage variations outside of typical limits, such as 90% of nominal for a voltage sag or a 200Vpk for an instantaneous voltage transient.
The journal data for each voltage and current channel contains the instantaneous valve as well as the minimum and maximum valves that occurred for each parameter during that interval. During a voltage variation, such as a sag, this trend data shows the reduced RMS voltage of the sag but not the precise time it occurred. That information is part of the PQ disturbance recordings.
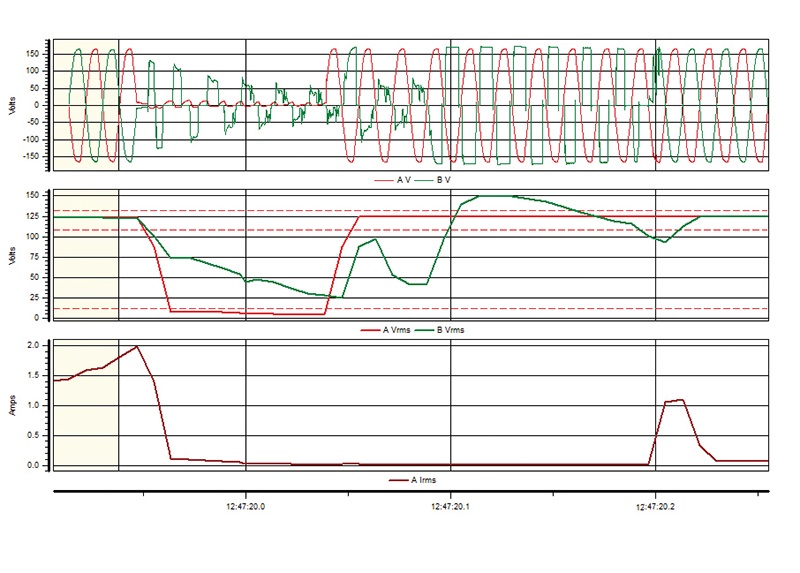
In most PQ audits, the journal interval is set to 10 minutes. Since this was a quick set of tests, the 1-second interval might provide other clues. The problem became obvious with the first test that lasted just 0.14 seconds, as shown in Figure 1. The top graph is the voltage waveforms for the input voltage (red) and output voltage (green) of the UPS. The middle graph is the RMS voltages, and the bottom graph is the RMS current to the input of the UPS.
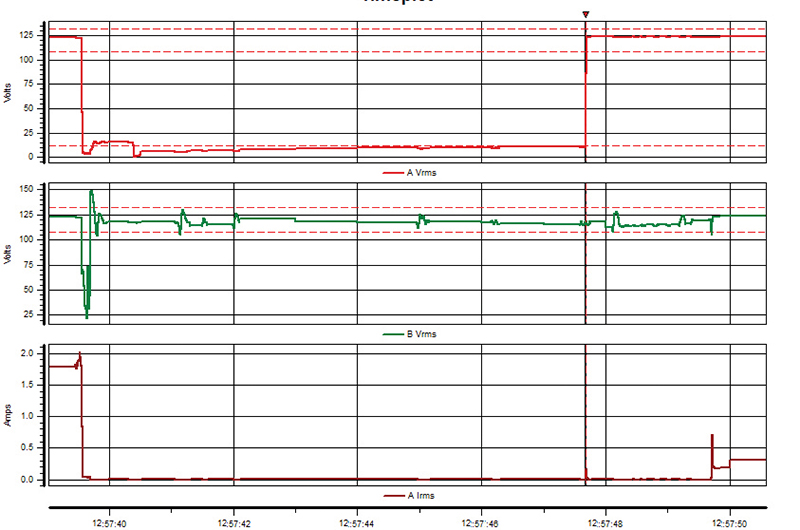
Figure 1
If the UPS was performing properly, the output voltage should have shown no significant changes when the input voltage was interrupted. The internal battery voltage should provide the source for the DC-AC inverter to provide the voltage sine wave. The input current should drop to near zero with no input voltage. When the input voltage returns, the output voltage should look like the input voltage and the input current should show the effects of increased current to recharge the battery, if the interruption was long enough.
In this case, the output voltage collapsed as soon as the voltage interruption occurred. After the interruption ended, the output voltage swelled above the 120V RMS nominal for six cycles and then returned to normal. The input current did drop to near zero amps, but the input current didn’t recover. This is because the UPS didn’t do its job and the computer system shut down. When the voltage returned, the computer system doesn’t automatically turn on; it requires a manual restart. The tests were repeated several times with similar results.
A longer interruption test was done to get a clearer picture of the UPS state after the voltage returned. Figure 2 shows the RMS voltages and current during the 8-second voltage interruption. The output voltage again swelled dangerously above 150V RMS, and the input current after the interruption was clearly lower, as the computer system had shut down.
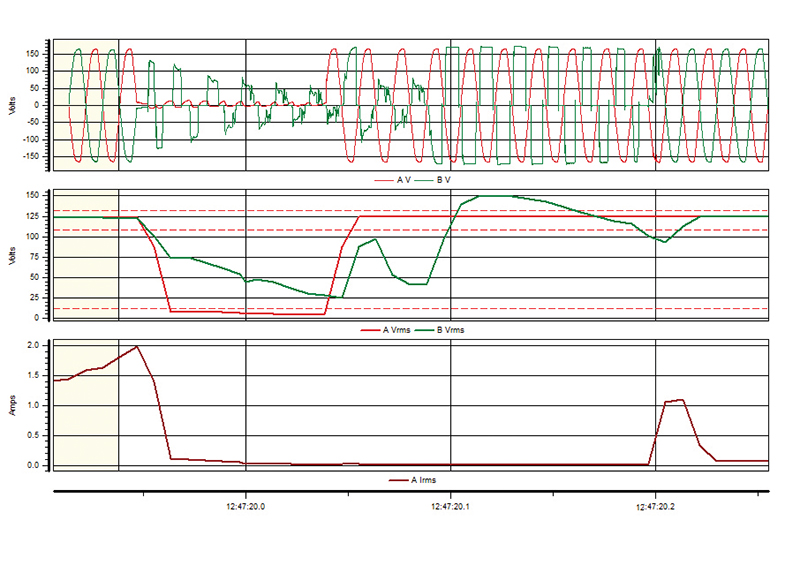
Figure 2
The conclusion is that the UPS had become a large paperweight. It was only able to restore itself to operation after even a very short voltage interruption, and it couldn’t provide the ride-through for the computer system as intended. The most likely source is the UPS batteries; however, as it came back to life, the self-test did not display the coded signal it is alleged to produce.
richard p. bingham
About The Author

BINGHAM, a contributing editor for power quality, can be reached at 908.499.5321.