Last month’s article discussed the preparation for performing power quality troubleshooting or benchmark audit surveys with a PQ analyzer. All the necessary safety precautions should be followed while properly connecting the voltage and current probes of the PQ analyzer to the circuit for the required application.
Phasors and power factor
If the PQ instrument has a scope mode or phasor mode, they can be used to verify the probes are all hooked up correctly. For a three-phase circuit, the voltage waveforms or phasors should be 120 degrees apart. The channel on the Phase A voltage is usually referred to as the reference channel. Phase B voltage should be 120 degrees apart from Phase A, and then Phase C should be 120 degrees from B.
The current waveforms or phasors are a bit different. Depending on the type of load(s) in each circuit of the phases, the current relationship may not be 120 degrees. In fact, it often is not.
The type of load also determines the relationship between voltage and current for each phase. Most loads are inductive, so the current should lag the voltage. Leading current is possible, but not common.
Power factor (PF) is a result of the phase relationship between the voltage and current. Displacement PF is directly related, being the cosine (a trigonometric function) of the phase angle between voltage and current. However, that has been found to not be an accurate representation of the power factor when harmonics are present.
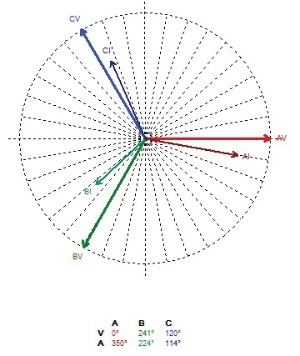
True power factor, or watts/volt-amperes, is the more commonly used parameter now. A typical phasor representation is shown in the figure. Note that if monitoring a three-phase delta circuit, the current phasors will typically be 30 degrees lagging from the voltage event with no PF shift, due to probes measuring a phase-to-phase voltage and the phase current.
Start on the right foot
It’s important to get this right before monitoring begins because most PQ phenomena affect the voltage and current. How they change from before, during and after the disturbance gives an important clue as to what happened and why.
For example, if there is a voltage sag on the distribution system, and the current phasors for B and C suddenly point in the same direction, the voltage sag was likely caused by a fault between those two conductors. Or, if the Phase A voltage waveform has large negative transients going to zero volts, but the phase A current waveform shows nothing changing, then these voltage transients probably aren’t real and there is likely an issue with how the voltage connections were made.
The next step is to see that the voltage and current readings make sense for the loads on the circuit being monitored, and that the current probe range is appropriate for anticipated levels over normal and fault conditions. A 10A CT, which can typically measure up to 30A, could technically be used to monitor a 20-HP motor. However, the inrush current could be over 100A, so the current readings during startup would not be accurate and waveforms recorded would be highly distorted. On the flip side, using a 1,000A CT on a 15A circuit would probably not read accurately either, as clamp-on CTS (other than Rogowski coils) are typically only accurate to 10% of full scale.
PQ monitor data
Once the metering data has been confirmed to be as expected, it’s time to get the PQ monitor collecting data. Many instruments have automatic setups based on the application that are a good starting point if the user is not familiar with the instrument. Start recording for several hours, then review the data to see if too much data is collected. This can happen because triggering limits are set too tight, especially when current level triggers are used. While most instruments have a lot of memory, collecting too much data that takes ages to review doesn’t help accomplish the objective. If in doubt, refer to 1159-2019, IEEE Recommended Practice for Monitoring Electric Power Quality, Section 7.5, for more information, as well as the instrument manufacturer’s user’s guide.
The monitoring period is usually at least one business cycle for a benchmark survey, or however long it takes to capture the phenomena that is causing equipment to malfunction. A business cycle is often one week, as the operation of a facility is different depending on the day of the week. It is also good to monitor in different seasons, as HVAC loading will normally vary significantly in summer versus winter.
As for troubleshooting mode, it’s helpful if those in the facility can log any unusual events, such as when lights blink, a process malfunctions or external events such as lightning occur. This will help when reviewing the data to determine what’s going on. That will be covered in the next month’s article.
Richard P. Bingham
About The Author

BINGHAM, a contributing editor for power quality, can be reached at 908.499.5321.