The owner of a single-family Cape-Cod-style home complained of lights blinking off and on for six months. It occurred mainly at night, seemingly in half the house. Stormy nights might have made it worse. It was annoying, especially when equipment, such as the cable modem, would reset and restart.
A call to the local electric utility resulted in replacing the connection to the house on one conductor, but the problem continued.
A power quality monitor was connected at the service panel on the utility side of the main breakers. The two phase conductors were monitored L-N, and the N-G voltage was also monitored. Two clamp-on current probes with a nominal 10A, peak 30A range were placed on the conductors. The monitor was set up in standard power quality monitoring mode and left to record for a week.
Nine days later, the data on the memory card was analyzed in the instrument manufacturer’s software program. Figure 1 shows it wasn’t the homeowner’s imagination. In fact, they understated the problem, as blinking lights aren’t often detected in daylight. Nine sags were low enough to be classified as interruptions. The sag durations ranged from a half-cycle to over a minute, though most of them were in the range of 3–10 cycles, and almost all of them were only one phase.
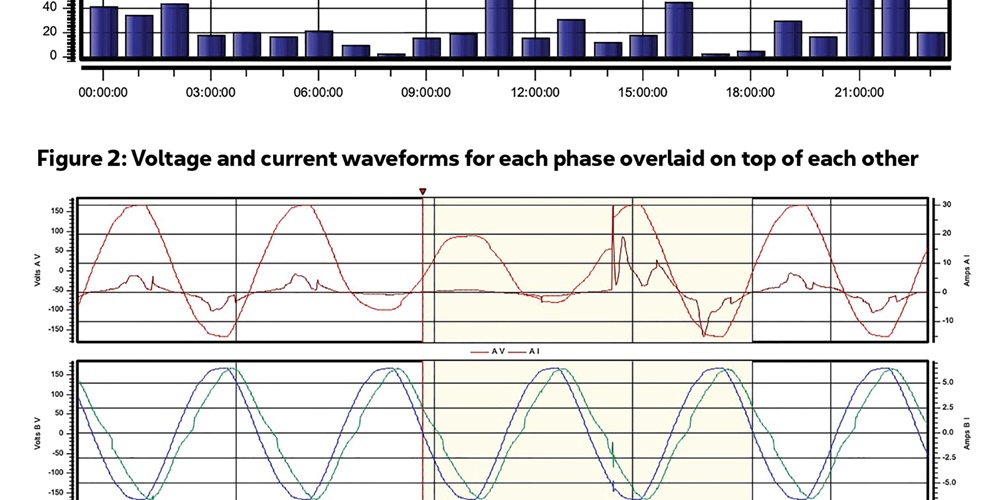
Further analysis of the RMS plots for voltage and current indicated that there was little change in the current when a sag initially occurred. If it lasted long enough, the current would increase because some of the loads were constant-power devices, where the current increases when voltage decreases to keep the watts the same. Looking at the detailed waveforms of voltage and current, such as in Figure 2, further confirmed this.
Downstream or upstream?
One of the “PQ rules” discussed in the past states that if the voltage sag is caused by something occurring downstream from the monitoring point, the current will increase significantly, often several times its state prior to the sag. The corollary is that if there is a reduction or small increase in current, then the source is likely upstream, as in this case.
Looking closely at the waveforms in the graph, the top traces are the voltage and the current for Phase A, the one having nearly all the voltage sags. The current clearly decreases when the voltage sag starts. When the sag ends with the voltage abruptly returning to the normal sine wave value, the current waveform increases with some oscillations that last for a cycle or so, until the presag pattern returns.
At the transition point, a small transient occurs on the current for Phase B. Otherwise, there are no noticeable changes through the sag. This means the problem is confined to one conductor, and there were likely no 240V loads on at the time. The homeowners confirmed this, as the only 240V circuit was for the AC unit, which was off in March.
The monitoring point was located where the conductors enter the breaker panel, which would point to the problem being upstream on the utility side. The conductors from the weatherhead down to the meter appeared to be in good condition, and no tree branches would have contacted the wires from the utility transformer to the weatherhead. This indicated that the problem was somewhere on the distribution system.
A number of the voltage waveforms during the start of the sags had the classic “arc-over” transient pattern when a conductor comes into contact with a tree branch. Though that would be consistent with the homeowner’s hunch about storms, the number of voltage sags occurring at nearly every hour and every day indicates something else is happening on the distribution system.
Given the overwhelming evidence of source-side, utility-originated sags, the customer contacted the electric utility to have them determine how to mitigate the well-documented problem. The utility company rep took a copy of the PQ audit report, and without further contact to the customer, the problem has miraculously diminished to barely noticeable anymore.
Header image by Richard P. Bingham.About The Author

BINGHAM, a contributing editor for power quality, can be reached at 908.499.5321.