You're reading an older article from ELECTRICAL CONTRACTOR. Some content, such as code-related information, may be outdated. Visit our homepage to view the most up-to-date articles.
Albert Einstein—who said, “Make everything as simple as possible, but not simpler”—spent years in pursuit of the Unified Field Theory to combine gravitational and electromagnetic forces into a single relationship. Many people in the power quality community have expressed interest in a similar concept, especially when dealing with those “outsiders” who don’t really understand the various types of power quality phenomena, what causes them, how they are measured and, most importantly, how they affect the equipment that is powered by the electric supply. Some power quality indices have been proposed, and some were used and others misused over the past 40 years. But the complex nature of integrated systems makes attempts to use a single parameter to describe them problematic.
For starters, there are dozens of parameters typically used to describe the various types of power quality phenomena, depending on whether it is a steady-state condition or a disturbance that lasts from microseconds to a minute. Steady-state distortion of the waveforms can be quantified by the harmonic content with the parameter total harmonic distortion (THD). If it is voltage fluctuations resulting in light flicker, perceptibility short term (Pst) is used. Both terms have their shortcomings. THD is a reasonable measurement for voltage, where values greater than 5 percent are causes for investigation and greater than 8 percent can get serious, though some systems operate without issue at such levels. However, THD is basically meaningless for current, since it is the amount of distorted current as related to the system’s current capability that really matters—0.5 amp (A) out of 1A on a 30A circuit is 50 percent THD, but 0.5A out of 30A is insignificant.
As for Pst, it is a very complex calculation that primarily accounts for the response of the human brain through the eye to modulations in light intensity of an incandescent lamp. The average person will perceive flicker if the Pst is greater than 1. But ambient light, wattage, type of light source, activity of the person, and the person itself (test subjects originally used weren’t a statistical cross-section of the world’s population) all are variables that can affect the perception. And now people are using Pst as a basis for equipment problems, which are highly unlikely to be as susceptible to 0.3-volt (V) modulation of 120V at 8.8 hertz (Hz) as a human is likely to be. Unbalance in the voltage or current has its own measure, though two are used (negative or zero sequence value divided by the positive sequence value, or the maximum deviation from the average of the three phase values divided by the average).
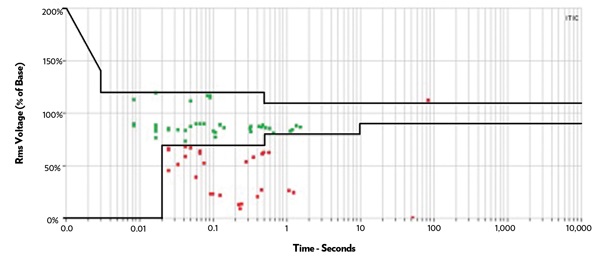
Depending on how much the rms voltage changes from the nominal voltage and for how long, it can be classified as a rapid voltage change, a sag (or dip), or an interruption, ranging in duration from instantaneous to momentary to temporary. While long-term or sustained interruptions (or outages) are often classified for the public utility commissions as system average interruption frequency index (SAIFI) or duration (SAIDI), use of system average rms variation frequency index (SARFI) isn’t as well adopted yet. A more common method used for rms variations is the ITIC curve (replacing the CBEMA curve), which plots a dot representing the magnitude and duration of the event on a two dimensional chart that has limit lines representing a typical equipment’s susceptibility, as shown in the figure above. However, unless the affected equipment has a matching susceptibility curve, its value is somewhat limited.
Transients are even less quantifiable. Even after 30-plus years of standards organizations’ efforts in writing power quality standards for susceptibility and emissions, transients remain largely undefined. The peak value from zero axis, relative magnitude from the expected value on the sine wave, width at the 50 percent of the peak value, ringing frequency (if an oscillatory transient), direction (positive or negative from the normal point on the sine wave), common mode or differential mode, and energy (which has to assume an approximate ohm impedance of the system) are all characteristics of transients, but there is no single summary value (though transient suppressors are rated in their ability to absorb joules).
The international community has used statistical values to monitor and penalize utilities for the relative quality of the electrical supply, such as the 95 percent and 99 percent values for a week, as popularized in EN50160 and its derivatives. But the latter is a key. Nearly every country has different acceptable limits of one of more of the statistical values for the 13 key parameters that are monitored. And there always is the corollary argument—the quality can be horrendous in the 5 percent remaining time.
In any facility, there are so many pieces of equipment with different susceptibilities to different power quality phenomena that it seems virtually impossible to come up with a unified parameter to encompass them all. Even different equipment models from the same manufacturer can have different susceptibilities, and when such equipment is interconnected through various types of communication media and equipment, another set of variables is thrown in the mix.
Just like Einstein discovered, sometimes “as simple as possible” can still be complex.
BINGHAM, a contributing editor for power quality, can be reached at 732.287.3680.
About The Author

BINGHAM, a contributing editor for power quality, can be reached at 908.499.5321.