On April 25, 2025, a blackout occurred in most of Spain and Portugal. Dozens of theories were circulated, including claims about a “rare atmospheric event,” cyberattacks on the grid and solar flares from the sun. The speculation may be because the majority of the energy generation was provided by renewable sources. At the time of the incident, it was reported that solar energy accounted for approximately 59% of Spain’s electricity supply, with wind providing around 12%, nuclear 11% and gas 5%.
This is different than most of the widespread power outages or blackouts in the last 50 years, when rotational generators were the primary supplier. A rotational generator has a prime mover, such as steam or water, that rotates a turbine connected to a rotating electrical generator. This system has “rotational inertia,” meaning it generally does not change its rotational speed instantaneously and can usually ride through short-duration disturbances.
That frequency is proportional to the generator’s operating frequency—60 Hertz (Hz) in North America or 50 Hz in Europe. In North America, the 60 Hz is controlled very tightly by system operators. Even variations of just 0.05 Hz will cause system operators to take action to keep it stable. If all of the voltage waveforms are not in sync throughout the grid, changes in the direction of power flow can cause instability. Generators are designed to trip offline to isolate themselves and prevent catastrophic damage, but this itself can cause other generators to trip, go offline and result in cascading failure. Things can go bad in minutes or even seconds.
Most of the nation’s wide-scale blackouts resulted from this chain reaction, including the one in 1965 that affected 13 Northeastern states for 13 hours, the 1996 Western blackout from Mexico to Canada and the 2003 blackout that affected 45 million people in eight Northeastern states.
In a scenario where nonrotational generators provide the bulk of the power, the power provided from solar panels is DC, not 60 or 50 Hz AC. The DC voltage must be turned into an AC voltage waveform that will synchronize in both frequency and phase angle to the grid frequency.
The same is true for wind turbines. The turbine’s rotation is based on the speed of the wind and the blades’ configuration. This variable-frequency waveform is converted into DC voltage, then back into AC.
The investigation into the blackout is ongoing, but as of the time of printing, it seems that in the 30 minutes before the blackout, two low-frequency oscillations of 0.2 Hz lasting several minutes were measured by phasor measurement units between the Iberian Peninsula grid and the Europe-wide grid. The transmission tie lines to the European grid in France disconnected due to the differences in phase and rate of frequency change that exceeded limits in order to prevent damage to the spinning turbine generators. Once isolated, it took the grid operators 10–14 hours to restore power to the 59 million people affected.
A smaller-scale example
The following smaller-scale example shows how grid operators must contend with new situations. The data is from a much simpler electrical environment previously discussed in “The Unhappy Camper,” ELECTRICAL CONTRACTOR, September 2024.
A small recreational trailer has a 12V battery that provides both 12V DC as well as 120V AC from a DC-to-AC inverter. Additional power can come from solar panels through a controller and shore power (120V AC), which also provides 12V DC via a converter. The homeowner replaced the 200Ah lead acid batteries with a 230Ah lithium battery and a new controller/charger.
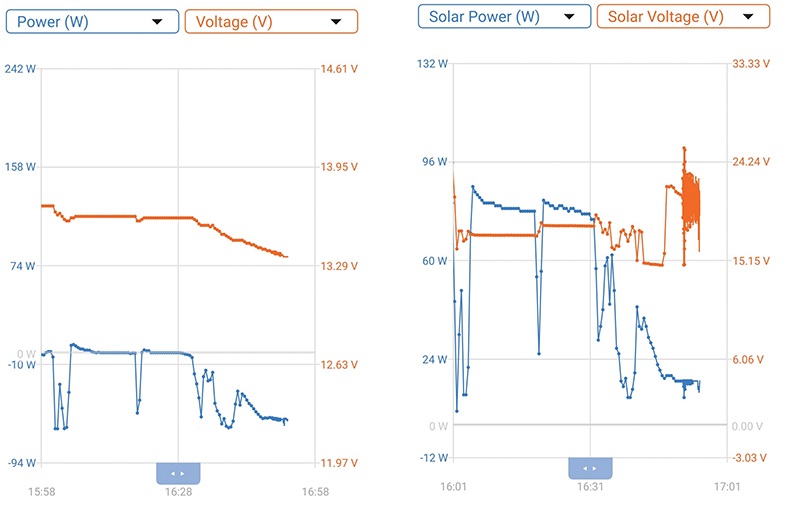
As with any new power system, a commissioning test was conducted to determine if all systems were operating properly. Since the shore power components weren’t modified, that source was disconnected initially. The first test was to see if the battery could be properly charged from the solar panels. The second test was a load test to see if the rated Ah values were met. The graphs illustrate what happens during “cloud” transients.
What may be a bit confusing is that the graph on the left is the consumed power of the battery. When the battery is providing power, it is a negative number. It goes from 0W when the solar panel is providing all the power at 16:00 to approximately 75W each time a cloud comes over and shuts the solar output to nearly 0W.
This continues to occur, although less severely, until around 16:30 as more clouds appear and the angle of the sun gets lower. As the solar output reduces, the battery then provides the operating power needed for the test load.
On a partially cloudy day with high atmospheric winds, power flows change quickly and unpredictably throughout the network. The effect on a grid like Spain’s is unimaginable. I’m glad I’m not a system operator there.
richard p. bingham
About The Author

BINGHAM, a contributing editor for power quality, can be reached at 908.499.5321.