What a wild roller coaster ride we took in 2020. The year began amid a historic but softening U.S. economic expansion. Then COVID-19 struck. The descent was brutal. An earlier-than-forecast recession took hold, hitting the construction industry hard. COVID-19 containment, vaccine roll-outs and therapeutics will hover over the coming months. Expect a slow heal extending into 2022. There will be dips, rises and a few turns in 2021. The ride is not over, but growth is returning.
Dodge Data & Analytics, Hamilton, N.J., reports 2020 total construction activity fell an estimated 14% to $738 billion. For comparison, pre-COVID 2020 projections expected a contraction of just 4%. ConstructConnect, Cincinnati, estimated a 2020 loss of 18.8% ($672 billion). Dodge uses a team of in-house economists for its forecasts. ConstructConnect economists partner with Oxford Economics, Oxford, England. Starts percentages and dollar gains can diverge between the two.
This year, both forecasts predict some overall economic improvement. Dodge expects total construction activity gains of $771 billion; ConstructConnect predicts gains of $747 billion.
Dodge presented a pandemic-abbreviated version of its planned 82nd annual Outlook Executive Conference on Nov. 9, 2020. ConstructConnect brought together its and other chief economists from the American Institute of Architects (AIA), New York, and the Associated General Contractors of America (AGC), Arlington, Va., in its webinar, “The Construction & Design Post Election Outlook: What to Expect in 2021 and Beyond,” held Nov. 18, 2020.
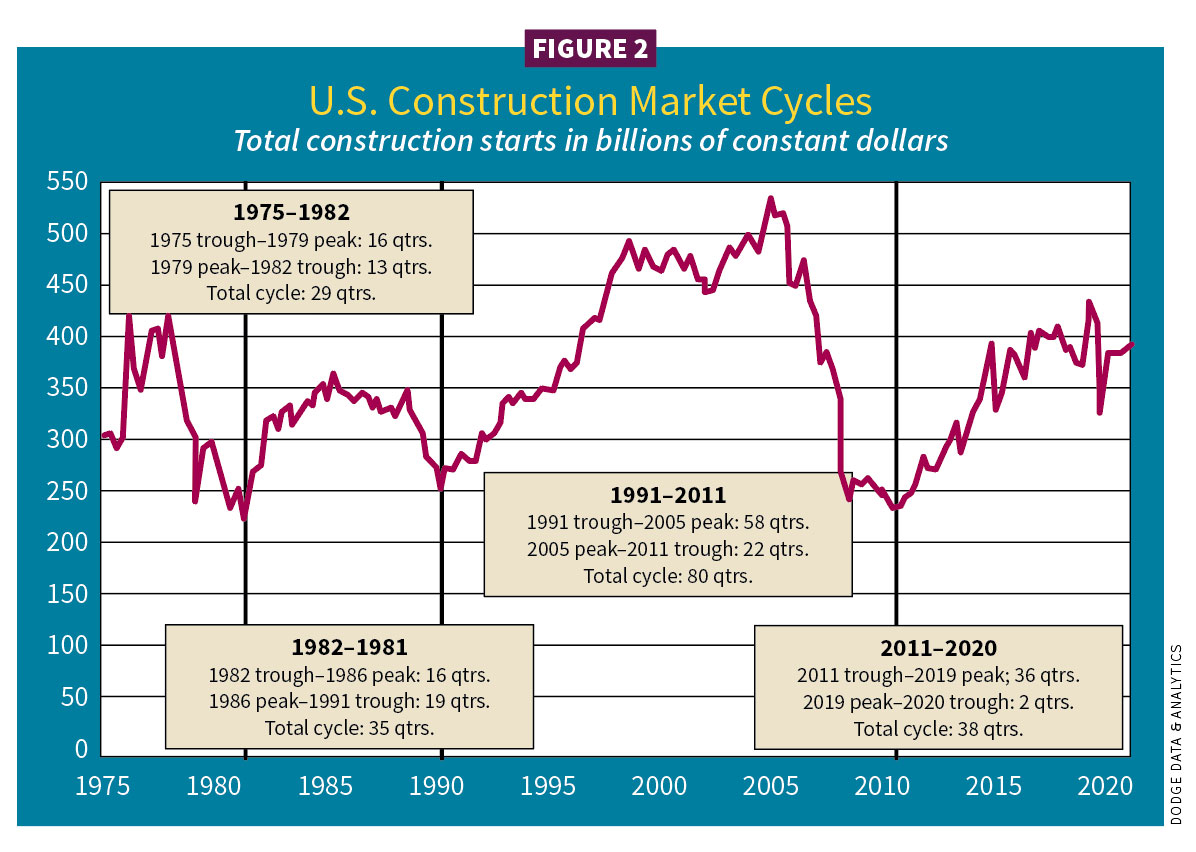
“While the recovery is underway, the road to full recovery will be long and fraught with potential potholes,” said Richard Branch, chief economist for Dodge. In short, Dodge 2021 forecasts show residential buildings increasing 5%, nonresidential buildings gaining 3% and nonbuilding construction improving 7% (see Figures 1 and 2). With some sectors categorized slightly differently, ConstructConnect projects residential gaining 7.2%, nonresidential up 14% and civil (nonbuilding) growing 13.5%.
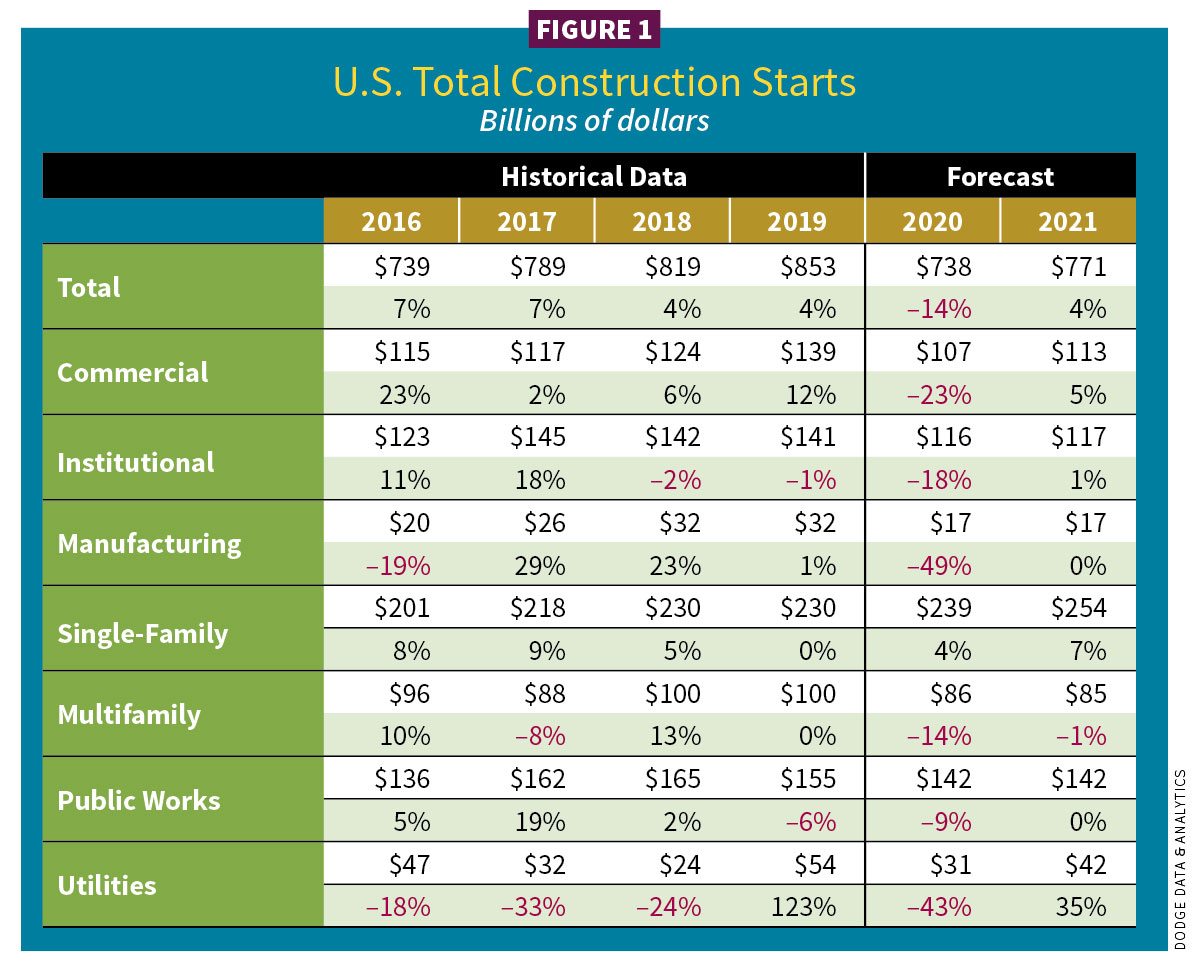
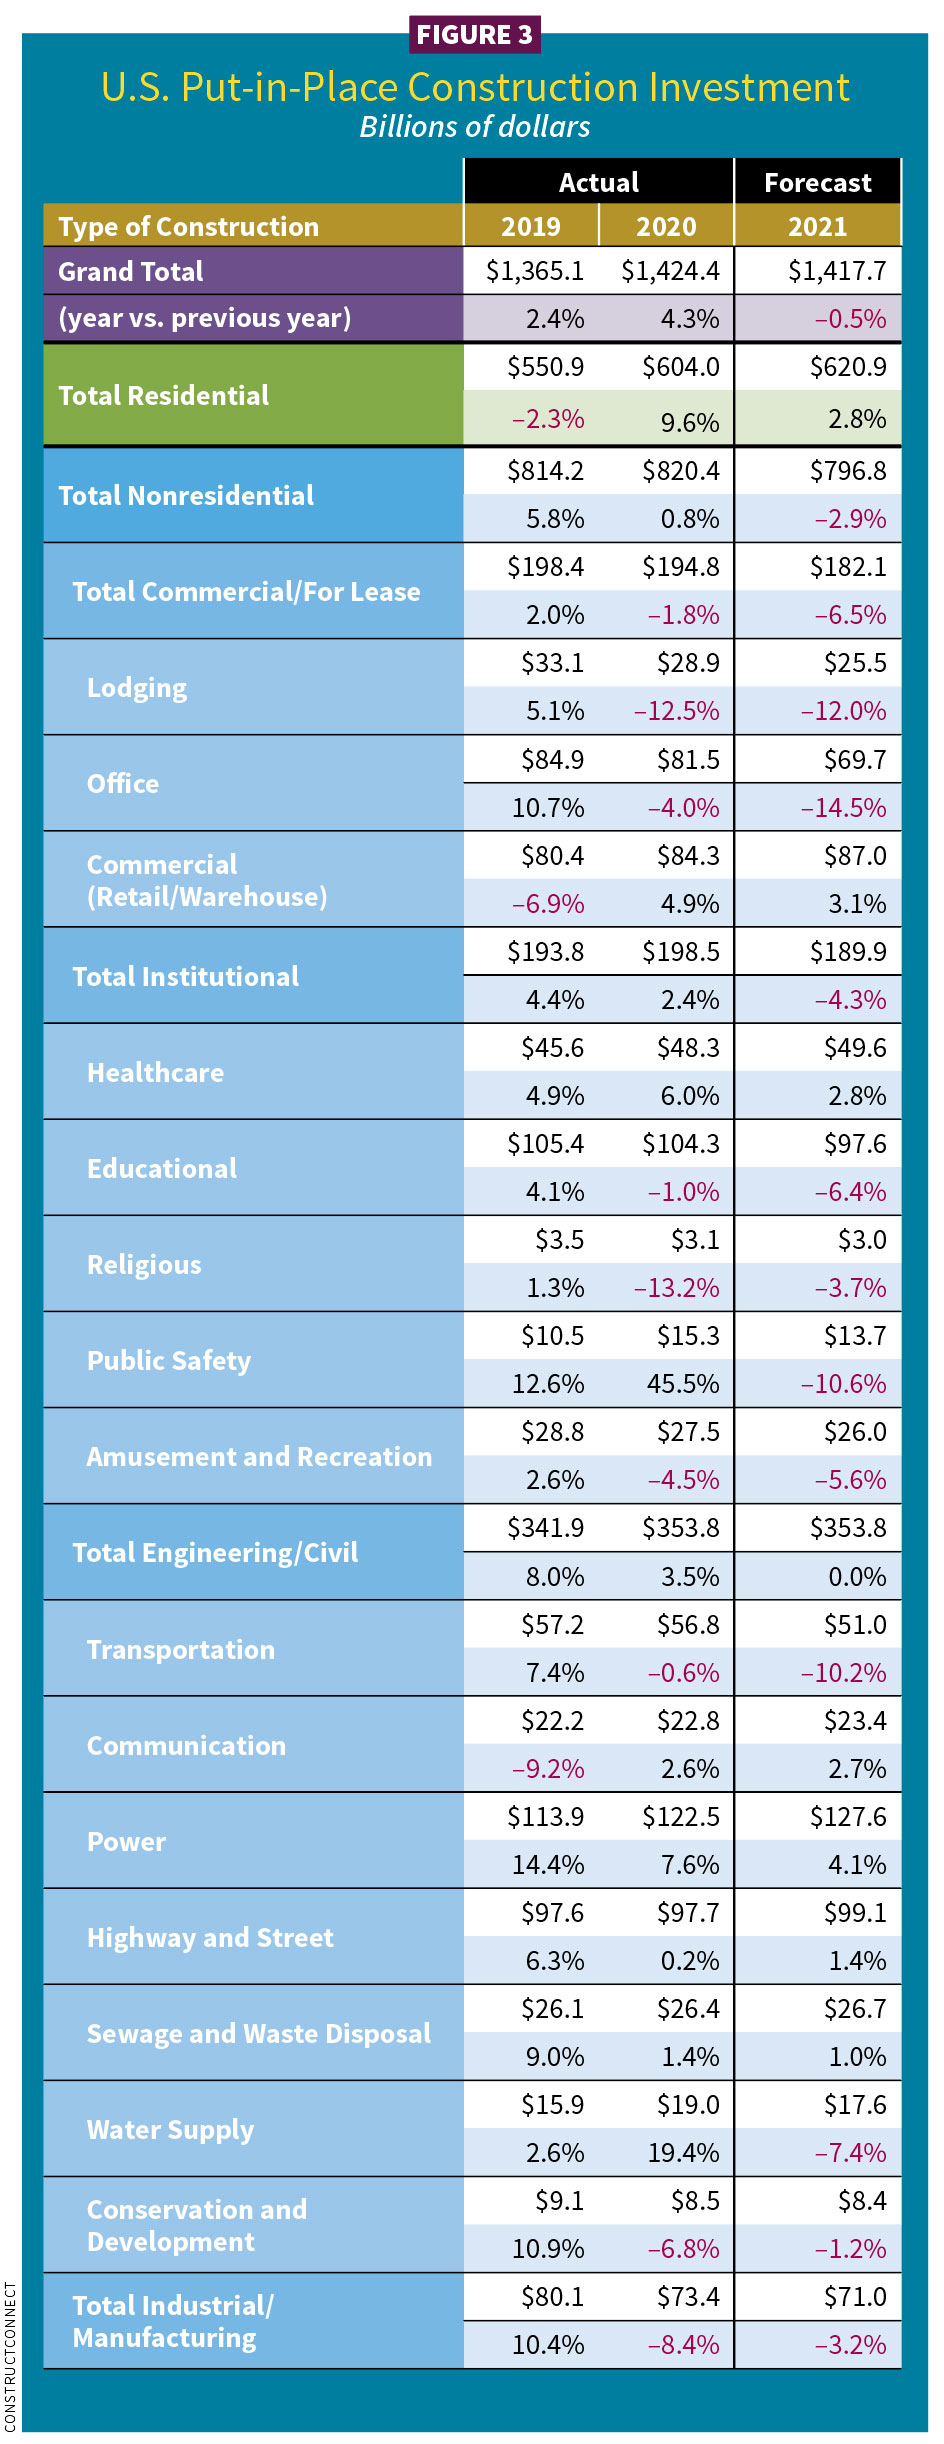
The AGC uses U.S. Census Bureau figures to capture put-in-place (PIP) construction spending, i.e., the total dollar value of construction work done. September-over-September (2019-2020) spending was 4.1% higher. PIP numbers typically come in higher than starts as they include a degree of carryover work. Even with the 4.1% spending rise, total contraction spending levels shrunk 2% (February to September 2020). That included residential spending advancing 3%, nonresidential retracting 6%, and public construction falling 4%. However, late November 2020 figures from the U.S. Census Bureau showed encouraging third quarter nonresidential spending gains of 7.8%, with advances reported in nearly every subsector. ConstructConnect saw 2020 PIP gains of 4.3%. A drop to 0.5% is expected in 2021 (see Figure 3).
A dramatically different slowdown
While the construction industry faced unnerving losses in 2020, it also attained levels of recovery in some markets, with one sector bettering 2019 numbers—hello, single-family residential. A recovery will offer different levels of improvement. Remember, some markets were already challenged before COVID-19, such as retail, hotels and manufacturing. Some regions suffered more than others (see Figure 4).
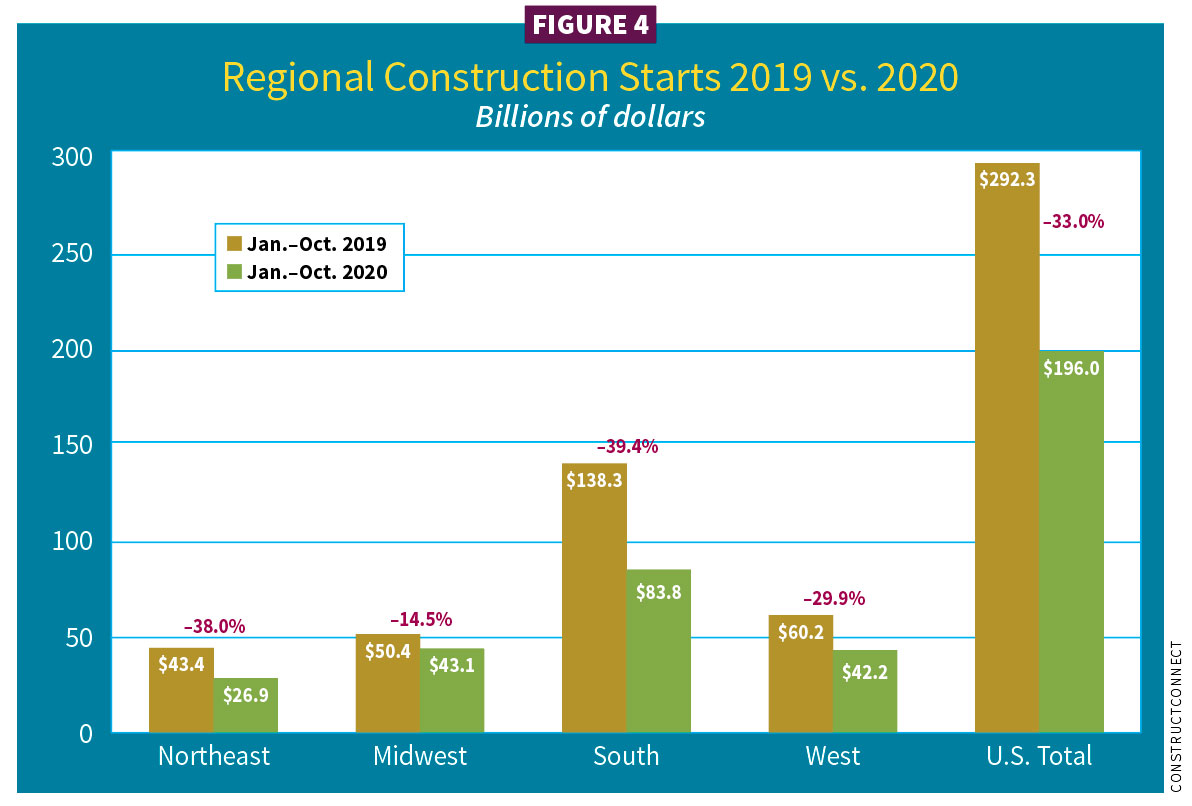
“Total construction peaked in the fourth quarter of 2019 ($853 billion),” Branch said. “The industry enjoyed an expansion for 36 quarters. That was impressive. Total starts in April 2020 plummeted (losing 25%), but progress started in May (3%; 6% in June). We then experienced a setback in July (–7%) and retreat (–18%) in September.” October reversed the trend, showing a gain of 12%.
“Expect modest progress in a recovery in 2021 that takes a few steps forward but sometimes a few steps back,” he said.
One of those steps forward is single-family, which will continue to gain in 2021. In September 2020, AGC reported private residential spending climbed 2.8% and 9.9% year-over-year. Single-family homebuilding soared 5.7% in September, while multifamily construction spending rose 1.2%.
“Once the stimulus kicks in and broad vaccine adoptions take hold, we will see the economy accelerate with year-end [gross domestic product] of 2.8%,” Branch continued. “For 2020, we estimate a year-end GDP of –4%.”
ConstructConnect’s chief economist Alex Carrick expected GDP to contract 3.5% in 2020 and rebound around 3.7% in 2021.
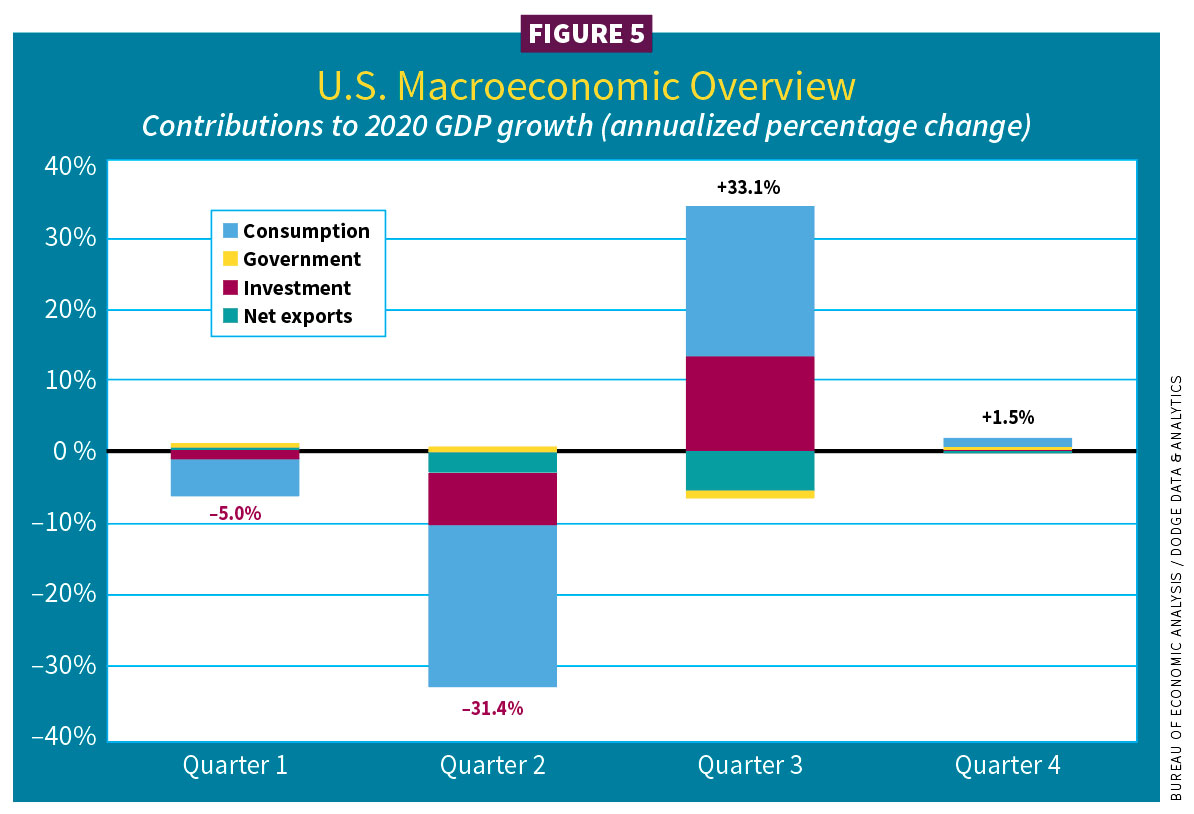
As shown in Figure 5, slow fourth-quarter growth in 2020 led to an annualized 1.5% rate, Branch expects that U.S. GDP growth will accelerate slightly in the first quarter of 2021 and should continue to do so as 2021 progresses.
“We are not forecasting a double-dip recession,” Branch said.
“Remember, 70% of GDP is consumer spending,” Carrick cautioned. “Less than half of that is retail spending. More than half is services (travel, hotel motels, bars and restaurants). Job losses are in this half where sales are dramatically down. This part of the economy will take a while to get back.”
Additional federal stimulus is baked into both 2021 forecast projections. Using a simulation from Deutsche Bank, Frankfurt, Germany, it seems timing is everything.
Kermit Baker, chief economist for AIA, predicted that the nearly $1 trillion economic relief package, which was passed by Congress in December, will ”likely postpone recovery to the second or third quarters of 2021.”
A fall 2020 AGC survey found that only a minority of contractors expected to add to their workforce in the next 12 months. “As project cancellations mount, so too will job losses on the nonresidential side unless the federal government provides funding for infrastructure and relief for contractors,” said Ken Simonson, AGC’s chief economist.
A pandemic recession
The Dodge Momentum Index (DMI) was starting to pull back before COVID-19 (see Figure 6). Though it hit a low in the summer of 2020, Branch said it began to show progress in commercial, including warehouse starts, and some sizable office projects. Institutional, though an unsteady sector, also showed some growth as of October 2020. The DMI factors in the value of nonresidential in the early conceptual phase (excluding transportation and manufacturing due to inherent volatility).
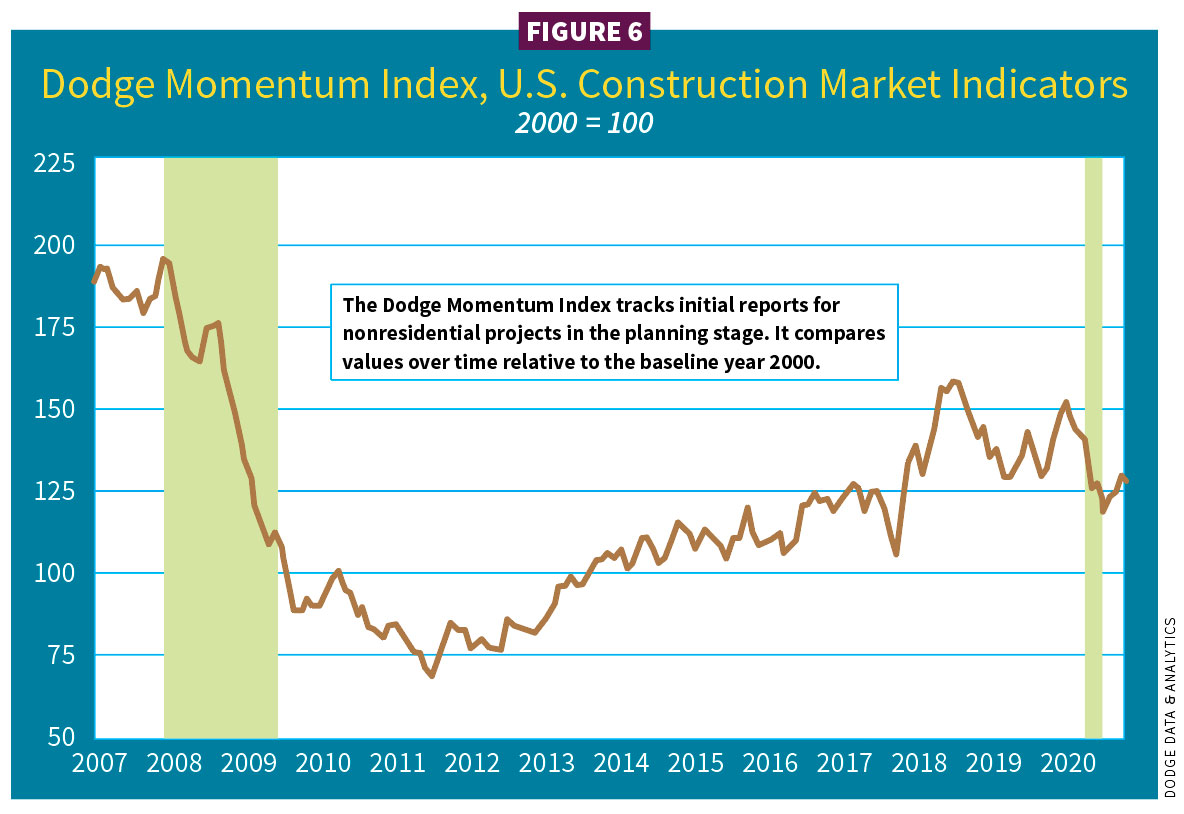
“Overall, we think there are enough projects in the pipeline,” Branch said. “That is different from the Great Recession [2008].”
AIA’s Billing Index offers yet an additional perspective on what is going on within the construction economy.
The Billing Index shows a “more dramatic slowing than either spending or put-in-place numbers show,” Baker said. “Now at 47.5% [as of October 2020], the rate of decline is starting to slow but still not positive. The 2008 downturn recession was less sharp.”
Baker shared that business conditions at architectural firms have begun to stabilize. (Any score below 50 in the index indicates a decline in firm billings.) An October 2020 sector view showed billing scores for multifamily residential (55.1), mixed practice (52.7), commercial/industrial (48.0) and institutional (42.2). Scoring regionally, the index showed West (50.4), Midwest (49.4), South (45.8) and Northeast (44.9).
In November, the AIA’s ABI survey asked about actions taken by firms or their clients as a result of rising construction material costs and limited availability (see Figure 7).
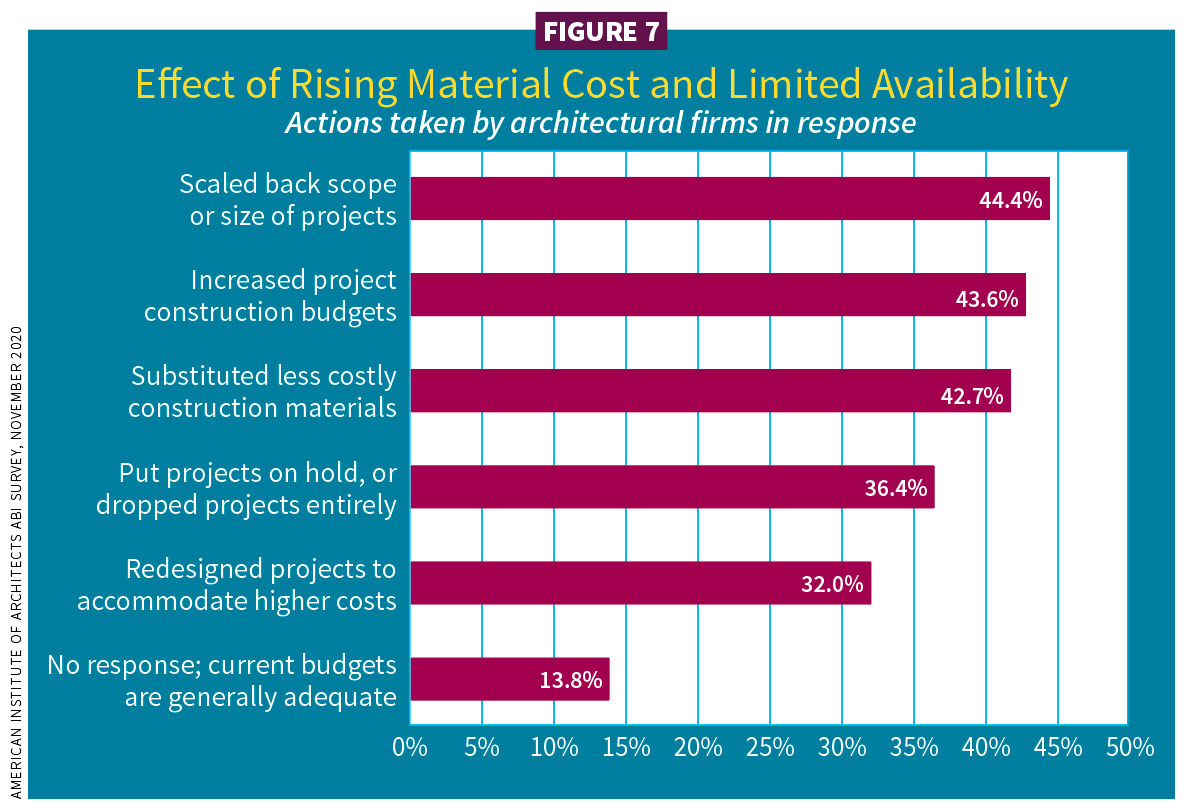
“An October AGC coronavirus impacts survey found 75% of respondents reporting a postponed or canceled project, up from 60% in August and 32% in June,” Simonson said.
Employment
“Since April, we recovered maybe 50% of the jobs we lost,” Carrick added. “I don’t think we will feel confident until we are somewhere around 90% returned employment. For jobless claims, you want 400,000 for a robust economy; 300,000 is even better.”
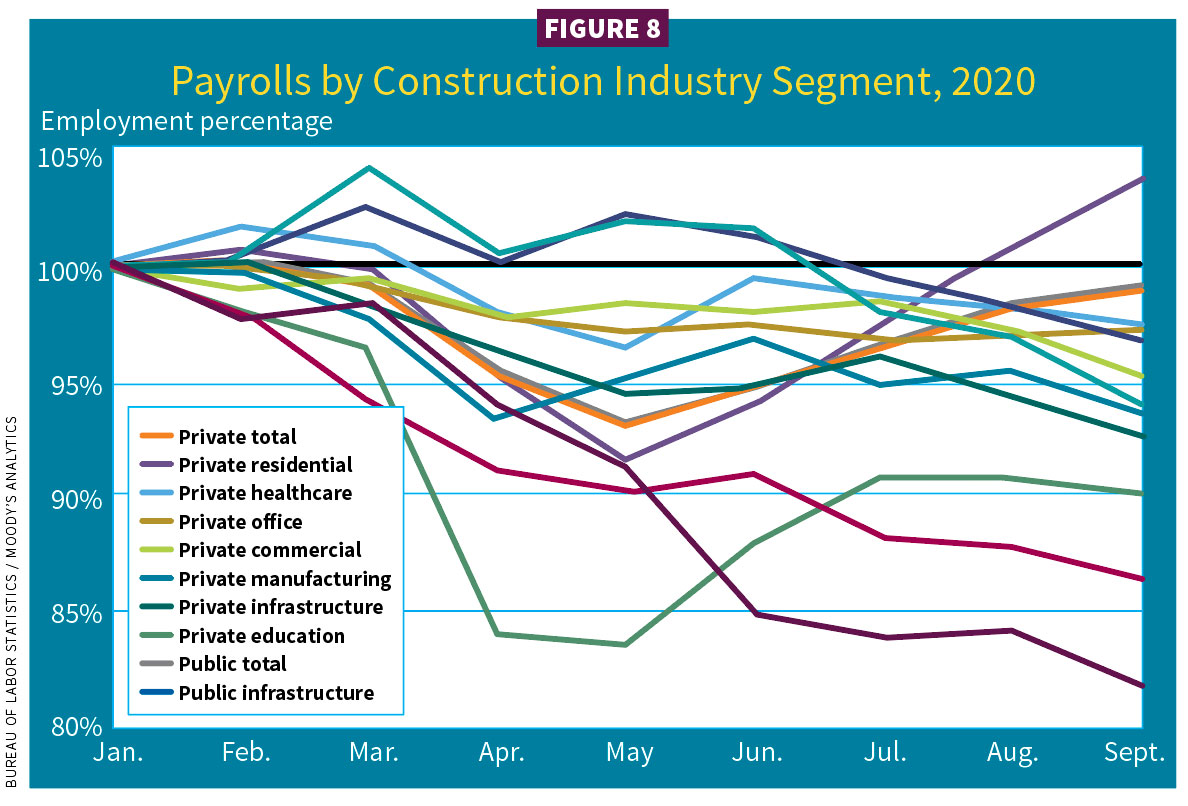
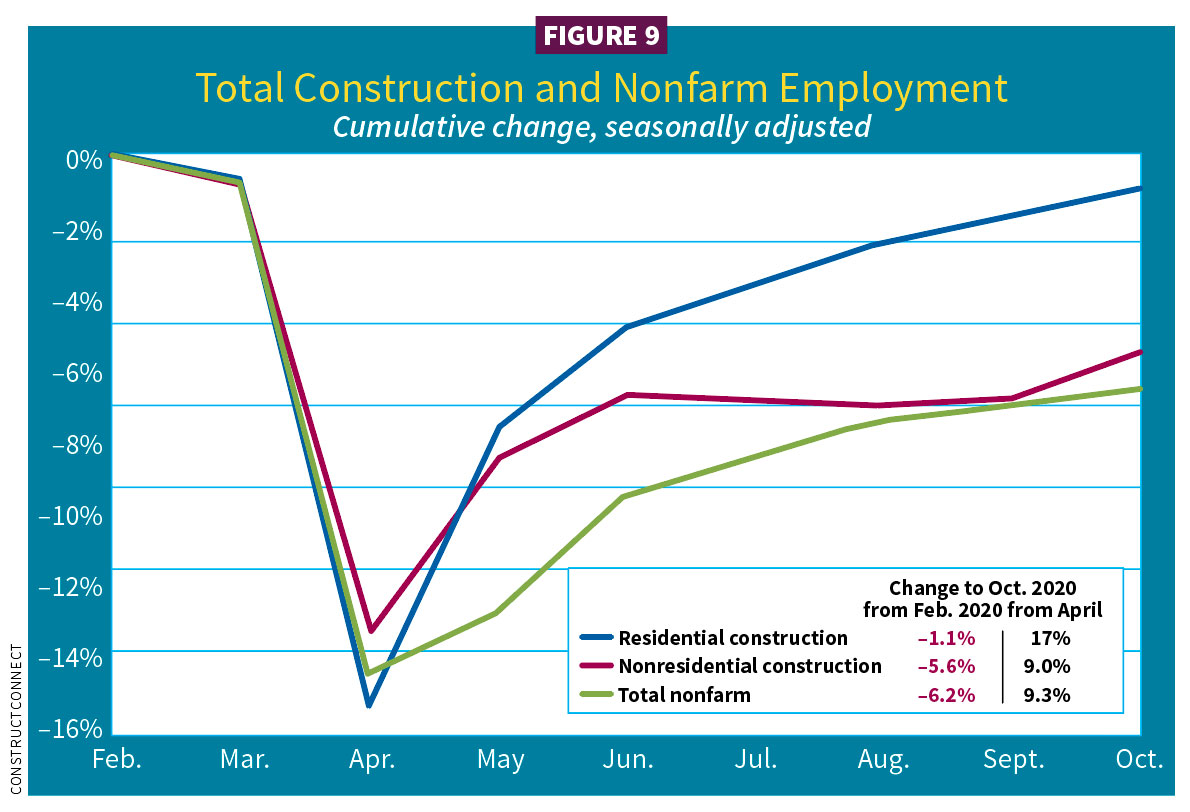
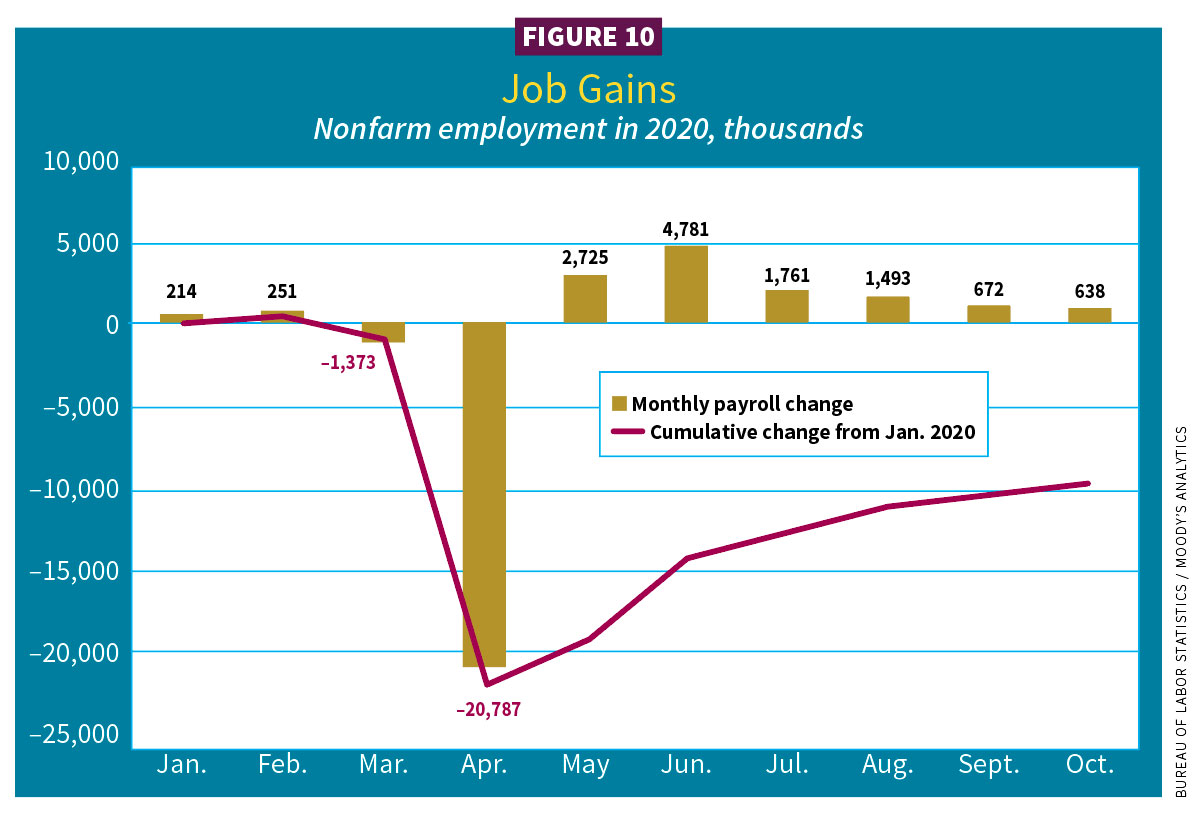
Construction employment has done much better, seeing a 70% return as construction was deemed essential during the shutdown (see Figures 8, 9 and 10).
Baker saw several potential major areas of focus for the Biden administration in 2021.
“We still have divided government and will need to find consensus,” he said.
Possible middle-road areas include fiscal stimulus, taxes, regulation/climate change, immigration policy, healthcare and infrastructure.
The scaffolding in an unsettled time
It was hard to imagine GDP sinking 31.4% in the second quarter of 2020, but it did. However, the shock from the pandemic is different from the 2008 Great Recession. Cristian deRitis, deputy chief economist at Moody’s Analytics, noted that recovery from pandemic-related economic damage may be far quicker than the slow recuperation from the last recession. By the third quarter of 2020, GDP shot back to 33.1%.
“In 2020, we expected some pullback (e.g., impacts [from] trade wars and Brexit), but we were not forecasting a recession,” deRitis said. “When we did expect one (estimated as late as 2022), it was not to the magnitude we saw in the first quarter—a 10% drop in output because of the pandemic.”
DeRitis, a featured presenter on the Dodge 2021 Construction webcast, outlined a recovery moving forward in two phases: pre-vaccines and therapeutics in 2021 followed by post-vaccines in 2022.
On Dec. 11, the FDA issued an emergency use authorization for Pfizer-BioNTech’s vaccine in the United States. The FDA committee then granted an emergency use authorization for Moderna’s vaccine on Dec. 18. A broader-scale rollout of an FDA-approved vaccine is not likely until spring 2021 at the earliest, as it must meet challenges of mass production and distribution, including workable state programs. That is why deRitis calls 2021 “pre-vaccine.”
“The economic recovery won’t be a switch simply turned back on,” deRitis said. “Challenges will remain, prolonging our recovery into 2022 where we expect it to accelerate” in the third and fourth quarter.
The K-shaped recovery
Construction employment weathered the pandemic, but it started ugly.
“Construction lost a million jobs in April, but unlike other industries, recovered very quickly,” deRitis said. “It has been a growth engine for many communities, a bright spot. A good number of jobs, though, have not returned. We see a K-shaped recovery for U.S. builders” (see Figure 8). In an asymmetrical K-shaped recovery, some sectors grow (the upward-sloping line in the letter K), while others contract (the downward-sloping line). Single-family homes, private healthcare and warehouses are trending upward. Most other nonresidential—including private education, infrastructure and hospitality—is sloping downward.
DeRitis surmised some hard-hit geographic areas dependent on recreation and hotel income—think Las Vegas or Orlando—may be the first to rebound during a post-vaccine period.
Government employment is a different story, deRitis said.
“Local and state governments have laid off teachers, first responders and other employees. Some states have been better prepared than others with reserves and rainy-day funds. The risk for further cuts is possible if no federal helps arrives. Finances need to be shored up,” deRitis said.
One of the buoys during the pandemic has been consumers retaining household income, helped by the federal Coronavirus Aid, Relief, and Economic Security (CARES) Act, a $2.2 trillion stimulus signed into law on March 27, 2020.
“It was essential,” deRitis said. “Wage and salary income plummeted in March and April 2020. Because of the CARES Act’s stimulus checks and unemployment enhancements, total disposable income grew. Households were able to stretch their stimulus funds into October.” The stimulus bill passed in December 2020 may offer a similar boost.
As of November 2020, the United States was 10 million jobs short compared to January 2020 (see Figures 9 and 10).
“We are moving in the right direction, but job growth is slowing. Labor force participation has fallen, too,” deRitis said. “It needs to grow for graduates, new immigrants and those who left the employment market, estimated at 4 million. The majority have been women who had to make difficult choices having to care for children who were now at home due to closed daycares or schools. So when you look at October 2020’s unemployment rate of 6.8%, it really is closer to 8.9% when you factor in people who had to leave the market.”
Upside and downside risks
The Federal Reserve has set interest rates near zero through 2023, even if inflation creeps up to 2%.
“Expect inflation sooner than anticipated if economic growth really accelerates based on a successful vaccine,” deRitis said. “Demand for houses has remained high—as have prices, which have accelerated. There is some housing growth opportunity with migration out of heavy population centers. Another plus: mortgage default risk is low” (see Figure 11).
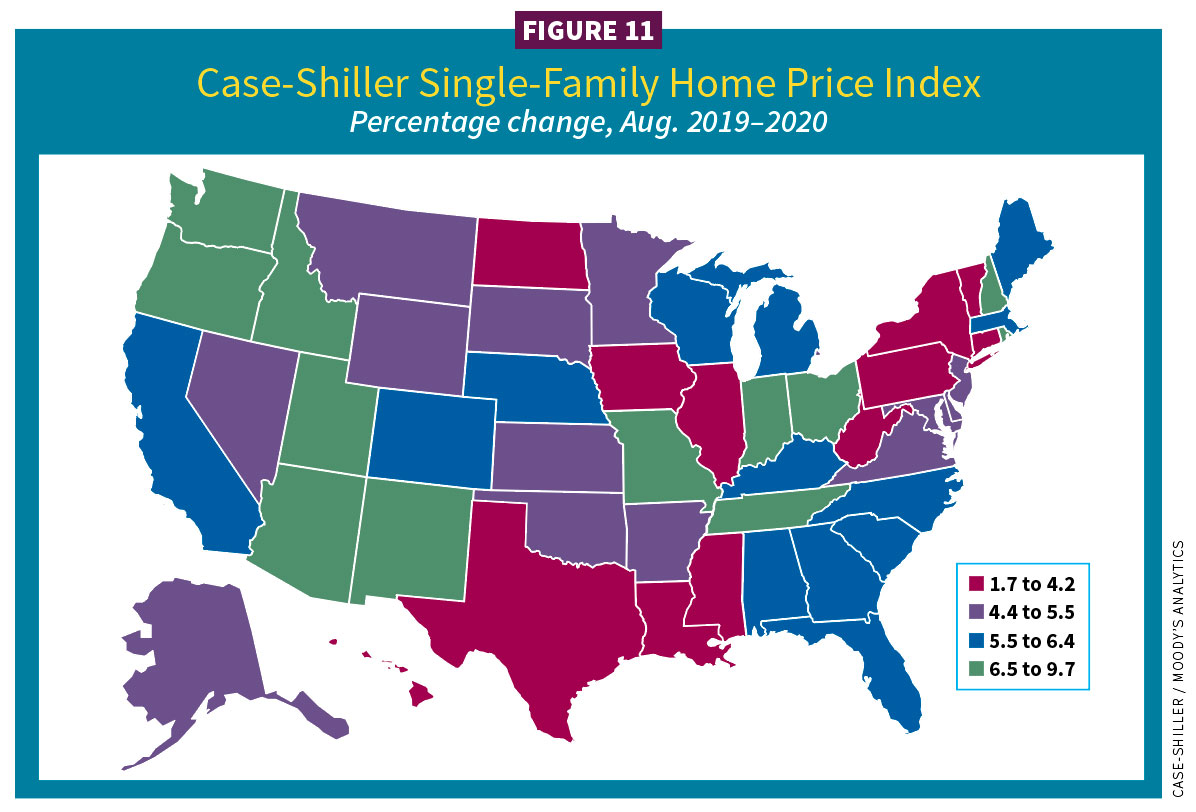
The pandemic spurred many to move to less dense city centers. The fastest growth is in Arizona, while the slowest is in West Virginia. Home prices rose an average is 5.7%.
According to Branch, there was a 4% decrease in residential units in large metropolitan areas through September 2020 compared to the same period in 2019. A large metro area is defined as a county with a population of more than a million and a central city. At the same time, there has been a 4% increase in housing construction in large fringe metro areas (same population, no central city). In medium metro areas with a county population of 250,000–999,000, there was an 8% increase from 2019. Construction increased 10% in small metro areas with a county population of less than 250,000.
AGC’s Simonson said, “Retail follows rooftops.” Commercial growth relates to residential moves.
“I do see a slowdown in commercial real estate prices,” deRitis added. “Demand for office spaces will diminish. This will be an evolution. It’s not the death of major cities but growth in second-tier cities. Industrial spaces will be more robust, as will more online shopping.”
DeRitis also saw a potential for an entrepreneurship revival in the United States.
“New business applications are at an all-time high,” he said.
Indeed, the U.S. Census Bureau’s Business Formation Statistics shows U.S. business applications soaring in 2020 (80,820), a 30.6% increase from 2019’s 8.9%.
Starts information is supplied by Dodge Data & Analytics (cited first), followed by ConstructConnect unless otherwise noted. Due to some differing market categorization between the two forecasts, performance numbers can differ. We try to reconcile those differences or cite them when they occur.
RESIDENTIAL
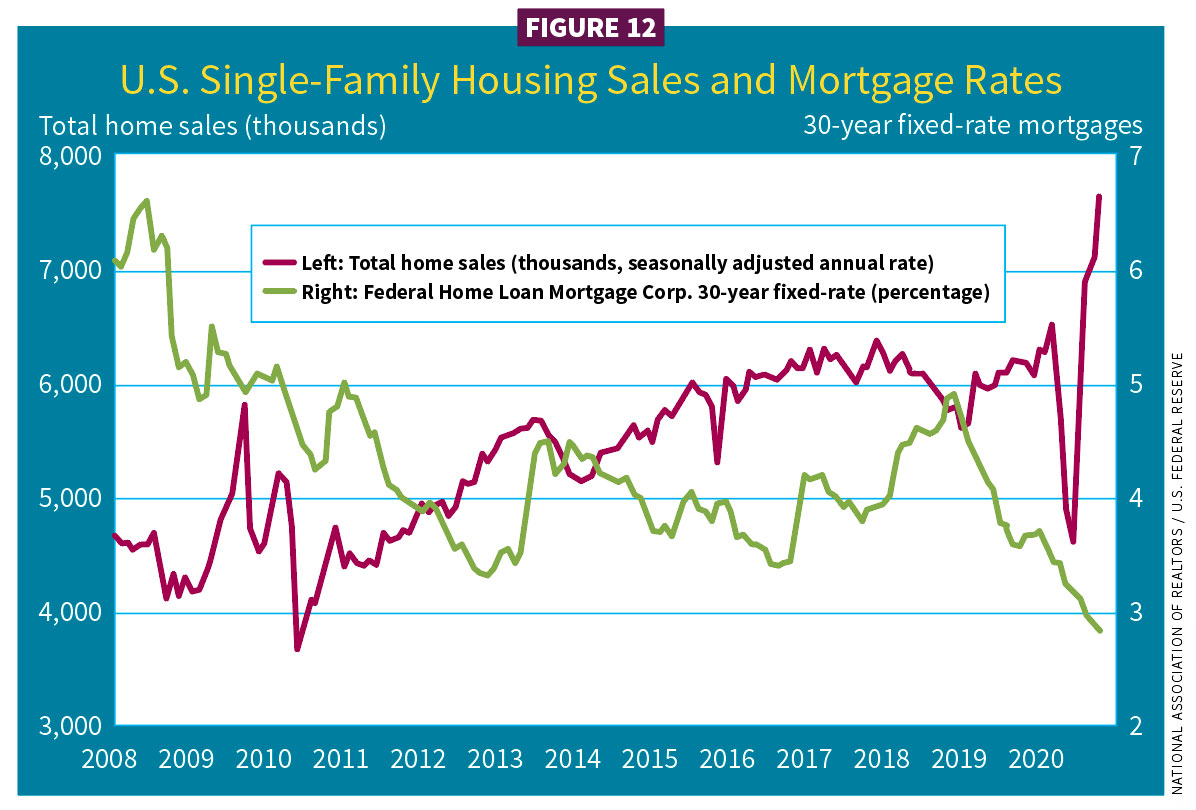
Total home sales and starts are showing a V-shaped recovery. More than a million broke ground in the third quarter of 2020, the best quarter since 2006 (see Figure 12). The top reason for the housing market’s strength is historically low interest rates. Millennials, once resistant to home purchases, and those over 55 are taking advantage of these low rates. First-time buyers bought about one-third of all homes.
In 2020, a weaker multifamily sector did pull down total residential by 2% ($325 billion/1,371 million units). ConstructConnect saw a loss of 6.7% ($277 billion). This year, total residential will grow: Dodge estimates at least a 6% gain ($339 billion/1,412 million units) and ConstructConnect projects a 7.2% gain ($297 billion).
Single-family
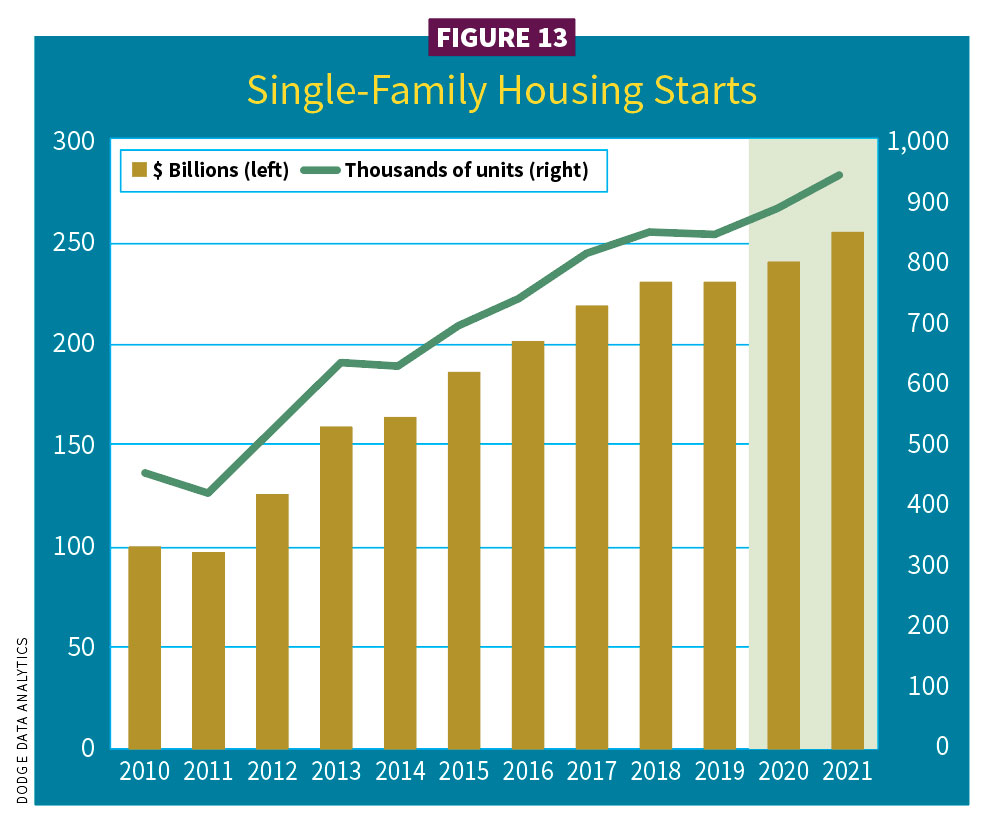
An unexpected strength has taken hold in this sector. In 2020, single-family housing starts increased an estimated 4% ($239 billion); ConstructConnect ($204 billion). Volume increased 5% (876,000 units). The National Association of Home Builders (NAHB), Washington, D.C., put numbers higher (986,000 units). In 2021, expect 7% ($254 billion); ConstructConnect ($297 billion). Volume increases 6% (928,000 units) (see Figure 13).
According to the NAHB/Wells Fargo Housing Market Index, builder confidence in the market for newly built single-family homes increased five points to 90 in November 2020, breaking an all-time high of 85 in October.
Fannie Mae reported 30-year conventional fixed-rate mortgages stood at 2.83% in October 2020—the lowest in more than 50 years. NAHB expects fixed rates to average 3.13% in 2021.
Multifamily
Multifamily construction was a driving force that led residential through the Great Recession. Though still a major player, employment losses and high unemployment rates have depressed demand for rental apartments. Dodge expected 2020–2021 multifamily starts to decline by 14% ($86 billion); ConstructConnect predicted $73 billion (see Figure 14).
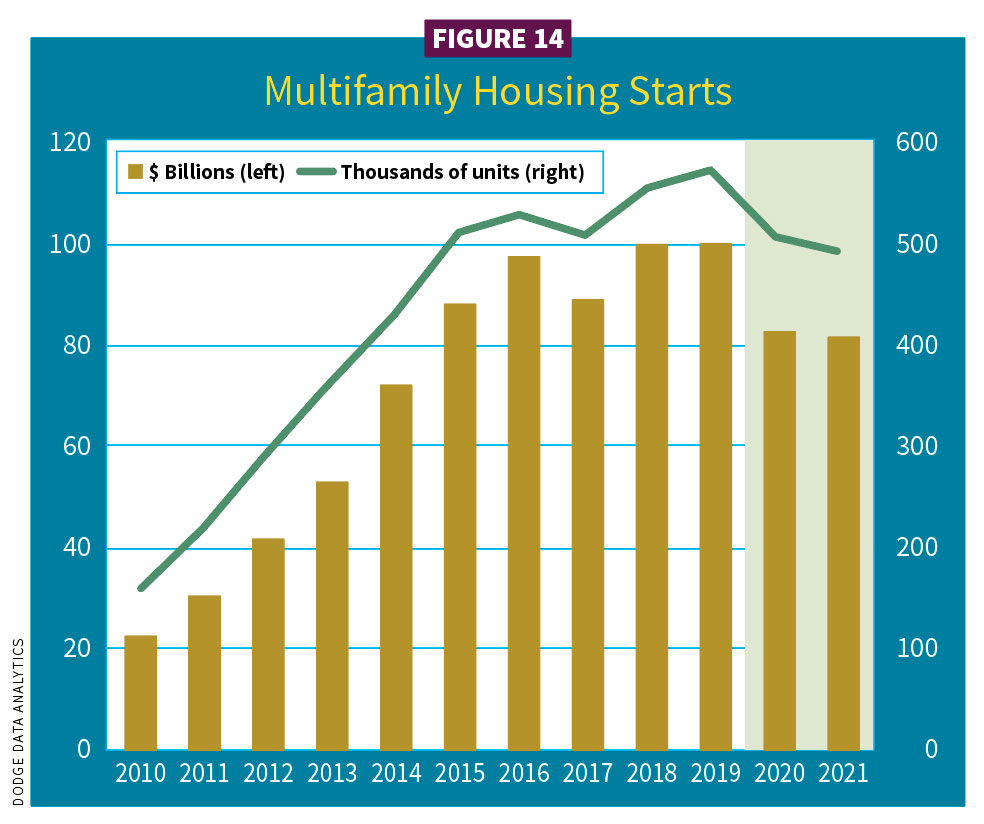
Volume dropped 12% (496,000); NAHB (388,000). Some improvement in 2021 is expected, as starts should drop by only 1% ($85 billion); ConstructConnect calls for $79 billion. Multifamily volume will drop 2% (484,000); NAHB with 335,000. A decline in multifamily is expected in major urban areas with growth opportunities in smaller population areas.
CB Richard Ellis-Econometric Advisors (CBRE-EA), Dallas, reported that rental vacancy rates for professionally managed apartment buildings rose in 2020, but were expected to peak at 6.3% and then decline through 2021.
New York City remained a center for multifamily construction, representing six of the largest 10 projects in 2020. The largest is a $478 million apartment portion of a mixed-use project located at 101 Lincoln Ave. in the Bronx. A close second was the $471.6 million apartment piece of the Pacific Park mixed-use development in Prospect Heights.
COMMERCIAL
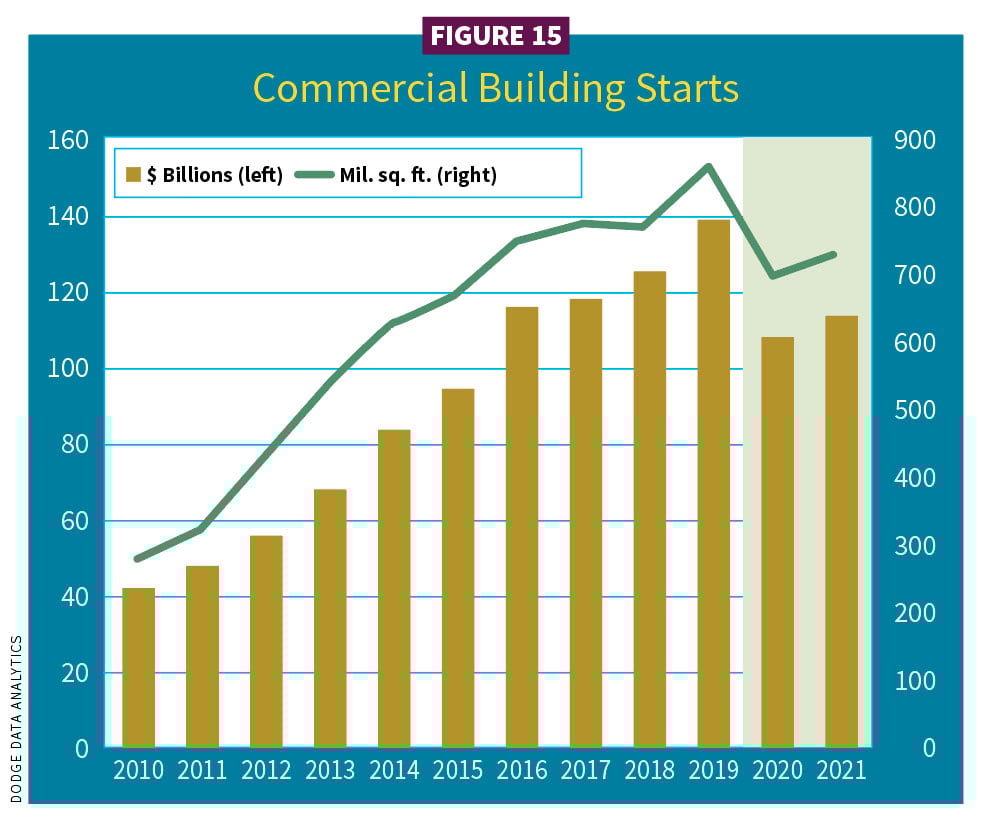
The pandemic struck commercial construction fast. Adding up the damage in 2020, starts fell 23% ($107 billion) and volume 19%, or 690 million square feet (msf). ConstructConnect, using a different mix of subsectors than Dodge (private offices, parking garages and transportation terminals), saw commercial performance fall 46.9% ($26.7 billion). Commercial project planning gained some momentum last summer (2020). Though it will be a slow return extending past 2021, starts should advance 5%, ($133 billion/722 msf) (see Figure 15). ConstructConnect sees a gain of 21.3% ($34.4 billion).
Stores and shopping centers
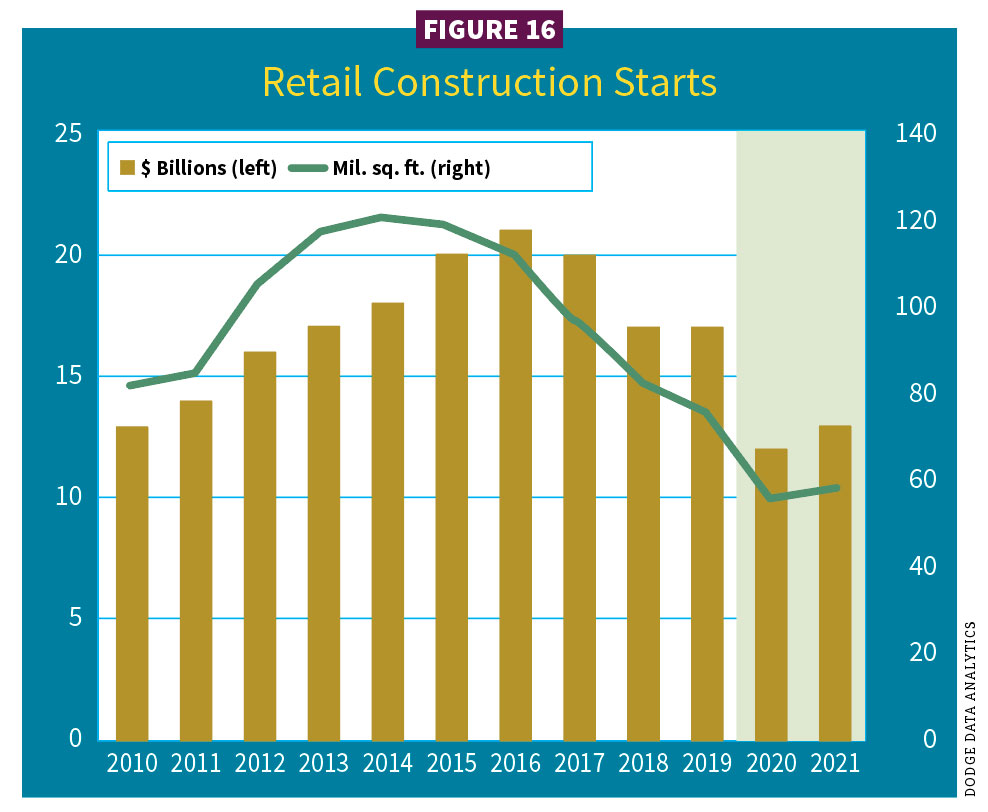
The COVID-19 outbreak and shutdowns have not been kind to retail, which was already a soft subsector. You were in luck if deemed an essential business, such as a grocery store, pharmacy or hardware store. In many places, liquor stores stayed open, too. Clothing and other types of stores, however, were considered nonessential. Retail starts in 2020 declined 25% ($12 billion)/28% (55 msf). That square footage was almost one-third below levels during the Great Recession. ConstructConnect’s retail category (hotels, retail miscellaneous and shopping) declined 41.0% ($28.1 billion). This year, retail should add 7% ($13 billion)/5% volume (58 msf); ConstructConnect is at 20% ($33.7 billion) (see Figure 16).
Business Insider reported a record 9,300 retail stores closed in 2019. In the first eight months of 2020, 66 brands closed 13,262 stores, already surpassing 2019 closures. Bankruptcies have included Brooks Brothers, Gold’s Gym, J.Crew, JCPenney, Lord & Taylor, Modell’s Sporting Goods, Neiman Marcus, Pier 1 and others.
What COVID-19 took away in foot traffic, it gave in online shopping. E-commerce jumped 44.5% year-to-year in the second quarter of 2020. That represented $211.5 billion in business, the strongest growth in the 20 years Dodge has measured e-commerce. In a bright spot for brick and mortar, store renovation jumped a record 51% during the first nine months of 2020.
For construction starts, Walmart remains the leader, though its 2020 starts (first nine months) decreased 15% to $783 million. Of those, 12 were new construction or additions. The remainder were store renovations ($500,000 per project). Only one new store was 100,000 square feet. Retail chains such as Aldi, Costco, Dollar General, McDonald’s and Target were players too, but overall expansion activity declined from 2019. In the first nine months of 2020, the 10 top retailers’ construction starts in aggregate dropped 15% to $1.875 billion.
Warehouses
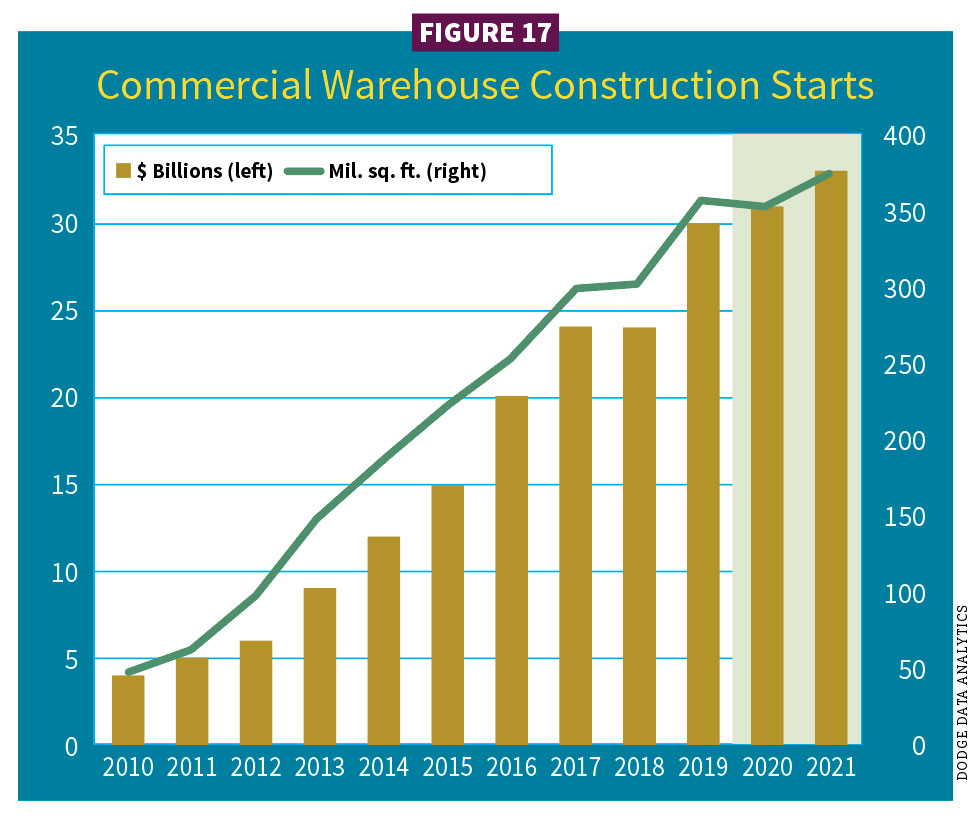
Warehouses are essential to e-commerce. For Dodge, it represents the largest nonresidential sector to track (see Figure 17). Last year, a pullback was expected, but COVID-19 flipped the script. Branch expects a healthy expansion in this sector to continue. In 2020, it captured a 2% gain ($31 billion)/–1% in square footage (352 msf); ConstructConnect is at $21.9 billion. This year, look for a gain of 8% ($33 billion)/6% (373 msf); ConstructConnect ($23.2 billion). As warehouses advance technologically, their square footage is increasing.
“Amazon continues to build huge logistics centers while taking over vacant big box spaces and turning them into distribution spaces for the ‘last mile’ of delivery,” Branch said. “Some of this activity is captured in renovation numbers.”
Some of the bigger projects to break ground were Amazon’s Project Sophia (3.884 msf) in Wilmington, Del.; Project Charm (3.842 msf) in Pflugerville, Texas; and a 3.7-msf distribution center in Windsor, Conn. Other major warehouse projects were driven by Apple, Facebook, Google and others.
Office buildings
COVID-19 has brought a shift in where we “office.” Many workers are untethered from an office building. CBRE-EA reported the office-vacancy rate in the second quarter of 2020 rose to 13%. AIA’s Baker quoted a survey by the Conference Board of 300 human resource representatives that said, post-pandemic, a third of companies expect at least 40% of their employees to primarily work virtually. Additionally, companies are more willing to hire remote workers, even internationally (see Figure 18).
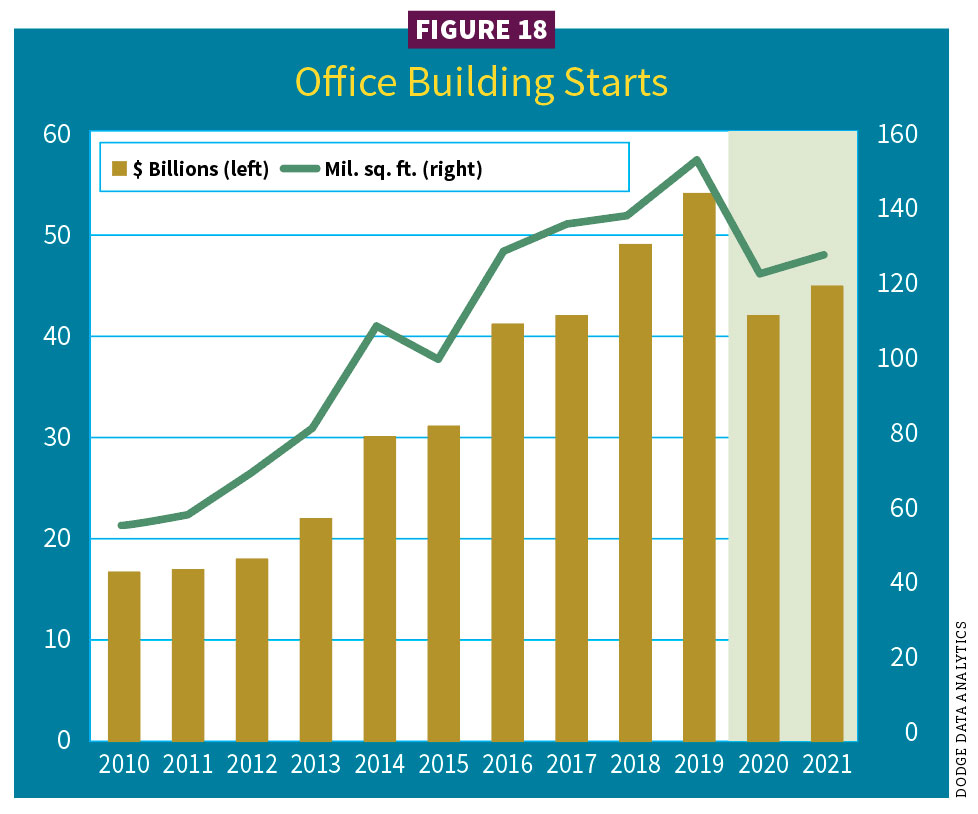
Total 2020 office starts were expected to fall 22% ($42 billion)/–20% (122 msf); ConstructConnect predicts $20.7 billion. The picture for 2021 shows a gain of 5% ($45 billion)/4% (127 msf); ConstructConnect: $23.5 billion.
Data centers (10% of office construction in 2020) and some major office projects will help support this commercial subsector in 2021. The renovation market for overall office space will also be a driver. It currently represents 33% of the office market. Post-COVID office work may include reconfiguring spaces and HVAC systems.
Major projects expected in 2021 include the Downtown West Google Project at Diridon Station in San Jose, Calif. ($2 billion); the JP Morgan Chase building in New York City ($1.5 billion); and the VAST Data Center in West Jordan, Utah ($200 million).
Hotels and motels
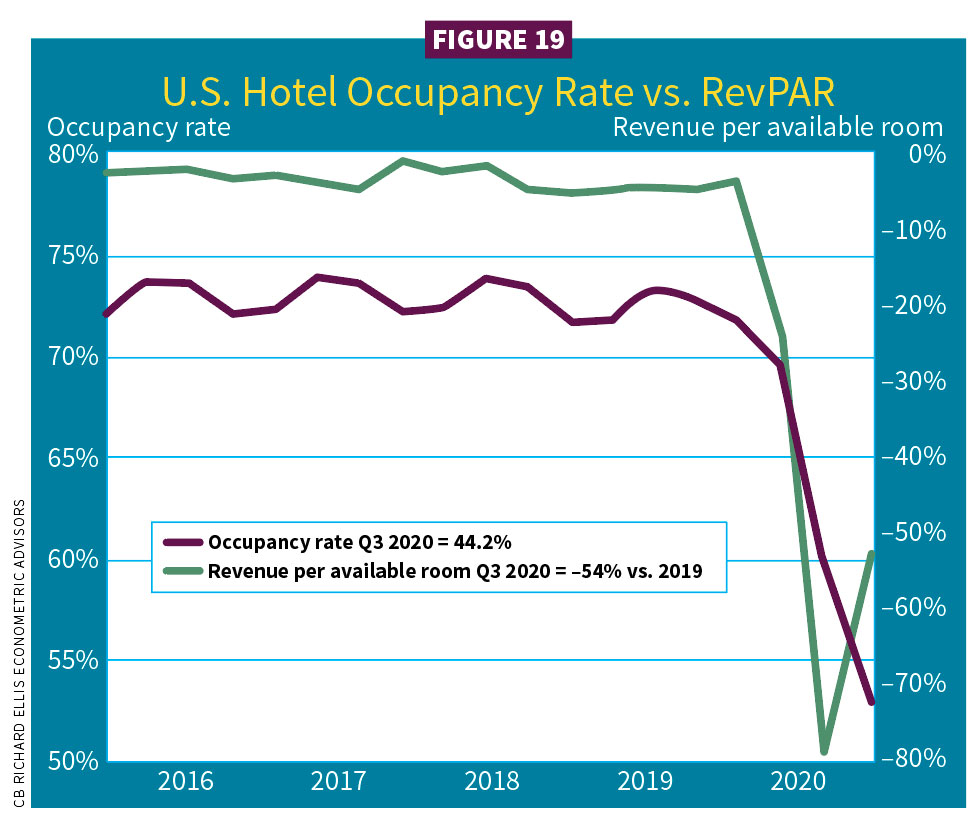
By second quarter 2020, hotel occupancy rates fell 28.3% and year-over-year revenue plunged 75%. Grim performance numbers for 2020 showed an expected drop of 46% ($10 billion/39 msf); ConstructConnect ($10.1 billion). Looking to this year, expect less decline at 7% ($9 billion)/–4% (37 msf); ConstructConnect ($12.3 billion).
Business data website Statista reported that the monthly average U.S. lodging industry revenue per available room (RevPAR) in September 2020 was $47.87 for U.S. hotels, down from $131.21 in 2019 (see Figure 19).
Noteworthy 2020 projects included the Hyatt Regency Hotel in Salt Lake City ($377 million) and the Fig + Pico AC Marriott in Los Angeles ($355 million).
INSTITUTIONAL
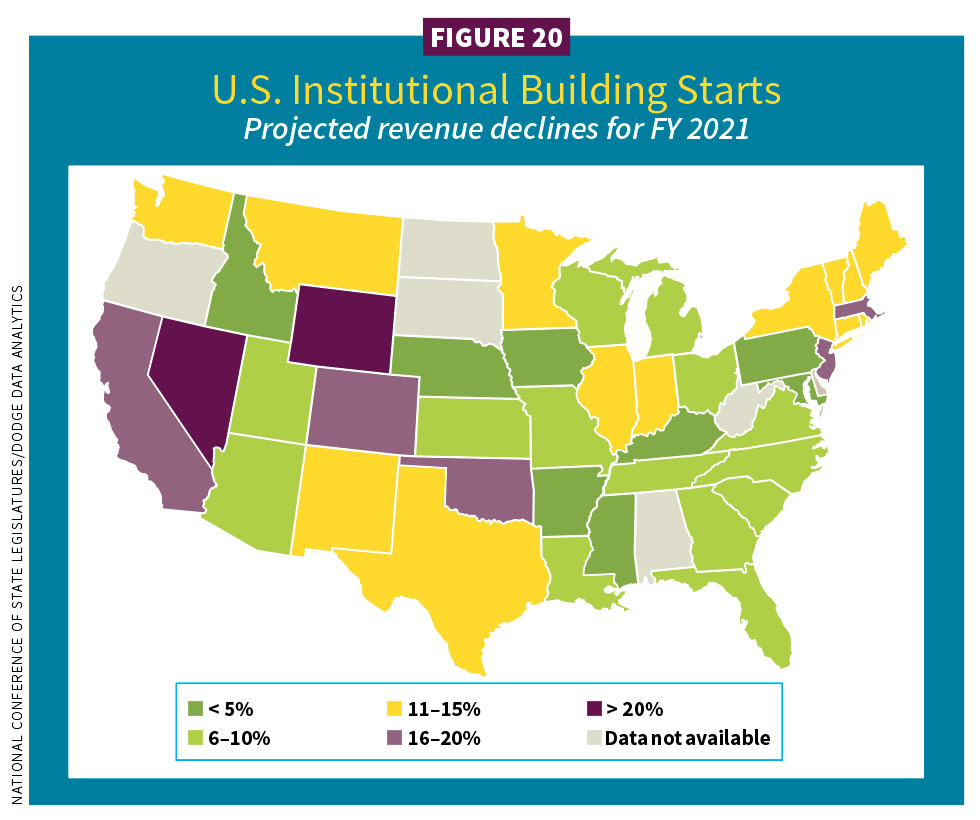
Public funding plays a role in the institutional construction market. As such, economic forces tend to lag by a year or two. Not this time. In 2020, institutional starts dropped 18% ($116 billion)/–19% (272 msf). Nothing was spared from education, healthcare or transportation. This year, some sectors may decline less drastically, while others gain. In 2021, institutional is expected to grow 1% ($117 billion)/-1% (269 msf) (see Figure 20). ConstructConnect projections for this sector are harder to neatly quantify alongside Dodge. Its estimates are addressed below within related Dodge subsectors.
Education buildings
States and communities responding to COVID-19 have faced 2020 budgetary shortfalls and lower tax revenue. The largest share of education starts—colleges and universities—has been struck the hardest.
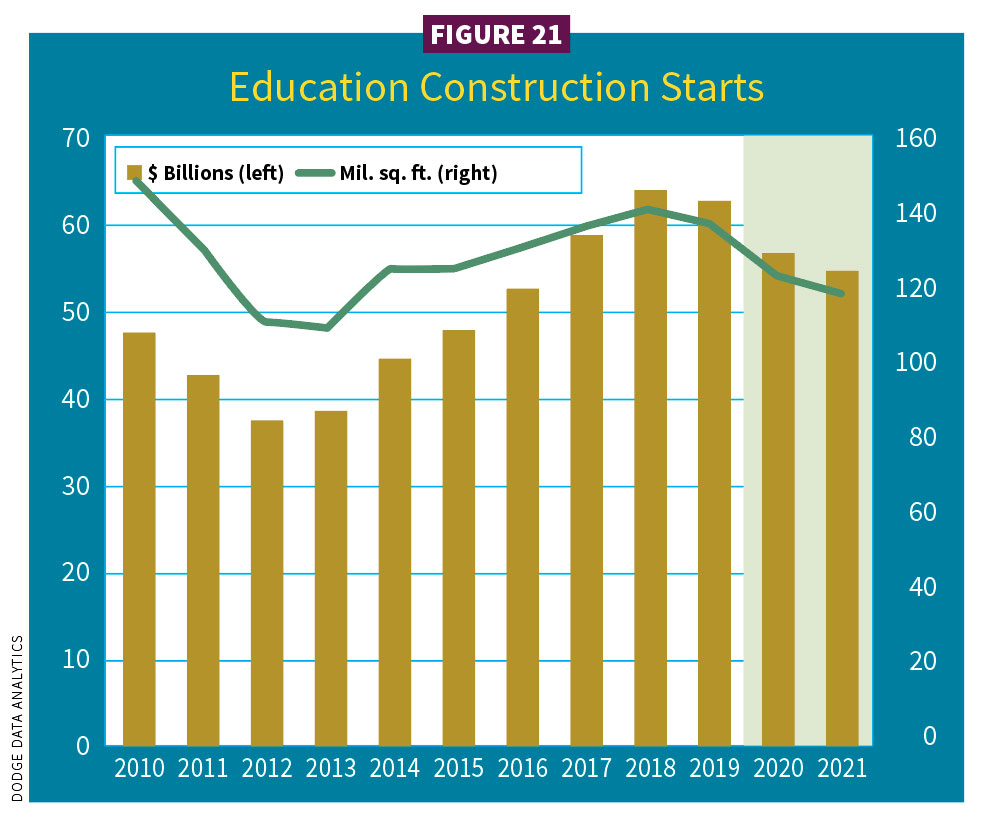
Another chill extended through public libraries and museums. In 2020, construction starts shrank 10% in dollars, –11% (124 msf); ConstructConnect estimated a contraction of 12.4% ($66.4 billion).
Starts for 2021 stand to slip another 3% ($55 billion/120 msf); ConstructConnect is expecting a gain of 8.7% ($72.2 billion) (see Figure 21).
Recent years of successful major bond measures continue to provide a pipeline for projects. The larger the school districts, the bigger the bond measures. In California, 90% of bonds were passed in the November 2018 election ($17 billion). No bond measures were put forward in 2019. The state’s 2020 Proposition 13 did fail, the first education-related bond rejected in that state since 1994. It was a proposed $15 billion renovation effort for aging schools and college facilities. Meanwhile, Texas successfully passed several bonds in 2019 ($14.5 billion).
Endowments for private colleges and universities bounced back to a strong 10-year return of 8.4%, a target for long-term planning. How endowments are spent is shifting, however, with fewer dollars allocated for construction. According to the National Association of College and University Business Officers, endowments directed to campus facilities, including new construction, only represented 7%.
Adding to headwinds is decreasing state financial support for public colleges and emptier campuses caused by pandemic-driven remote learning. Branch said that 43% of institutions are feeling liquidity constraints, which will be felt in 2021. The National Center for Education Statistics (NCES) sees college enrollments remaining flat through 2024.
For K-12, the NCES recently projected that enrollments will slow over the next five years, suggesting only modest construction gains. It is also unclear when students will physically return to classrooms. There are some positives that could drive construction in K-12, however.
“The average age of the elementary school building is often 50 years old,” Branch said. “Replacement construction could buoy this sector. We are seeing such activity in the Midwest and Northwest, as two examples.”
Healthcare buildings
The year 2020 started well for healthcare construction. Large hospital starts in the first quarter of 2020 were 34% higher than year-over-year in 2019. Then the pandemic arrived, and the world changed for healthcare (and for everything else). The CARES Act provided some relief but could not shield layoffs. COVID sidelined elective procedures as the public held off.
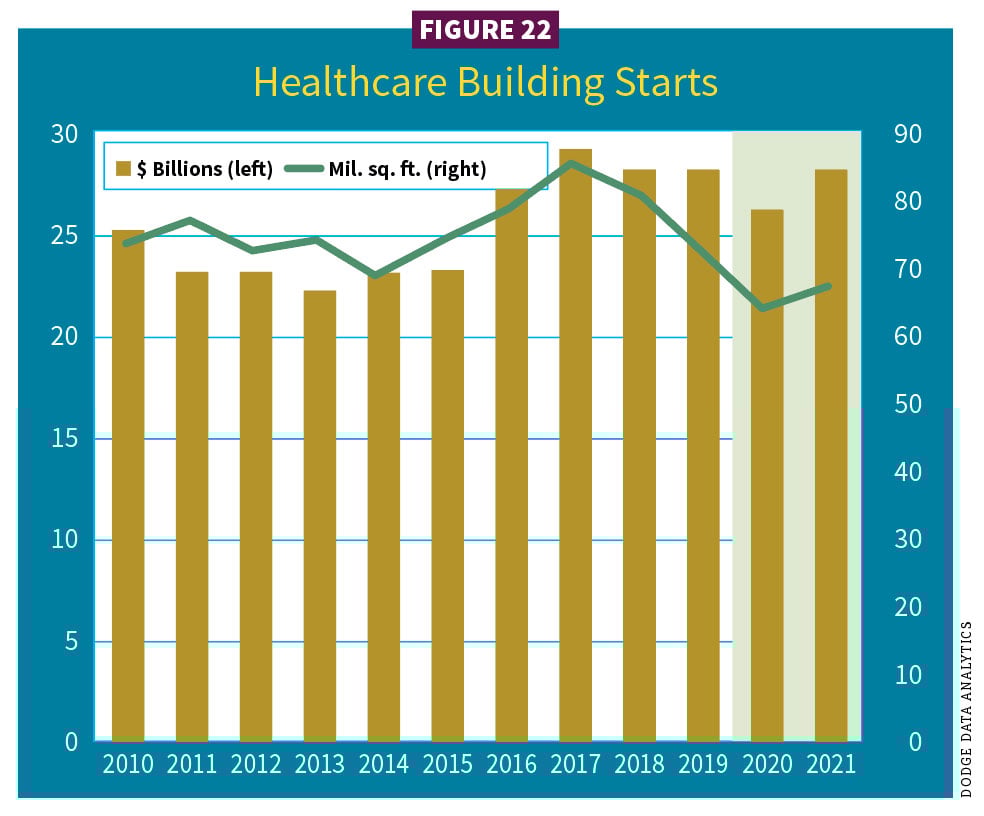
In 2020, starts were projected to lose 9% ($26 billion)/–15% (62 msf); ConstructConnect projected 31.6% ($27.3 billion). Positive forecasts for 2021 show 9% ($28 billion)/6% (66 msf); ConstructConnect at 30.7% ($35.7 billion). However, the future of the Affordable Care Act causes some uncertainty (see Figure 22).
Big projects included the Paramus, N.J., New Valley Hospital ($766 million) and the Mayo Clinic Arizona Forward Project, Phoenix ($546 million).
Transportation buildings
The transportation sector has enjoyed some recent good years. Big projects helped, including those at LaGuardia, Newark, Denver and Los Angeles international airports (see Figure 23). In 2020, COVID-19 reduced air traffic to a trickle. The Transportation Security Administration reported a 93.8% drop in screening numbers year-over-year March to April 2019-2020.

Branch does not see people traveling comfortably until COVID-19 inoculations are widely administered.
“Business travel is also severely diminished but not dead. At some point, [there will be] a pent-up demand for air travel after 2021,” he said.
Several construction projects were put on hold in 2020, including terminal renovations at JFK and San Francisco international airports. Dollar starts fell 24% ($9 billion)/-25% (23 msf). ConstructConnect put airport starts at $6.4 billion and transportation terminals at $3.8 billion. If JFK’s terminal project gets underway in 2021 and delayed projects return, projections are 11% ($10 billion)/2% (24 msf). ConstructConnect estimates $6.1 billion for airports and $6.2 billion for transportation terminals.
Recreation buildings
Recreation construction starts suffered in 2020. This market includes casinos, convention centers, gyms and enclosed sports arenas. ConstructConnect labels this sector “Community” and does not include campus athletic and student centers. Recreation in 2020 declined 38% ($12 billion)/–33% (30 msf); ConstructConnect anticipated a drop of 29% ($16.6 billion). For 2021, starts are expected to fall another 5% ($11 billion/29 msf); ConstructConnect expects a gain of 11.8% ($18.5 billion).
Big projects in 2020 included renovations of the Bankers Life Fieldhouse in Indianapolis ($270 million) and the Talking Stick Arena in Phoenix ($235 million).
Public buildings
The public buildings market (capitols, courthouses, police and fire stations and other public administrative facilities) began weak in 2020 and ended up even weaker by year’s end, thanks to the pandemic (see Figure 24). Tax revenues fell. Kroll Bond Ratings Agency, New York, projected losses of $690 billion for state and local governments. That included $370 billion for states, $117 billion for cities, $114 billion for counties and $24 billion for transit agencies. Moody’s Analytics estimates that state and local governments need to reduce their budgets by $400 billion for both the current fiscal year (which began in July 2020 for most areas) and the next fiscal year.
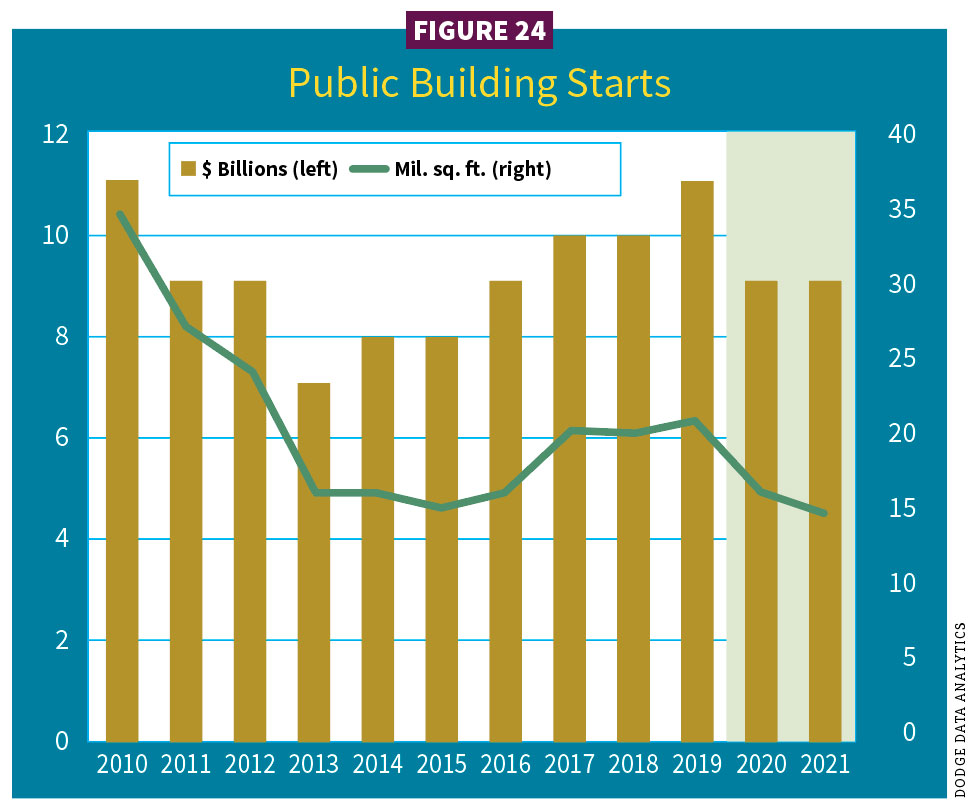
In 2020, starts fell 20% ($9 billion)/-23% (16 msf). ConstructConnect’s “Government” subsector lost only 4% ($18.4 billion).
In 2021, public buildings will contract 1% ($9 billion)/–5% (15 msf). ConstructConnect expects a gain of 7.5% ($19.7 billion).
Some 2020 projects were the Sacramento, Calif., Criminal Courthouse ($279 million); the Police Command Center at the World Trade Center renovation ($79 million), New York; and armory repairs from Hurricane Michael ($69 million), Panama City, Fla.
MANUFACTURING
In March and April 2020, manufacturing lost 1.4 million jobs, more than were created between 2011 through 2019. The Industrial Production Index reported output dropped 5% in March and another 16% in April. Plant capacity use sank to its lowest monthly reading in nearly 50 years (60%). This sector began to recover in the second half of 2020. By September, 716,000 jobs had returned. Nonetheless, overall starts declined 49% ($17 billion)/–18% in square footage (57 msf); ConstructConnect predicted $19.7 billion (see Figure 25).
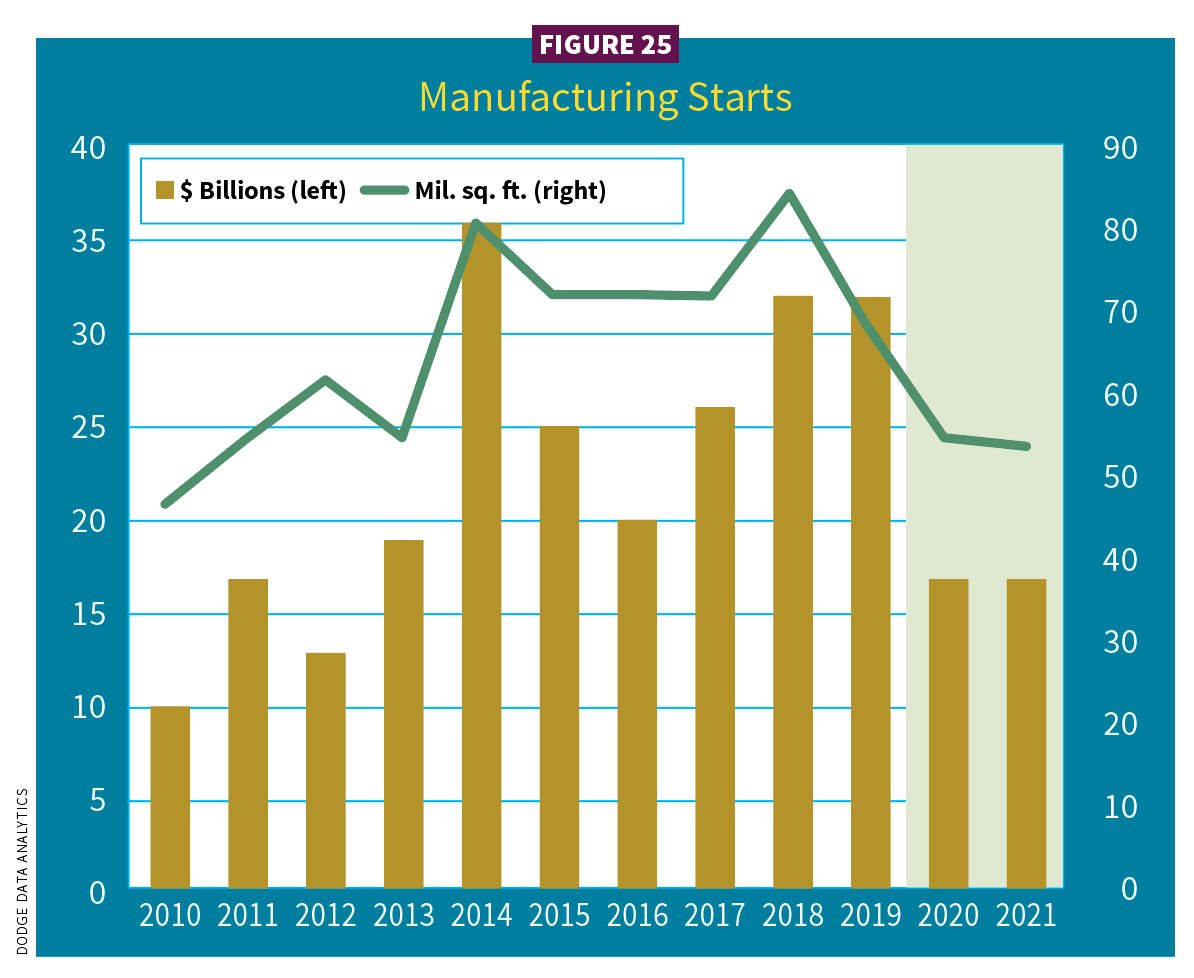
“In 2017, there were 25 mega project starts (projects $1 billion or more) adding to $54.9 billion,” said ConstructConnect’s Carrick. “In 2018, [there were] 20 such projects for $47.2 billion, and in 2019, 35 for $79.1 billion. From January through October [2020] only 10 mega projects broke ground, 66% less [$17 billion].”
Interestingly, square footage gained. In 2020, mega projects added 45.6 msf as projects shifted to battery and steel plants. Warehouse projects also heavily contributed.
No decline, but zero growth, is predicted in 2021 for manufacturing at $17 billion/–5% (54 msf); ConstructConnect predicts $22.6 billion.
Noted projects in 2020 included the Tesla Gigafactory in Austin, Texas (nearly $1 billion); Nikola Motor Hydrogen-Electric Truck Plant in Coolidge, Ariz. ($470 million); and the NGL Fractionator #4, a petrochemical plant in Mont Belview, Texas ($665 million).
NONBUILDING
All the experts expect to see increased infrastructure spending in 2021.
“It may be more of a stimulus measure rather than a massive package. Either way, it’s also a job creator,” Moody’s deRitis said.
Public works and power/utility construction is not as immediately impacted by the general economy’s performance. It is arguable to what degree COVID-19 changed this sector’s calculus, which is typically influenced by legislation and regulations (see Figure 26). Total nonbuilding starts in 2020 were expected to drop 18% ($173 billion). Captured under “Civil,” ConstructConnect estimated a decline of 15.7% ($159.6 billion).
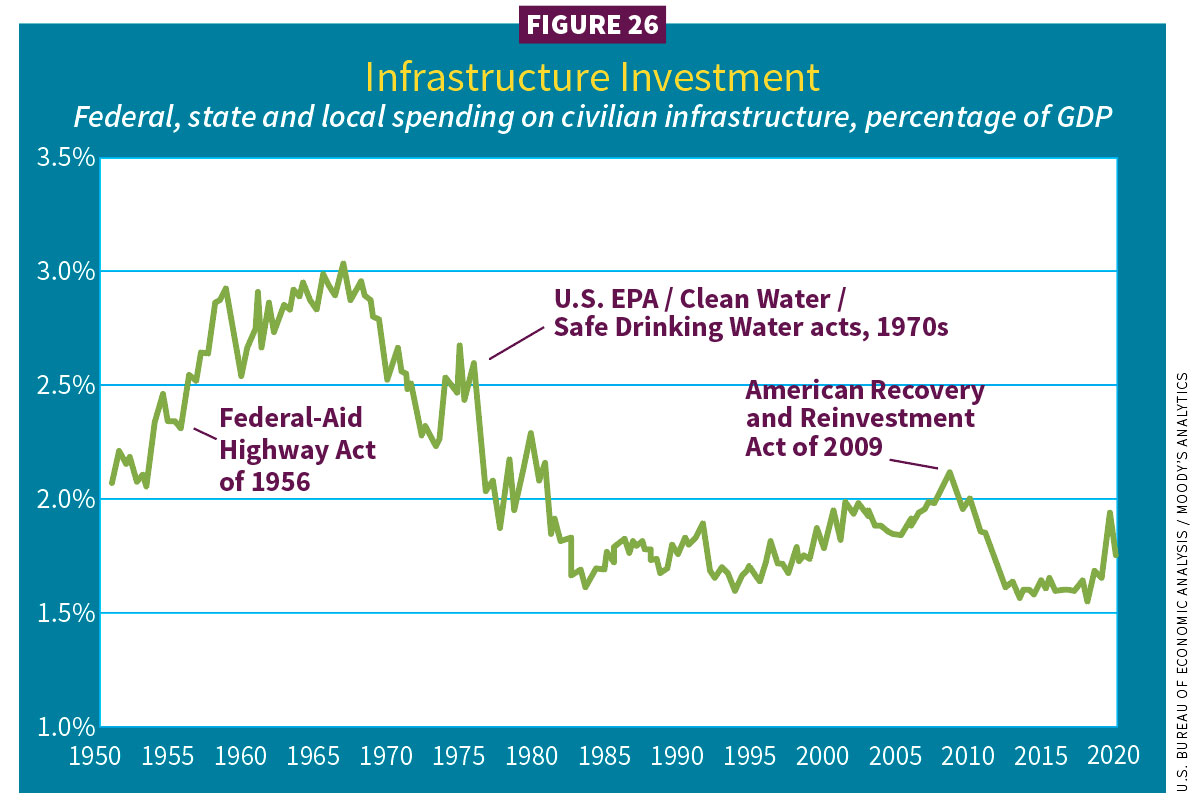
Within the sector, public works shrank 9% ($142 billion) due to softness in environmental (water) and pipeline construction. Starts for the electric power/utility subsector substantially declined.
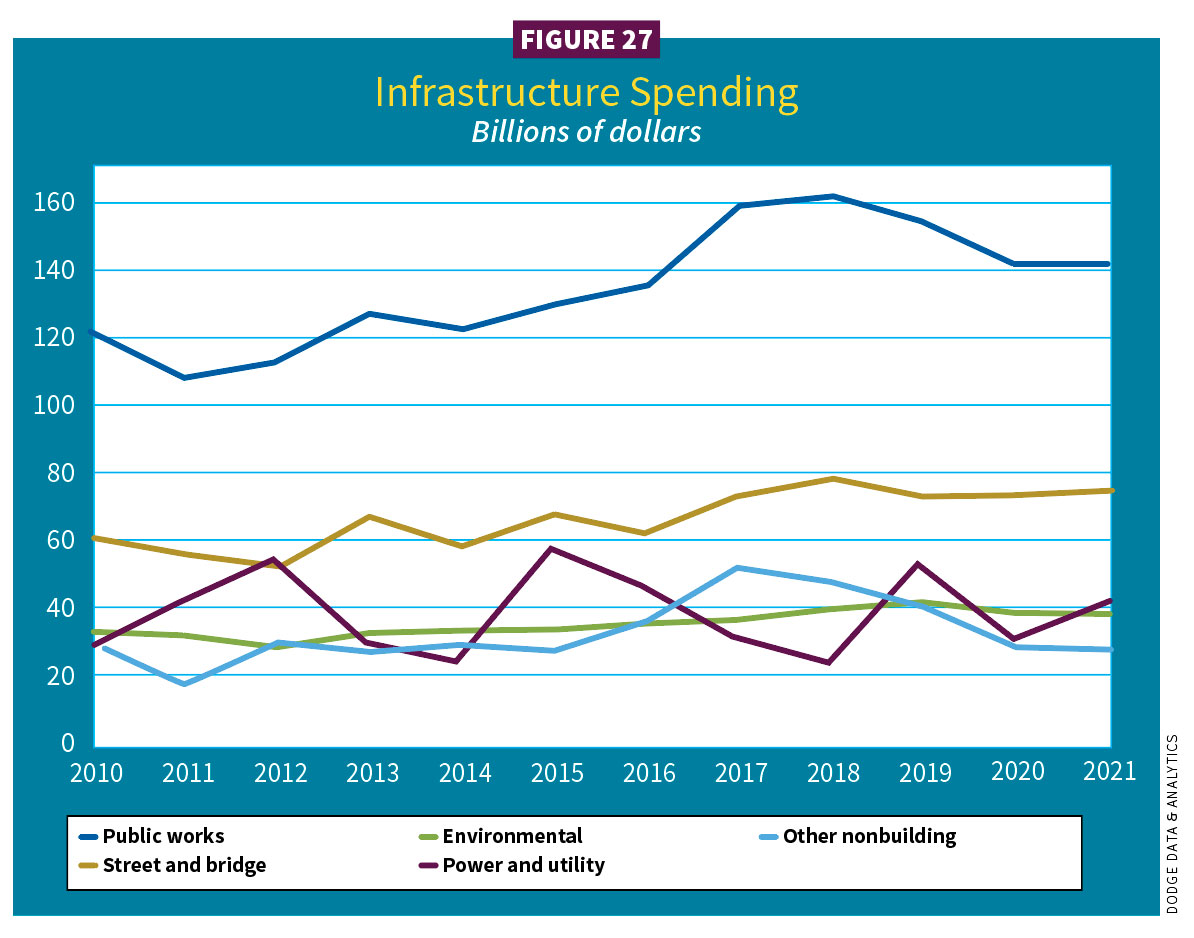
As expected, 2021 recovery for total infrastructure shows 7% ($184 billion), thanks to the power/utility market; ConstructConnect estimates 13.5% ($181.2 billion). Public works starts are expected to remain at 2020 levels ($142 billion) (see Figure 27).
Streets and bridges
The road was stable for streets and bridges in 2020, supported by FY2020 appropriations passed by Congress in December 2019. Funding for highway programs rose 2% ($46 billion) and BUILD grants (Better Utilizing Investments to Leverage Development) grew 11% ($1 billion).
In 2020, gains for this subsector were expected at 1% ($74 billion). That broke down to street/highway ($58 billion) and bridges ($16 billion). ConstructConnect estimated roads ($63.3 billion) and bridges ($23.4 billion). This year, these markets should gain another 1% ($75 billion) with streets/highways decreasing to $58 billion and bridges increasing to $17 billion. ConstructConnect estimated roads at $69.9 billion and bridges at $27.1 billion.
The FAST Act expired Sept. 30, 2020. Rather than being reauthorized, Congress added a one-year extension. In addition, $13.6 billion was transferred from the general fund to the federal Highway Trust Fund to keep it solvent, as less driving during the shutdown meant less gas tax revenue. The first seven months of 2020 showed vehicle miles traveled dropping 15.7%, or nearly 300,000 miles.
Environmental public works
For the past decade, federal appropriations for environmental construction often relied on continuing resolutions for short-term, stop-gap funding. In 2020, starts retreated 8% ($39 billion). Within that, water supply projects fell 15% ($12 billion). Dams and flood control projects declined 13% ($12 billion). Sewers and wastewater projects increased 4% ($15 billion). ConstructConnect captured dams/canals/marine work at $7.2 billion and water and sewage treatment at $33.6 billion. This year, environmental public works should increase 1% ($38 billion); ConstructConnect’s dams/canals/marine ($8.2 billion) and water and sewage treatment ($35.3 billion).
In fiscal year 2020, the U.S. Environmental Protection Agency (EPA) budget increased 2% ($9 billion), helping allocate $1.6 billion to Clean Water State Revolving Funds (SRFs) loans, including $1.1 billion for a drinking water SRF. The U.S. Army Corp of Engineers (U.S. ACE) also saw a funding increase ($7.65 billion).
Federal help to remediate flooding and other damage from increasing natural disasters has also helped drive project work. The reauthorized Water Resources Development Act has provided $3.7 billion for U.S. ACE to use in dredging, flood control and other projects.
The bigger projects in 2020 included a biosolids digester ($1.3 billion) in San Francisco; the Kapalama Canal container terminal wharf and dredging project at Honolulu Harbor ($390 million); and the Thornton, Colo., water project ($200 million).
Power and utilities
It was not a good year for electric power and utilities. In 2020, starts for this subsector fell 43% ($31 billion), which especially hurt following a 123% gain in 2019. ConstructConnect has a subsector called “Power Infrastructure,” capturing 2020 starts at $3.7 billion. The acute decline in energy prices contributed to power and utilities’ poor 2020 performance.
Fortunately, things will look different in 2021, as this subsector expects growth of 35% ($42 billion), while ConstructConnect’s power infrastructure is at $10 billion. Dodge sees 2021 growth tied to work starting on several large liquefied natural gas plants. Fifteen such projects have been approved by the Federal Energy Regulatory Commission, but work has not begun.
Big projects in 2020 included natural gas-fired power plants. Of note were the Indeck Niles (Mich.) Energy Center ($980 million) and the Dania Beach, Fla., Clean Energy Center ($888 million). The Jordan Creek Wind Project ($600 million) in Williamsport, Ind., was the largest renewable-energy project. In Oct. 2020, the American Wind Energy Association, Washington, D.C., reported total U.S. capacity at nearly 112,000 megawatts.
Other nonbuilding
This subsector includes pipelines, rail lines and roofless large sports venues. In 2019, much of this subsector performed well, but a dearth of pipeline construction has taken it down. Last year, nonbuilding starts declined 29% ($29 billion). This hit an activity low not seen since 2015. ConstructConnect’s “All Other Civil” subsector saw starts drop to $27.7 billion. In 2021, expect a smaller decline of 3% ($28 billion); ConstructConnect advances to $24.3 billion.
Pipeline work will stay weak as oil prices remain low. Notable work in 2020 included the Whistler Natural Gas Pipeline ($1 billion) running through Texas to the Gulf of Mexico.
Other noteworthy projects in 2020 included the $1.3 billion light rail Federal Way Link Extension near Seattle.
Summary
At the outset of the Dodge 2021 forecast webinar, company CEO Daniel McCarthy really captured in his comments how to navigate this year.
“One of the enduring lessons of leadership is that we must make decisions, regardless of circumstances,” he said. “We have to do our best to gather information, get good insights, gauge the risks and rewards and commit to a path,” he said.
In these strange and challenging times, assess the landscape when atop the roller coaster. Glean what you can and then hold on—the drops may be short and quick. Here’s to a less wild ride in 2021.
About The Author

GAVIN, Gavo Communications, is a LEED Green Associate providing marketing services for the energy, construction and urban planning industries. He can be reached at [email protected].