
In May 2026, the Consumer Price Index rose 4.2% from May 2025. This represented the largest 12-month increase since April 2023 (4.9%). The effects of the abrupt rise in energy costs caused by the Iran war played a major role. What hangs over the economy is whether this will be one weight on the scale too many for U.S. consumers. As of this writing, a memorandum of understanding has been signed by both countries and, even if the conflict is resolved, the rise in energy costs and materials may take the rest of the year to reconcile.
In this 2026 midyear outlook, the grip of economic anxiety remains. What was previously confined to actions coming out of Washington now expands to the global effects of the Iran war. For construction, however, these headwinds have not spelled disaster. Megaprojects abound, although they do mask tamped down activity elsewhere.
With some exceptions, total overall performance could best be described somewhere between middling to good. In April, the construction industry grew 9% at a seasonally adjusted annual rate of $1.33 trillion following a March 13% rebound in total construction starts, according to Dodge Construction Network, Boston.
Drilling down, nonresidential building starts grew by 18.6% ($550 billion). Manufacturing decreased 29.3%, but did so from a remarkable March that saw 251.4% growth. Commercial starts rose 41.4%, driven by data centers and noteworthy growth of parking garages (120.4%), warehouses (25.0%) and hotels (12.5%). Nonbuilding starts rebounded by $395 billion (7%) over the month, showing double-digit gains in miscellaneous nonbuilding (18.1%), highways and bridges (17%) and environmental public works (16.3%). The electric power/utilities segment was down 9.7%, but a mix of large natural gas facilities and renewable projects grew construction starts to 62% growth year-over-year (y/y) in April. See Figure 1.
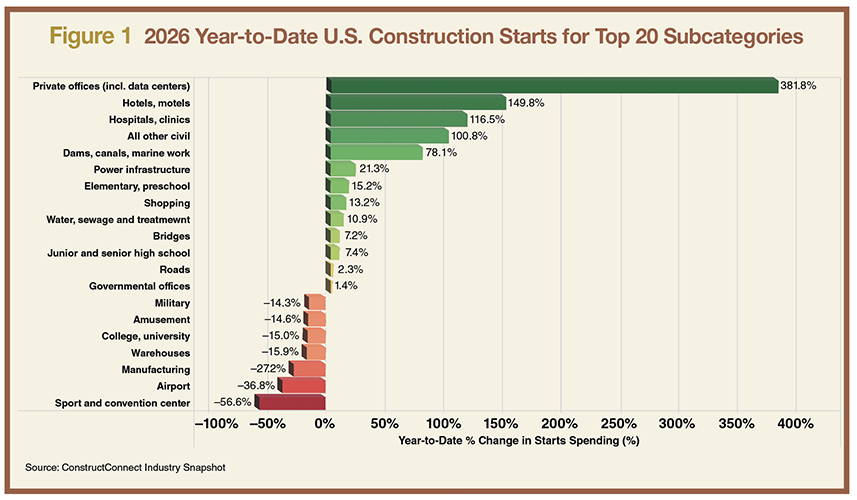
Figure 1
On a y/y basis (April 2025–April 2026), Dodge reported total construction starts up 8.1%. Residential starts contracted 4.4%, nonresidential starts rose 10% and nonbuilding grew 19.5%.
“April’s construction starts were robust, with only three categories posting month-over-month losses,” said Eric Gaus, chief economist at Dodge Construction Network. “Large data centers and energy generation supported the growth, but 9 of the 15 categories saw double- or triple-digit growth.”
May’s Dodge Momentum Index (DMI) rose 5.9% to 275.7 (2000=100) from a downwardly revised April reading of 260.4. Over May, commercial planning expanded 6.9% and institutional planning momentum grew 3.1%.
“Nonresidential planning continued to stabilize throughout May,” said Sarah Martin, director of economic research at Dodge. “Growth in the DMI continued to be led by data center activity, but key sectors—such as healthcare, retail stores and offices—gained momentum as well. Nonetheless, the broader outlook remains cautious, as persistent labor constraints, elevated material costs and ongoing supply chain pressures weigh on owner sentiment in the near term.”
In his April 29 press conference remarks, outgoing Federal Reserve chairman Jerome H. Powell said, “The U.S. economy has just powered through shock after shock. People are still spending.”
As of June 2026, the Fed’s benchmark interest rate remained at a target range of 3.5% to 3.75%. In an April 30, 2026, LinkedIn post, Mark Zandi, chief economist at Moody’s Analytics, New York, argued that the effects of the Iran war are making the Fed’s job more difficult. See Figure 2.
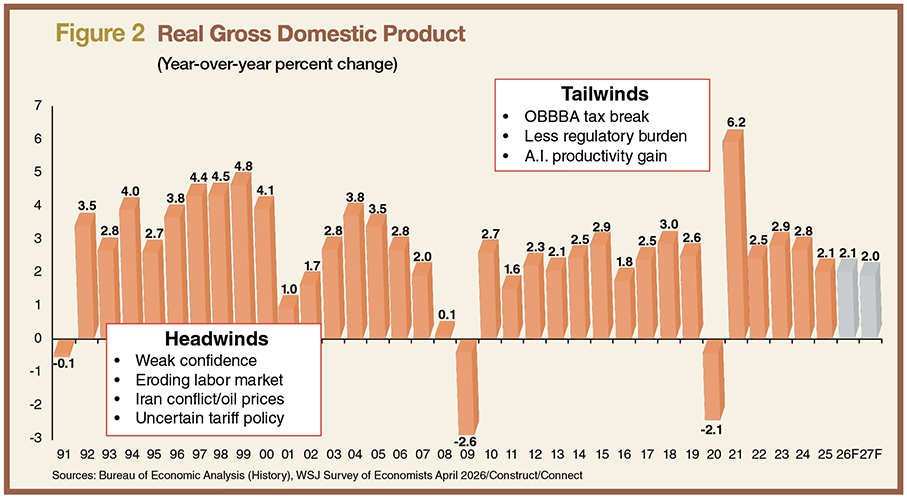
Figure 2
“Slower growth and higher unemployment would normally support additional rate cuts, but inflation—still above the Fed’s 2% target—argues for tighter policy instead,” he wrote.
While Zandi feels we will avoid recession, the risk will remain “uncomfortably high,” leaving little margin for “additional shocks.”
The residential picture
May saw housing starts decrease 15.4% to a seasonally adjusted annual rate of 1.18 million units, according to a report from the U.S. Department of Housing and Urban Development and U.S. Census Bureau. Nonetheless, that is the pace the National Association of Home Builders (NAHB), Washington, D.C., reported would be needed throughout the year to show a sustained rebound.
“The decline in housing starts aligns with NAHB’s latest builder survey, which showed builder sentiment weakening further in June,” said Bill Owens, NAHB chairman and a home builder and remodeler from Worthington, Ohio. “Elevated mortgage rates, affordability challenges and cautious buyers continue to weigh on demand for new homes. Builders are offering incentives and cutting prices, but difficult market conditions are still limiting sustained momentum for new construction.”
Breaking May numbers down, single-family starts decreased 1.9% to an 882,000 seasonally adjusted annual rate and are down 6.7% compared to May 2025. The multifamily sector, which includes apartment buildings and condos, decreased 40.2% to an annualized 295,000 pace and is down 14.2% compared to May 2025. April multifamily was up 19.7% y/y.
On a regional and year-to-date basis, combined single-family and multifamily starts were 17.5% higher in the Northeast, 4.1% lower in the Midwest, 1.6% lower in the South and 4.9% lower in the West. The number of single-family homes under construction is at 587,000 units—5.9% lower than a year ago.
Freddie Mac reported 30-year fixed mortgage rates still over 6.5% in mid June.
The sector landscape
On May 14, 2026, ConstructConnect, Cincinnati, presented “The Construction Outlook Spring 2026.” The webcast brought together economists from ConstructConnect; the American Institute of Architects (AIA), Washington D.C.; and the Associated General Contractors of America (AGC), Arlington, Va.
In addressing nonresidential construction, Richard Branch, chief economist for AIA, said, “Boots on the ground have been flat at best. Some sectors like data centers are performing really, really well, but many, if not most, of the building markets are underperforming. It comes down to three shifts that we are seeing, and they are cyclical, structural and political.”
Branch pointed to high interest rates and rising energy costs.
“Whether this is tariffs, stricter immigration enforcement or increased geopolitical concern, all of these are weighing on developers and altering the calculus of a go or no-go decision on a project,” he said.
While the Iran conflict and higher energy costs may affect construction through the rest of 2026 (fuel and material costs), some areas in the economy could offset the current imbalance.
“Tax benefits that are coming to businesses and families will certainly offset some of that weakening caused by the headwinds,” Branch said. “We are going to start to see some temporary boost in productivity this year thanks to A.I. enhancements.”
Branch added the continued rise in nonresidential renovation remains a tailwind.
The AIA/Deltek Architecture Billings Index (ABI) stood at 47.2 in May. Billings have remained below the 50-point growth threshold since January 2023. Regionally, the ABI showed the South at 49.2, West (44.3), Northeast (43.6) and Midwest (43.5). By sector, institutional landed at 46.2, residential (46.1) and commercial/industrial (43.8). See Figure 3.
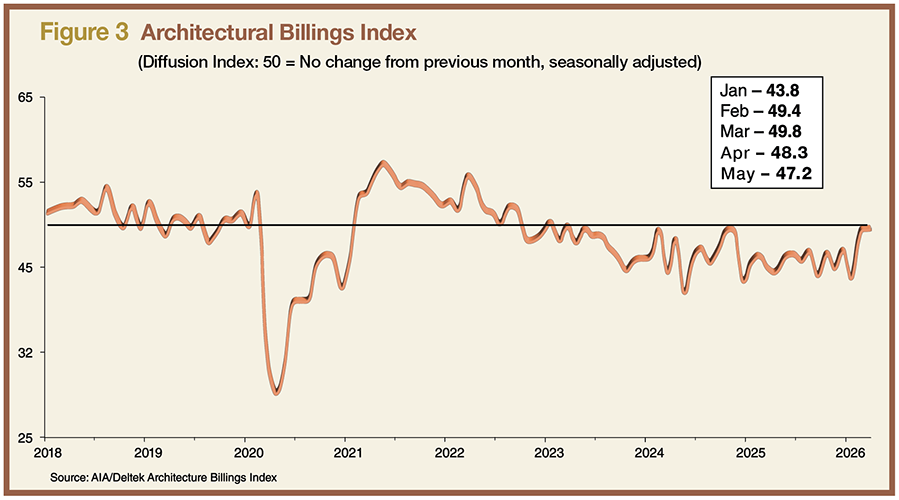
Figure 3
In addition, in May new work inquiries increased for the first time since January, offering modest stabilization. Unfortunately, the value of newly signed design contracts continued their decline as clients explore new projects but remain hesitant. May billing scored 47.2, design contracts (45.9).
Two other ABI measures included the Design Contracts Index (48.0) and the Project Inquiries Index (57.7). Branch said the bulk of architecture the ABI captures is in healthcare, education, retail and traditional offices. Gains in nonresidential spending in recent years (e.g., manufacturing and warehouses) are not sectors architecture firms typically pursue. Branch expects continued weakness into 2027 for nonresidential construction.
In a March AIA survey of architects, more than half said schematic design, design development, construction documents and bidding/negotiation were taking the same amount of time—or even less. By contrast, 61% said the construction administration phase was taking longer.
Employment picture and spending
Ken Simonson, chief economist for the AGC, looked at construction employment through March 2026. April and May numbers have since been made available.
“Nonresidential employment continues to increase at a greater rate than the overall workforce,” he said. “Year-over-year, 32 states added construction jobs in April 2026 [numbers fell in 15 states]. Weakness continued along the West Coast but also showed up more in the Southeast. The Midwest is just charging ahead over the last several months.” Construction employment in May saw modest gains, with 17,000 new jobs added.
While hiring remains soft, Simonson reported that layoffs in construction remain at low levels.
“While contractors don’t see a need for replacing workers, they’re not advertising openings,” he said. “They want to hang on to the workers who are still there.”
Pay levels remain higher for craft workers and nonsupervisory office workers who work in construction when compared to the broader private sector.
Construction, compared with other industries, has traditionally relied on foreign-born workers, so the loss of these workers can weigh heavily on states. Varying by state, California, Nevada, Texas, Florida and Maryland typically had 50% or more foreign trade workers in their construction workforce. In states near the northern border, foreign worker numbers averaged in single digits, though they varied by craft.
“The immigration deportation policies are affecting not just the supply of workers for construction, but, to the extent that states have been adding population from immigration, ... suddenly not having them means less demand for housing, schools, retail and other consumer-facing kinds of things,” Simonson said.
“I do think that economic growth will continue,” he said. “The economy is incredibly resilient, but it’s very unbalanced.”
Input prices for new nonresidential construction rose 1.8% in May and 8.4% y/y, the largest y/y increase since November 2022, according to the Bureau of Labor Statistics’ Producer Price Index (PPI).
Strong bidding shows potential
Kristy O’Brien, director of private content acquisition for ConstructConnect, found that bid activity could portend coming strength in construction. “Overall bid counts are up 10.9% year over year,” she said. “Private is up 12.2%, and public 10.8%. In the fall, private and public were pulling in opposite directions. This spring, they are moving together. The pickup is geographically broad. In tracking prebid statuses [conceptual, design, preconstruction], overall planning projects were down 4.5%, but private sector work is up 26.2%. Projects are starting to pick up that were languishing by owners and developers, including A.I. and data centers, energy, manufacturing, reshoring and many large-scale construction projects.”
O’Brien shared industrial bids are up 341%, the bulk of which are A.I. supercomputer facilities and manufacturing reshoring. Data centers are up 94%, multiresidential 64%, retail 40% and medical 23%. O’Brien said hyperscale A.I. computing is reshaping where construction dollars are flowing across much of the country.
“The multiresidential rebound has been strong in the sunbelt and Mountain West,” she said. “On the other side of the ledger, warehouse and distribution are down 19%, but we feel that’s a managed correction.”
On the public side, O’Brien said the federal and state stimulus driving a lot of public projects has been winding down.
“There are just fewer new public projects coming in to replace what’s been completed,” she said.
Near-term challenges
Michael Guckes is the chief economist for ConstructConnect. His outlook for the construction industry signals near-term challenges. He expects GDP growth of around 1.9% in 2026 and then picking up to 2.5%–3% in subsequent years.
In June, the 10-year government yield hovered around 4.4%.
“Inflation remains a challenge and is closely correlated to the 10-year government yield. We are in this kind of ho-hum situation with the economy,” Guckes said.
Guckes designed the Project Stress Index (PSI), and he is seeing positive news. The PSI looks at project holds, bid date delays and abandoned projects indexed back to 2021.
“A reading of 100 means project stress is at the same level as in the base year,” he said. “Right now, the index stands at 98.7%. What stands out is that abandoned projects have become the main driver of the PSI since 2024. In my view, higher interest rates led many owners and developers to conclude there was no profitable path forward. Simply put, the projects no longer penciled out.”
The April reading showed a positive 5.6% decline from March. Bid date delays were down 9.4%, on-hold activity decreased 2.4%, and abandonments dropped a significant 17.0%. See Figure 4.
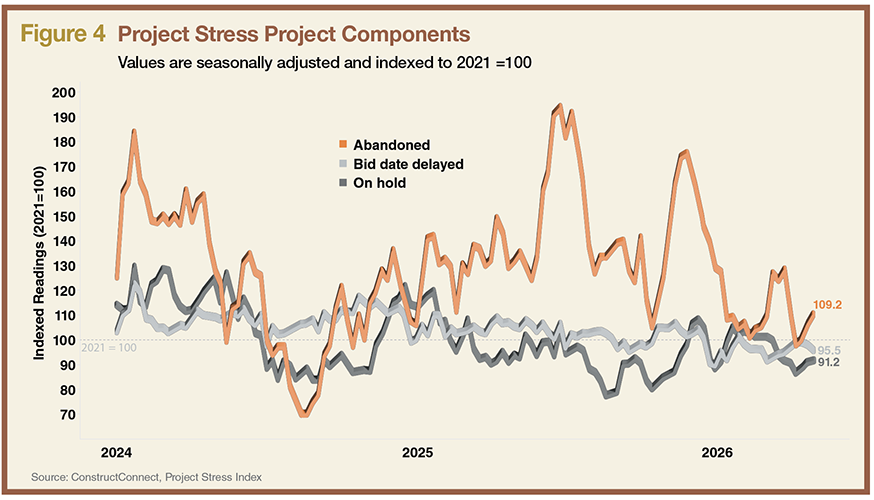
Figure 4
Guckes shared some impressive data center numbers showing growth in this subsector of 380% in the first quarter of 2026. All the other subcategories are “a bit in the distance,” but hotels and motels are up 150%, hospitals grew 115% and civil nearly doubled. Megaprojects—projects over $1 billion in total starts value—account for one-quarter of all nonresidential spending at present, Guckes said.
Categories showing some weakness include sports, convention centers, airports and others, many of which are coming off a peak from years prior. See Figure 5.
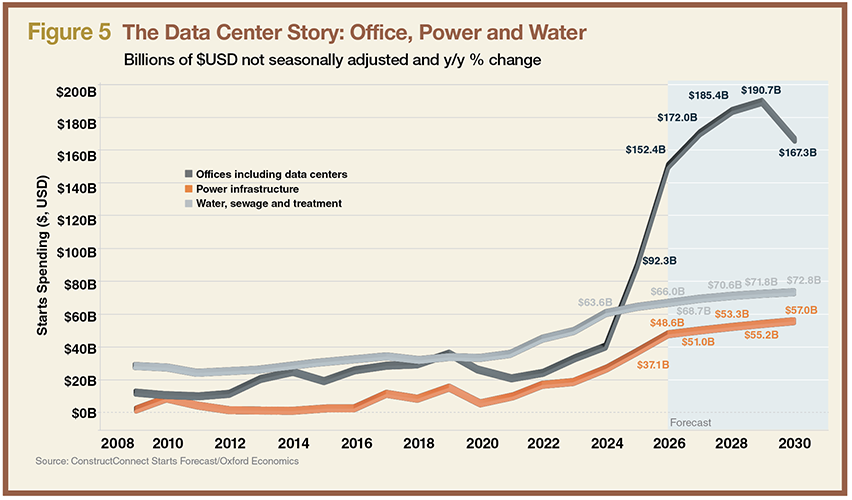
Figure 5
A practical takeaway
The economy may feel underwhelming right now, but conditions could improve if domestic and global sources of economic stress begin to ease. Guckes emphasized that contractors should stay open to opportunities in subcategories performing better in their local market or consider expanding into stronger regions of the country where demand is holding up better. In these unbalanced times, a little strategy can go a long way toward success.
stock.adobe.com/electriceye
About The Author

GAVIN, Gavo Communications, is a LEED Green Associate providing marketing services for the energy, construction and urban planning industries. He can be reached at [email protected].