You're reading an older article from ELECTRICAL CONTRACTOR. Some content, such as code-related information, may be outdated. Visit our homepage to view the most up-to-date articles.
Ratios are useful as both snapshots and video clips. For example, the cash on your balance sheet is a snapshot of your bank balances at one point in time. By the time you generate your financial statements, the cash balance has shifted. So, you must generate a video clip (a trend analysis) to show progress over time. Trend analysis allows you to see where you are going and how fast you are getting there. It provides a context for your own results and a framework for putting your numbers into perspective to minimize the impact of emotion on management decisions.
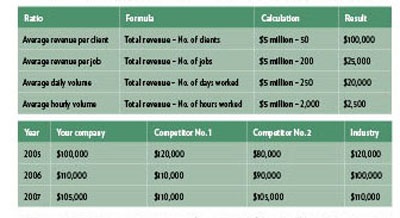
Below are key ratios we discussed last month for a company with $5 million in annual sales revenue: Let’s expand the analysis by taking the first ratio and providing the context of trend analysis.
You would create a table using historical figures from your company, compared to the same figures for two key competitors and the same figures for the electrical contracting industry. Here is an example:
A cursory glance reveals that your trend is not linear: It doesn’t increase or decrease steadily through time. Your average revenue per client is less than the figure for Competitor No. 1 in 2005 and 2007 but even for 2006. Your results are even with Competitor No. 2 for 2007 and ahead for the two prior years. You are slightly below industry averages for 2005 and 2007 but ahead for 2006. Creating a bar chart provides a visual comparison (see above).
The color-coding makes it easier to see results from each year, and each series of bars highlights a company or industry sector. Industry figures may be obtained from various sources. The Risk Management Association (RMA) consolidates figures for the lending industry. The Construction Financial Management Association (CFMA) creates reports for construction industry sectors. The NECA Financial Performance Report offers the most specific numbers for electrical contracting companies.
It can be difficult to obtain financial information for competitors unless they are publicly traded or you belong to a CEO peer group where financial information is exchanged voluntarily. It may be easier to form a group of similar-sized peer companies from noncompetitive market areas to do this comparison. Depending on your contractual arrangements, joint venture partnership arrangements also may be a source for this type of data.
Comparisons provide benchmarks, adding perspective to your internal planning. You measure your own trend over time to see how company performance compares to your original vision. Comparisons with key competitors measure your place in the market, and the industry trend comparison expands that measurement to the entire electrical contracting sector. Charting results over time combines individual snapshots (moments in time) into financial videos that tell a more complete story. You will need a minimum of three years of data to generate a trend, but five to 10 years provides a more accurate analysis.
Your specific goals determine the usefulness of each kind of analysis. Generally, financial analysts use historical trends to evaluate how well management meets obligations and projects future performance. Intercompany analysis spotlights how successfully companies of similar size create market niches, but keep in mind that the comparison is limited by different accounting methods and market strategies. For example, your company may be targeting small, negotiated jobs with high profit potential, while the competitor may have shifted to a high-volume, low-bid strategy.
If you thought financial analysis was an exact science, you can see how many factors create fog and slush to reduce your business visibility. As you implement these calculations into your system, keep in mind that each can be applied specifically to certain work teams or departments and even to individuals. The key is a system of time tracking that is accurate without being burdensome. In other words, you don’t want your people to spend more time tracking their activities than they spend actually producing the work.
As you perfect your ability to use key ratios and trend analysis, you will find it easier to spot problems. You also will become a more accurate predictor of future performance. Now, all you have to do is find the time to apply your financial expertise to create long-term financial and marketing strategies.
NORBERG-JOHNSON is a former subcontractor and past president of two national construction associations. She may be reached at [email protected].
About The Author

Denise Norberg-Johnson is a former subcontractor and past president of two national construction associations. She may be reached at [email protected].