You're reading an older article from ELECTRICAL CONTRACTOR. Some content, such as code-related information, may be outdated. Visit our homepage to view the most up-to-date articles.
Though it wasn't the result of watching any “Star Trek” reruns, the concept of phasors (or phasers to Trekkies) has been raised in a couple of recent discussions. The first was relative to using a phasor diagram to verify the proper connection of the voltage and current sensors to a power quality-monitoring instrument to get the correct value for all power parameters. The second instance came about in the review of several recent articles in the trade journals on phase-measuring units (PMUs), instruments that don’t just monitor the voltage and frequency on electrical distribution and transmission systems. They have the ability to monitor the phase angle of the voltage (and current) phasors with respect to time.
The phasor is a mathematical representation of a periodic signal from the time domain into a single line with a magnitude and direction on a polar chart, rather than the X and Y coordinate-based graphs used to plot the sine waves themselves in the time domain.
In three-phase power systems, each phase is represented by a single vector or phasor. In a normal three-phase system, one would expect that the three voltage phasors would be of equal magnitude and located 120 degrees apart from each other. By convention, we usually plot the Phase A voltage of a wye circuit or Phase A-B in a delta circuit at zero degrees (at the three o’clock position). Whether the system has a clockwise or counterclockwise rotation will determine where the Phase B and Phase C (or Phase B-C and Phase C-A phasors) will be located on the polar plot.
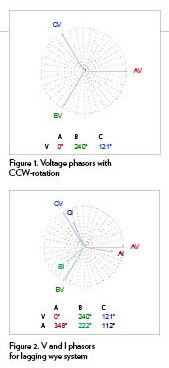
Figure 1 is a wye system with a counterclockwise rotation. One-third of a cycle later in time (5.556 m/sec), the B phasor would rotate past the zero degree point (where A initially is), and A will be where C was and C where B was. In another third of a cycle, Phase C will be at the zero-degree point; in another third, A will be back there, and so on. In a clockwise rotating system, B and C will start out in opposite positions, but B will still rotate next through the zero-degree position that A starts out in, and around they go.
The key to getting correct power data requires that the voltage and current phasors be in their proper relationships prior to recording data. In a lagging power system (inductive-based, as most power systems are) with a counterclockwise rotation, the Phase A current phasor should usually be between three and five o’clock. By lagging, it will cross the zero point after the Phase A voltage phasor does but before Phase B voltage. If there is a leading current (very rare condition), the current Phasor A will cross that point before the Voltage A, followed by Current B then Voltage B, and so on.
Normally, each of the current phasors will be lagging approximately the same amount from their respective voltage phasors (see Figure 2). If the impedances of each of the legs are not the same, the phase angle and magnitudes of the voltage and currents will not be identical. This imbalance can be a problem, as it can cause extra heating of motors, transformers and neutral conductors. During fault conditions, it also can indicate where the fault occurred.
In a delta circuit, the voltages are line-to-line measured, while the currents are line currents. This means that the currents from two line-to-line voltages are being vectorially summed together, which results in the current phase angle having a 30° lagging offset from the voltage to start with. Any additional inductive components in the circuit would produce an additional lagging offset. Hence, we would expect to see the Current A phasor in a delta circuit between the four o’clock and six o’clock positions.
If the phasors aren’t showing up in the correct positions on the instrument’s display before you start recording data, the real power (in watts), which is calculated using the multiplication of the instantaneous voltage, and current waveform samples will not be combining the correct values.
Volt-amperes (Vrms × Irms) will still be correct, since it does not take into account any phase angles. However, since power factor is watts/volt-amperes, PF also will be wrong. Likewise, volt-amperes-reactive (VARs, which should be computed only on the fundamental frequency components and not the power triangle value in a distorted or unbalanced system) will be wrong. Though some software programs can recreate the proper power data wherever there was waveform data stored, this is not the complete picture and will not give you proper demand and energy based on either watts or VARs. Therefore, it is best to employ phasors before you start monitoring.
Next month, we will look into how those same phasors can help make a more stable electric grid.
BINGHAM, a contributing editor for power quality, can be reached at 732.287.3680.
About The Author

BINGHAM, a contributing editor for power quality, can be reached at 908.499.5321.