You're reading an older article from ELECTRICAL CONTRACTOR. Some content, such as code-related information, may be outdated. Visit our homepage to view the most up-to-date articles.
It's amazing that searching the Shakespearean quote “A rose by any other name...” on the Internet can elicit such a wide range of subjects relating to it, from “white Merlot” to “hazards of cell phones on humans” to “juvenile justice Swedish style.” So adding one more relating to power quality to the hundreds of references on the Internet shouldn’t offend any of the literary aficionados in the world. It also won’t settle the debates that have gone on in the standards-making committees throughout the world when it comes to labeling power quality phenomena, particularly those relating to “disturbances” or “events.” But since one person’s disturbance is another person’s nonevent, even those labels get challenged.
The problem here is that nature doesn’t follow the simplicity humans want. When lights blink, a machine stops, or computers reboot. The question of what caused it is usually the first on the list. If we have a simple label for it, then people might think there will be a simple answer to the question, as well. Unfortunately, that isn’t always the case.
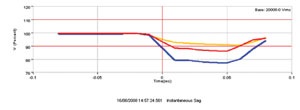
Take the simple root mean square (rms) plot in Example 1, which many would say is just a sag (or a dip in European standards since we still can’t agree on that one). Only two of the phase-to-phase voltages went below the 90 percent threshold of remaining voltage that was used to trigger recording and the subsequent characterization as a sag. But Phase CA (yellow) didn’t go below the limit. The voltage of Phase CA met the requirements to be called a rapid voltage change of 9 percent, which is something usually less than a sag but more than the voltage fluctuations that result in light flicker.
Example 2 is the classic example with all three types of rms variations in a single event. The system was a high-impedance ground, where the common connection point of the three phases, also referred to as the neutral, is not bonded to the grounding electrode but rather through a high-impedance value. When Phase C had a fault to ground (which can be seen by the large current increase in Phase C current only), the other two phases increased in voltage significantly. Eventually, they developed faults (first B then A) and went from swells to sags with the corresponding increase in currents. Eventually, the current levels were high enough for long enough to cause the system protection breakers to open, attempting to clear the faults. When they closed, the source of the faults was cleared, so all three phases returned to normal voltage levels.
To reduce this to a simple interruption would not help explain possible damage to equipment that experienced this sequence of voltage levels. The sags and interruptions would cause equipment to stop functioning unless backed up by an uninterruptible power supply. But the swells were up to nearly 140 percent of nominal for nearly a second on Phase B. That could cause surge protection devices to have to absorb a lot of energy, depending on their clamping voltage. Equipment without such protection also may have experienced damage from the overvoltage condition that one wouldn’t expect to see just from an interruption.
So rather than concerning ourselves with trying to come up with a simple label for a power quality disturbance, I propose that knowing all of the details allows users of such power quality monitors to better understand the source and the solution of the problem, for clearly, one size does not fit all.
BINGHAM, a contributing editor for power quality, can be reached at 732.287.3680.
About The Author

BINGHAM, a contributing editor for power quality, can be reached at 908.499.5321.