Back in my elementary school days, we were taught about writing an article for a newspaper using the five W’s paradigm—what, who, when, where and why (and how). A successful PQ investigation starts with what we are trying to determine and ends with how we do it. The last two articles have dealt with most of the W’s. Now it’s time for the H to take center stage with a look at several typical scenarios.
High failure rate for electric motors
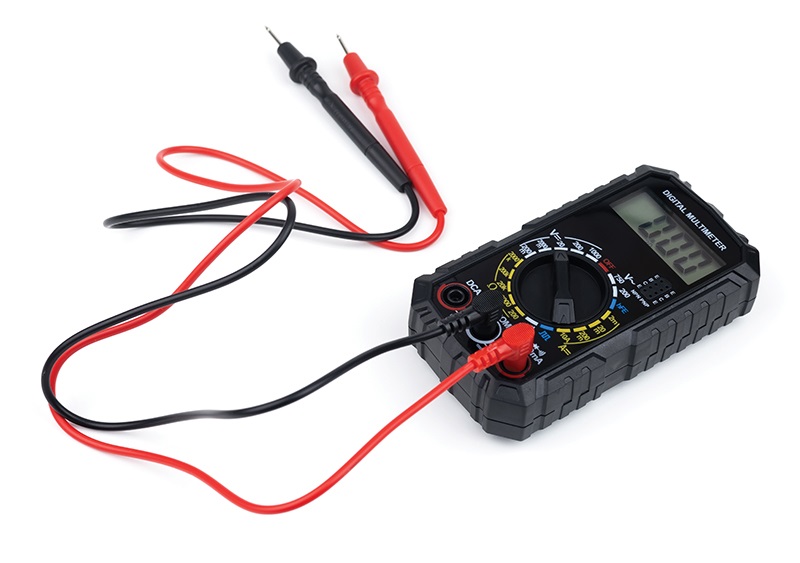
Several causes that affect electric motor reliability can be determined using a digital voltmeter (DVM) with harmonic measurement, as well as voltage and current logging capabilities. The first step is to get a list of component failures from the repair documents. If fluting occurs on the bearings, harmonics are the likely source. Damage from harmonics is mostly caused by long-term effects, which means a DVM with harmonics capability and current probes can measure the levels during normal operating conditions.
Harmonics can cause the motor to run hot due to the losses that are negative sequence components. If the outer windings of three-phase motors are damaged, another possible source is repetitive notching transients from the commutation period in power converters. This would require verifying with either an oscilloscope or PQ monitor with waveform capture.
Lights flickering
It was easier to determine the source of lights flickering when incandescent bulbs were commonplace. The light flicker indices of Pst (perceptibility short-term) could be measured by a PQ monitor with voltage fluctuation measurements, and analyzing when the Pst values were the highest could indicate where to find the source of the problem. In one case, an electric arc furnace 5 miles away caused the problem to increase during the initial scrap melt, every 74 minutes. In another case, it was the neighbor with an arc welder in their garage at night.
With today’s proliferation of LED lights, however, the use of Pst may not lead to the source. In many cases, lights flicker because dimmer components and a particular LED model are incompatible, especially at lower lighting levels, or the LEDs are poor quality.
Computer reboots when light blinks
Most equipment malfunctions that aren’t destructive are caused by the most common PQ disturbance: the voltage sag. This is often indicated by the lights blinking. Since the occurrence is often random and unpredictable, a power quality monitor with voltage sag monitoring capabilities is needed.
To determine directivity—whether the source of the voltage sag is upstream or downstream from the monitoring point—the monitor should be equipped with current probes. If the current goes up significantly when the voltage sags, then the source of the problem is likely back toward the loads.
Since most voltage sags are in the order of 6–100 cycles (0.1–2 seconds), not all voltage loggers are sampling and recording voltage fast enough to capture them. Most PQ monitors with graphic displays will be able to show what caused the event, such as a rapid decrease in voltage followed by an exponential recovery with the current doing the opposite, which would indicate that a motor start is the problem.
Adjustable-speed driver trips off
Many older models of adjustable-speed drives had control circuitry that would get fooled into thinking an overcurrent condition occurred when a power factor capacitor was energized on the electrical supply, usually the utility company. A typical PF cap switching event has a large negative transient followed by a positive transient of similar magnitude and then as decaying oscillating voltage waveshapes. As it is a very short event, about the only way to verify that the PF cap is the source is by using a PQ monitor with transient capture capability.
Alarm system malfunctions
Back when I was a volunteer in the local fire department, we could count on a number of false alarms occurring during severe thunderstorms. It was most often the lightning strikes injecting energy into the distribution system, though another culprit was high winds causing wires to contact vegetation and creating a momentary high impedance fault. Connecting a PQ monitor on the circuit that fed the alarm system is probably the only way to verify this—or convincing the facility manager to put in a better voltage protection system to eliminate false alarms.
Though most of these examples require a PQ monitor, that doesn’t devalue the DVM or voltage logger. Conducting preliminary measurements to check that voltage and current levels are as expected is a practical first step before bringing out the more expensive instruments, which excel in capturing the unpredictable and short-duration nature of many PQ disturbances.
Remember, just because you didn’t record it doesn’t mean it didn’t happen. Check the capabilities and setups of your instrument before the investigation begin.
Eliosdnepr / stock.adobe.com
About The Author

BINGHAM, a contributing editor for power quality, can be reached at 908.499.5321.