You're reading an older article from ELECTRICAL CONTRACTOR. Some content, such as code-related information, may be outdated. Visit our homepage to view the most up-to-date articles.
In June, The U.S. Department of Energy (DOE) released the full public use files from the 2012 Commercial Buildings Energy Consumption Survey (CBECS). This survey provides a massive amount of data describing the national stock of commercial buildings. How many healthcare buildings are in the South? What’s the total floorspace of education buildings built before 1980? How much building floorspace built before 1980 has received a lighting upgrade? The CBECS has an answer to these and many other questions.
The 2012 survey updates the 2003 survey. Originally, the DOE planned a 2007 survey but canceled it due to faulty research by the contractor. Congressional spending cuts then delayed the 2011 survey. In 2012, the DOE was able to start again.
First, a word about methodology. The CBECS is based on highly detailed interviews among a sampling of 6,700 building owners. This data was then used to produce national estimates of total number of buildings, floorspace, age, type, region, energy consumption and more. The survey defined a commercial building as having at least half of its floorspace dedicated to a purpose that is not residential, industrial or agricultural. So it includes schools, hospitals, etc.
An estimated 5.6 million commercial buildings operated in the United States in 2012, a 14 percent increase over 2003, and constituted 87 billion square feet of floorspace, a 21 percent increase. The number of office, warehouse, food service and public assembly buildings increased, while some markets, such as retail/malls and grocery/convenience stores, decreased. With its large population, the South (Census region) had the largest population of commercial buildings and floorspace, followed by the Midwest and West. The Northeast has the smallest number of buildings but is the largest in terms of floorspace.
Three-fourths of commercial buildings were 10,000 square feet or smaller; about half were 5,000 square feet or smaller. The median building size was, therefore, 5,000 square feet or smaller, though the average size was 17,500 square feet due to the weighting impact of a small number of very large buildings. Buildings over 100,000 square feet constituted only 2 percent of the total number of buildings but 35 percent of the floorspace.
On average, the largest buildings were in the education, healthcare and lodging markets. Newer buildings tend to be larger; most were buildings in the healthcare, lodging, retail and religious worship markets—continuing a longstanding trend.
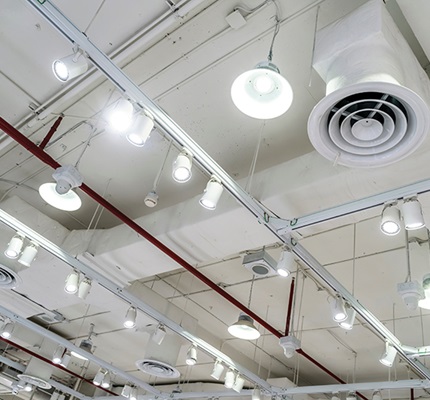
Linear fluorescent lamps continued to predominate in commercial lighting. The DOE estimated that this source illuminated about 92 percent of floorspace. Linear fluorescent was followed by compact fluorescent (62 percent), incandescent (44 percent), high intensity discharge (HID) (27 percent) and light-emitting diode (LED) (25 percent). The high incandescent and LED numbers are most likely due to exit signs.
The most popularly installed lighting control strategies were occupancy sensors (41 percent of floorspace), time-based scheduling (35 percent), multilevel or dimmable lighting (17 percent) and daylight harvesting (7 percent). While extensive in terms of floorspace, these strategies are prevalent in a relatively smaller percentage of buildings. For example, while daylight harvesting is deployed in an estimated 7 percent of floorspace, it is installed in only 2 percent of buildings. Multilevel and dimmable lighting are installed in 6 percent of buildings, and occupancy sensors and time-based scheduling are in 15 percent and 17 percent, respectively.
One of the most significant takeaways from the 2012 CBECS is that a persistent retrofit opportunity for lighting systems in commercial buildings remains.
Lighting retrofits are most profitable in buildings with older lighting systems. These buildings tend to have spaces that are overlighted and use obsolete technology. Add long operating hours and high energy rates, and the building is often a good candidate for a lighting upgrade.
About 2.8 million buildings, constituting 38.6 billion square feet, have been built before 1980. These numbers represent about half of all buildings and 44 percent of all floorspace. CBECS estimates that 693,000 of these buildings, and 15.5 billion square feet, have received a lighting upgrade. These are substantial numbers, but consider the converse. Lighting upgrades have not been completed in about 75 percent of commercial buildings—60 percent of the floorspace—that were built before 1980. That is nearly 2.1 million buildings and 23.1 billion square feet.
There’s plenty more in the 2012 CBECS that can be used for business planning oriented around the existing buildings market. The lighting data alone can be parsed by building size, age, type, region and so on, providing rich insights. It’s important to note, however, that the results are estimates based on a sample population. One should view the results with an educated eye; for example, the lighting data suggests an installed base of LED lighting covering 25 percent of floorspace, but, again, that is highly unlikely to be LED general lighting and is most likely due to exit signs. It’s also important to remember that how some data appears depends on how the question was interpreted by both the DOE and the respondent.
Check out the 2012 CBECS at www.eia.gov/consumption/commercial.
About The Author

DiLouie, L.C. is a journalist and educator specializing in the lighting industry. Learn more at ZINGinc.com and LightNOWblog.com.