You're reading an older article from ELECTRICAL CONTRACTOR. Some content, such as code-related information, may be outdated. Visit our homepage to view the most up-to-date articles.
In a perfect world, a lighting manufacturer would respond to interest in one of their products by assuming the cost of installing samples in an exact mockup of the actual space being designed. Then, the manufacturer would hire people to work there for a while and conduct a postoccupancy survey on their satisfaction with the lighting.
In the real world, we have photometric reports. Commonly available for specification-grade lighting products, these reports are found on the catalog sheet. What a report says about a lighting fixture can be used to predict how it is likely to perform in a given application and help us choose the right fixture. Specifically, we can determine how the light is distributed, how efficiently it is distributed and how likely it is to produce glare or unwanted patterns.
What are the basics that we need to know, so we can properly read and interpret photometric reports? The most important items on the report are the candela chart and the candela distribution curve, which give us a picture of the fixture’s distributed lighting pattern. All the other items on the report, such as zonal lumen distribution, fixture efficiency and fixture spacing criteria are derived from the numbers in the candela chart’s table.
(Note that this article focuses on Type A photometry, which covers indoor general light fixtures, not Type B photometry, which is used for floodlighting and other outdoor fixtures.)
We have now determined the light intensity values for a single vertical plane intersecting the cross section of the fixture at its center. If the fixture emits light in a perfectly symmetrical pattern in all directions, this would be enough to evaluate the fixture’s lighting distribution. But most fixtures—from 2-by-4 troffers to linear direct/indirect pendants to wall washers—do not.
This means we need to repeat the process of measuring light intensity at 0 to 180° from different positions around the fixture to create more vertical planes and get the complete story. Instead of looking at the fixture from the side, now we must look at it from the top and draw an imaginary line through its center. Typically, measurements are repeated at an angle parallel to the lamp axis (0°), 22.5°, 45°, 67.5° and perpendicular to the axis (90°), with 0°, 45° and 90° being the primary angles. These are the horizontal viewing angles. Ninety degrees gets us a quarter of the way around the fixture and is enough to give us a complete picture if the fixture has a standard symmetrical geometric shape.
The result is a mapping of light intensities at different combinations of vertical and horizontal viewing angles. Visually, this three-dimensional pattern would look like an oddly shaped bubble. Change the fixture’s reflector design, shielding and even just its lamp/ballast combination, and this bubble will morph into a new shape.
The candela chart
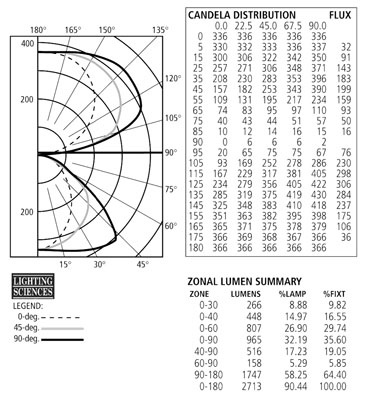
All of the above data is available in the photometric report’s candela (cd) chart. The horizontal viewing angles (0°, 22.5°, 45°, 67.5°, 90°) are the column headings and the vertical angles (0° to 180° in increments) are the row headings. Figure 2 shows an example for a direct/indirect fixture. If we are facing the fixture perpendicularly (90° horizontal viewing angle) with our eyes at a 55° vertical viewing angle from the fixture’s 0° line (nadir), then the relative light intensity at that point is 234 cd. If we then circle the fixture until we are facing its cross section (the end of the fixture, a 0° horizontal viewing angle) at a 55° angle with the center of the fixture (vertical viewing angle), then the relative light intensity at that point is 109 cd. At a 55° viewing angle, the fixture emits more than twice the amount of light intensity on a 90° vertical plane than a 0° vertical plane.
The candela chart is important because it can be used for detailed analysis of a fixture’s distribution of light and its impact on lighting levels and potential glare conditions using lighting design software. For this purpose, many manufacturers make the data available as downloadable electronic files on their Web sites. These files are typically based on a standard format created by the Illuminating Engineering Society (IES), which is why they are often called “IES files.”
Note that the candela chart is generated based on a specific fixture and lamp combination, so a three-lamp T8 fluorescent fixture report will not apply to the two T8 version of that same product, nor will it apply to a three-lamp T5 fluorescent model. Further, the ballast used in the test is a reference ballast—which means the lighting output is reported as though the ballast were delivering 100 percent of the rated test lamp lumens—so the actual ballast factor will have to be applied as a light loss factor. Similarly, if the lighting output of the specified lamps is different than those used in the photometric test on which the report is based, further adjustment will be necessary.
The candela distribution curve is a graphical representation of relative light intensity for a single vertical plane based on candela readings across the vertical viewing angles (0–180°) for a single horizontal viewing angle (see Figure). Since the distribution of light intensity varies based on the horizontal viewing angle, several patterns may be overlaid on top of each other; in this example, the pattern at a 90° horizontal viewing angle is shown as a solid dark line, a 45° angle as a lightly shaded line, and a 0° angle as a dashed line. The lines radiating from the center of the fixture are the vertical viewing angles from 0° to 180°. The concentric circles represent candle-power, with each progressive outward circle being a larger candela value.
While not as precise as the candela chart, the candela distribution curve can provide much of the same useful information and in an at-a-glance visual format. For example, looking again at Figure 2, suppose we would like to avoid a light intensity exceeding 300 cd at 55 to 90° vertical viewing angles because of glare concerns. Doing some simple eyeball estimating, candle-power is around 200 cd at 55° on a 90° vertical plane, 150–200 cd at 55° on a 45° vertical plane, and less than 100 cd at 55° on a 0° vertical plane.
Useful interpretations
Looking at the photometric report, probably the easiest thing to note is whether the fixture is direct (the light is emitted below the horizontal axis), indirect (the light is emitted above the horizontal axis), or direct/indirect (a mix of the two, and to what degree). The fixture in Figure 2 emits 64 percent of its light output up and 36 percent of it down.
We can also tell whether distribution is symmetrical (light output is emitted in a roughly equal pattern on both sides of the fixture) or, as is common with cove lights and similar fixtures, asymmetrical (light output is restricted to one side or the other). If the fixture has symmetrical distribution on both sides, only half of the drawing may be shown, as in Figure 2.
Additionally, we can tell whether the fixture has a spot distribution (narrow pattern), narrow and medium flood (fuller pattern and a flatter bottom), or wide flood (wide pattern and possibly a “batwing” shape where peak distribution is on each side of the center instead of directly above or below the fixture). We can tell whether the fixture is likely to produce a smooth light pattern (smooth, rounded candela distribution curve) or “streaking” on walls or the floor (striations in the pattern). And we can tell whether the fixture is likely to produce glare (a high concentration of direct light intensity is being emitted above a 60° vertical viewing angle). An experienced eye can learn even more than that at a glance.
Other interesting data in the photometric report are derived from the light intensity measurements, such as zonal lumen summary and fixture efficiency.
The zonal lumen summary table lists the fixture’s light output, in lumens, in specific zones and then summarizes for all light emitted down (0°–90°), up (90–180°) and total (0°–180°). These values are used to calculate the fixture efficiency, the percentage of lamp light output in lumens that exit the fixture relative to the total lamp lumens that go into the fixture. Fixture efficiency is the sum of all zonal lumens ÷ nominal lamp light output 100. The fixture portrayed in Figure 2, for example, has an efficiency of 90.4 percent. But while higher efficiency is generally better, we must consider where that light is going to determine if the emitted light is actually useful. Unshielded fluorescent striplights can be as efficient as 95 percent, but would be considered a “glare bomb” by office workers. There is often a tradeoff between fixture efficiency and optical control: The more the fixture works to deliver light where it is wanted and block it where it is not wanted, the lower its efficiency will be.
Initial cost, aesthetics, ability to provide target light levels, and lamp/ballast efficiency are all important considerations when choosing a lighting fixture. But they say nothing about how the fixture will actually perform in the space, and what impact it will have on the people who use the space for work or leisure. What we really need to know is how the light is distributed, how efficiently it is distributed, and how likely it is to produce glare or unwanted patterns.
It’s all in the photometric report.
DILOUIE, a lighting industry journalist, analyst and marketing consultant, is principal of ZING Communications. He can be reached at www.zinginc.com.
About The Author

DiLouie, L.C. is a journalist and educator specializing in the lighting industry. Learn more at ZINGinc.com and LightNOWblog.com.