Understanding Voltage Fluctuations and Their Impact
The lights blinked for an instant, or a running appliance made a sound like the motor was slowing down. No digital clocks were blinking, no computers restarted, no production lines stopped. It wasn’t going on continually like light flicker, nor was it severe enough of a voltage drop to be classified as a sag. So what was it?
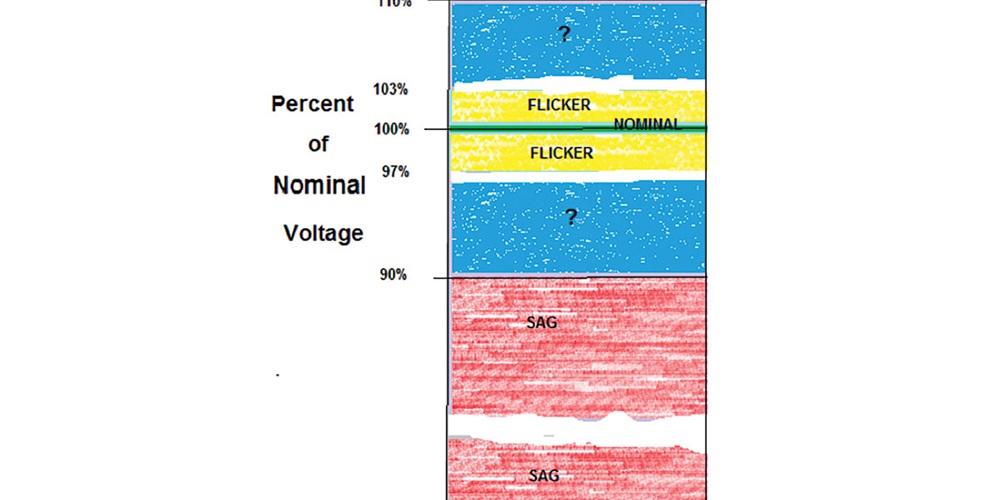
If the root mean square (rms) of the voltage in a cycle exceeds the upper threshold—typically 110%—it is a swell. Below 90%, it’s a sag until all three phases go below 10%, and then it’s an interruption. If the rms of the voltage modulates or varies 1%–3% at a rate less than 30 hertz (Hz) and especially around 9 Hz, then that fluctuation will likely result in light flicker of incandescent and some other types of lighting.
But what about the in-between zones (the blue regions in Figure 1)? Electricians may not be familiar with the term rapid voltage change (RVC), but it can be a useful diagnostic tool for assessing subtle power quality issues. Most power systems throughout the world experience it, but in the United States, many don’t have a label for it. Perhaps because it doesn’t cause problems like sags or swells, even though it may be a precursor to more significant problems.
What Is Rapid Voltage Change (RVC)?
There is a parameter defined and used in Europe and around the world that describes this region as “rapid voltage change” (RVC). It has appeared in some international standards for years, but it wasn’t mathematically defined until the Norwegian Water Resources and Energy Directorate did so in 2005. The third edition of the International Electrotechnical Commission 61000-4-30 power quality measurement methods now includes it. RVC is an abrupt transition between two steady state voltage levels, sort of like a step change from the steady state voltage, usually more than 3% and less than 10%. The change needs to occur rapidly; think of it as a “blink.” A slowly decaying nominal voltage wouldn’t be considered an RVC event.
Defining RVC Events Mathematically
The following is the mathematical method for determining if such an event occurred:
- Compute the arithmetic mean of the voltage waveforms over 1 second. If all cycles remain within the RVC threshold, then steady state has been established.
- Once steady, if an rms voltage cyclic value crosses the threshold, then an RVC event has started.
- The RVC event is considered ended when the steady-state condition over 1 second occurs again. Until then, if the voltage change is greater than the previous value, then a new maximum excursion value is saved.
- Once steady-state is achieved, the duration is determined by subtracting the end time from the start time minus the 1 second delay used for making sure that things are steady.
- The new steady-state voltage may be different from the original condition. In fact, that is quite common, unless a single load went on and off to cause the event. This new steady-state value is subtracted from the original steady state value to get the change or delta in steady state voltage.
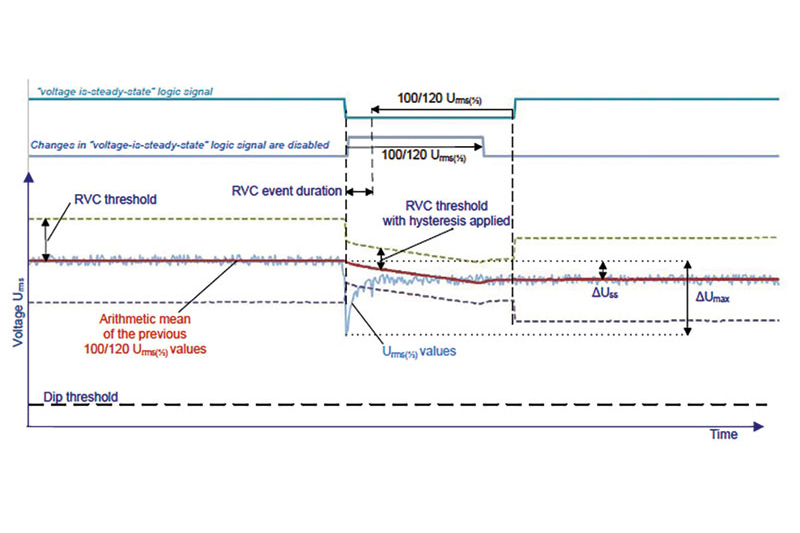
- These three values (max deviation voltage, delta steady-state voltage and duration) are used to characterize an RVC event. Like with sags and swells, the values can help determine what was a probable cause of the event. Visualized, the event can look like Figure 2 below, from the 61000-4-30 standard. Note that, in IEC standards, U is for voltage, and a dip is the same as a sag.
What Causes RVC Events?
The usual suspects that cause an RVC event are similar to those for sags. Ohm’s and Kirchhoff’s laws still apply. A load turning on and drawing a significant amount of current as compared to the system’s short-circuit current potential will cause a voltage drop across the combined source impedances, leaving less voltage for the loads. HVAC units are common culprits. In a series of articles in ELECTRICAL CONTRACTOR, it was a 5-ton HVAC unit at a residential dwelling that caused the lights to blink every 22 minutes in the summer when outside temperatures were in the nineties.
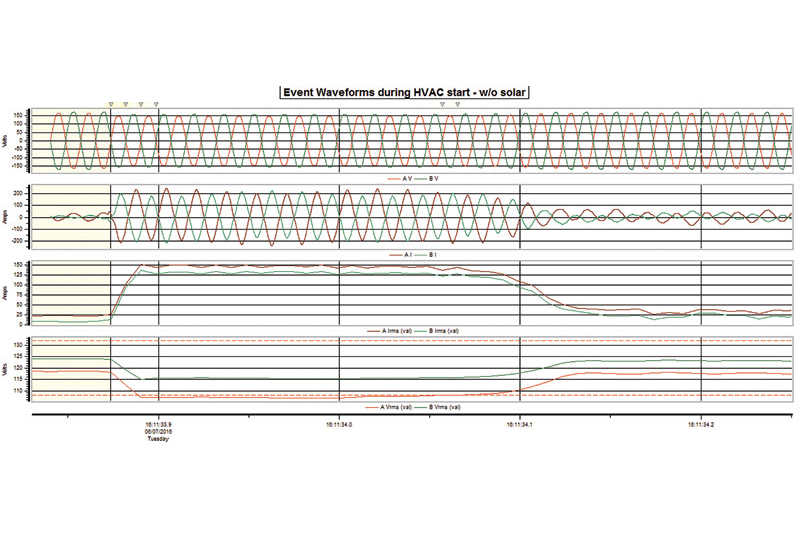
In Figure 3, the Phase B voltage (green plot) is a RVC event while the Phase A voltage (red plot) would be considered a sag. If the nominal voltage of A had been higher, closer to B, then it would also have been labeled an RVC, not a sag.
Though it may seem silly to differentiate these two, it is a helpful clue when you only have written descriptions of events. A sag on one phase only would likely seem to be caused by a single-phase load. However, if RVCs occur simultaneously on the other phase(s), it may point to a voltage or current unbalance caused by a polyphase load—something field electricians should consider during troubleshooting. Ongoing RVC events that get more severe can indicate degradation, whether in the electrical distribution system (such as source impedances getting higher), or the load’s impedance is drawing more current.
Eventually, it can become big enough to become a sag. While the sag threshold of 90% is a generalization of a potential problem, setting the threshold to a value meaningful for the ride through capability of critical loads can foretell process interruptions or production losses in the future if the problem is not addressed.
It may not just be a load-side-initiated problem. Suppose a photovoltaic generator is providing a significant portion of the power to a facility. A cloud transient, such as one caused by a plane flying between the panels and sun, can cause a rapid drop in the source voltage, also qualifying as an RVC. An array of various distributed generators coming on and off at different times without an overall control scheme can have the same effect.
Why RVC Matters for Electricians
RVC is more than just a new label. For electrical contractors, tracking these events can provide an early warning of load imbalance, source impedance issues or equipment degradation. Some PQ monitors have the capability to report it. It’s another data point of what is going on in the system, often like an early warning signal, of possible doom in the future if the source isn’t evaluated.
About The Author

BINGHAM, a contributing editor for power quality, can be reached at 908.499.5321.