You're reading an older article from ELECTRICAL CONTRACTOR. Some content, such as code-related information, may be outdated. Visit our homepage to view the most up-to-date articles.
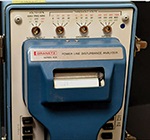
With the fifth generation of power quality monitors comes more parameters, features, communication modes and, for some users, challenges getting the answers that they want from the instruments. More of everything means more things to set up or program and, with that comes more chances to do it incorrectly. In some ways, the Model 606 Powerline Disturbance from Dranetz Engineering Laboratories in 1975 was simple to set up. A screwdriver is used to turn the four rotary switches: nominal voltage range, slow average, sag/surge voltage deviation from nominal, and impulse magnitude. Note: A “surge” back then is what we know as a “swell” in post-IEEE 1159 terms.
It was certainly a simple setup, and highly visual, but not without its drawbacks. The device in the photo above was the thermal printer. If users set the switches incorrectly based on actual conditions on the circuit they were monitoring, they could find an entire roll of thermal printer paper at the instrument base the next morning.
While some products claimed no setups were needed to capture everything you wanted, most products still are user-programmable or automatic by letting the instrument decide based on nominal conditions. Some still think capturing every data point on every cycle of every channel for a month will get your production line back up and running following a power quality disturbance (try transferring 4 gigabytes of data through a Bluetooth connection). However, you need to spend a few minutes to think of what you want to see that will provide the answers you want. As a salesperson once noted, “Why catch the entire ocean of sea creatures when you just want a particular type of fish?”
So, how do you get the most out of your power quality monitor? The first step is to determine what you most want to get out of it. What is your application—surveys, such as benchmark, periodic audit, or quality of supply compliance; troubleshooting on the distribution system; or explaining the shutdown of a piece of equipment?
The basic survey or trend process is pretty straightforward to set up. Some monitors have a preprogrammed setup for voltage compliance, such as the European standard EN 50160. Here you want to record the typical power quality metrics every 10 minutes for a week so that you can plot trends and compute statistics, such as the 95 percent probability graphs. These include steady-state voltage magnitude, power frequency, voltage unbalance and harmonic voltages. Record any significant changes in the root-mean-square voltage that are commonly considered to be problematic, including sags, swells and complete interruptions, along with rapid voltage changes and voltage fluctuations that are less severe than sags but are symptomatic of other potential problems.
Set the nominal voltage correctly. If possible, periodically capture a series of waveforms with the monitor, typically 10–12 cycles that are required to calculate harmonics per IEEE 519 and IEC 61000-4-7. It is useful to create other information from the data after the fact, if needed. Voltage fluctuations that may result in light flicker are recorded using perceptibility short term (Pst), which can also serve as an indicator of disturbances, such as repetitive arcing transients or other low-level disturbances that haven’t become a larger problem yet.
Troubleshooting is often the most challenging because the disturbance may not happen again for a week, month or ever. Ask for any correlating data, such as if the lights blinked or someone heard thunder, which can aid in the setup of the numerous triggers. Most times, it starts with a broader look at what is going on in the system without collecting gigabytes of “boring” data. If the problem is suspected to originate on the utility system, place the monitor at the point-of-common-coupling. If a particular equipment misoperated, place it there. Monitor all of the voltage and all of the current signals that are possible, including neutral-to-ground voltage and both neutral and grounded conductors. It is critical that current probes or transducers (CTs) are selected for the maximum and minimum current levels expected, they are oriented in the proper direction, and the correct scale factors are applied. Most CTs are best used in the 10–100 percent of full scale, with three times overcurrent readings possible without clipping the peaks. Program the nominal and range settings correctly.
Start by using the vendor’s standard or recommended limits or thresholds for the triggers until you get a sense of what is happening on the system. Run the recording mode for 30 minutes, and look at the data. It may be necessary to tighten up a few of the parameters to record smaller variations in voltage or current. However, filling memory with 1 percent variations or recording every one of the thousands of parameters every 30 seconds is about the same as dumping the entire roll of thermal paper on the floor 40 years ago. The answer you want may be in there, but it may take you a week to find it, and no one has that time anymore.
About The Author

BINGHAM, a contributing editor for power quality, can be reached at 908.499.5321.