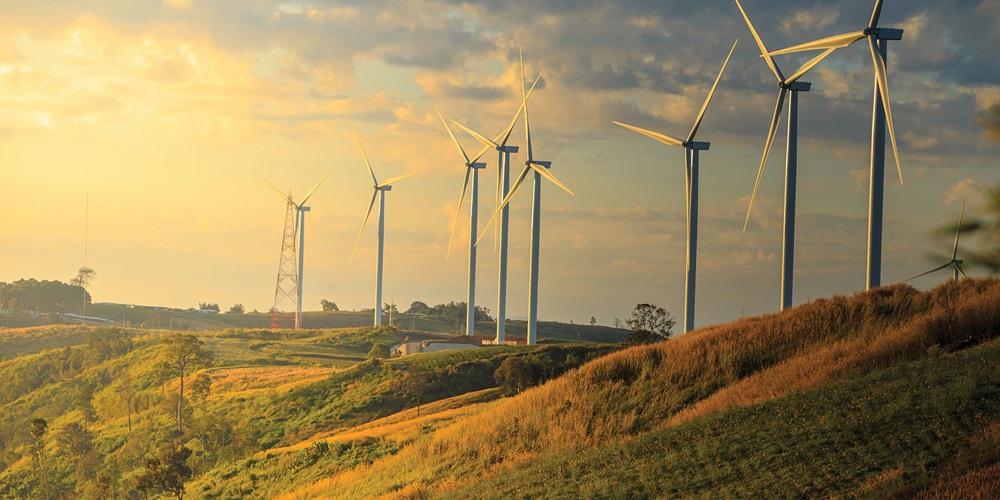
The buzzword “intermittency” is used to minimize the potential of wind farms to become even larger contributors to a secure, reliable U.S. energy system, but a new report highlights how this argument is becoming less relevant. Thanks to design improvements and sophisticated siting, the latest generation of wind turbines is pushing closer to performance levels found in traditional coal and natural gas plants and even exceeding them in some regions at certain times of the year.
The 2017 Wind Technologies Market Report, released in August by the Lawrence Berkeley National Laboratory (LBNL) for the U.S. Department of Energy, is a snapshot of last year’s wind production. Among its more important findings: wind turbines installed between 2014 and 2016 had an average capacity factor of 42 percent during 2017. This means their production—had they been running at full speed the entire year—totaled 42 percent of what was theoretically possible at their nameplate capacity.
This figure represents a big jump up from the 31.5 percent average capacity factor found for projects installed between 2004 and 2011, and it is approaching the performance levels of conventional fossil fuel plants. In its June 2018 Electric Power Monthly, the U.S. Energy Information Agency reported 2017 average capacity factors of 53.5 percent for U.S. coal plants, and 54.8 percent for natural gas combined-cycle generators.
Paul Veers, chief engineer of the National Renewable Energy Laboratory’s National Wind Technology Center, credits manufacturers for the performance leap seen in newer turbines. This is especially true for wind-turbine rotors, which include both turbine blades and the hub to which those blades are attached. The rotor is connected to the main shaft, which, in turn, drives a generator when the rotor is in motion.
“Manufacturers have been making machines that have a bigger rotor in relation to their electrical rating,” he said.
This allows the turbine to get closer to its theoretical nameplate capacity at lower wind speeds. For example, 10 years ago, the rotor of GE’s 1.5 megawatt (MW) turbine featured a 77-foot diameter, compared to the 100-foot rotors on today’s 1.8 MW turbines. Longer blades create a broader windswept area, leading to greater electricity production per turn.
Bigger doesn’t mean more expensive in this case. Blade makers have fine-tuned their products using laser guides and other manufacturing techniques to boost productivity along with blade length.
“That way they can run at full capacity more frequently,” Veers said. “Blade technology has allowed them to make larger blades at marginally less cost.”
Mounting turbines on higher towers is another element boosting capacity factors in newer installations, according to the report. Average hub height for turbines installed in 2017 was up 4 percent, versus 2016, and a whopping 54 percent since 1998–1999, allowing turbines to access steadier and stronger wind resources. This is a trend LBNL researchers expect will continue, as more than 35 percent of permit applications filed in early 2018 had hub heights over 500 feet.
But developers are using computer modeling to be more strategic in how they place the highest towers within their projects. Nearly a quarter of the larger projects installed in 2016 and 2017 used towers of varying heights, rotor diameters or capacities. This strategy can help maximize the wind resource by minimizing the impact one turbine’s “wake effect” might have on the performance of others sited around it.
Thanks to technological improvements, turbine costs have fallen steadily over the last decade. The report notes that turbines installed in 2017 cost 40–50 percent less than those put into service in 2009 and 2010. The drop in turbine prices has helped drive lower total installed-project costs, as well. The report documents turbine installation costs falling by a third, on average, between 2010 and 2017, a trend the report’s authors see continuing into 2018.
The federal production tax credit (PTC) and investment tax credit (ITC) have been big factors in wind energy’s success, and those incentives are currently being phased out. Future projects will need to begin construction by the end of 2019, which some analysts see driving a short-term boom. In July, MAKE Consulting released “North America Wind Power Outlook 2018,” which estimates more than 30 gigawatts of new wind capacity will be installed between 2018 and 2020, with growth declining after 2021.
Veers is among those who remain bullish on wind energy’s future, despite the potential impact the PTC and ITC phase-outs could have on project financials. Leading his reasons for optimism are the turbine technology advances he believes are still to come.
“We haven’t finished, where we are now,” he said. “I think everyone in the industry is confident there’s more room to improve.”
Editor’s note: See also Jeff Gavin’s “Strong Winds Forecast."
About The Author

ROSS has covered building and energy technologies and electric-utility business issues for more than 25 years. Contact him at [email protected].